VI. Unexpected Large-Scale Structures
& Violations of Homogeneity and Isotropy

Introduction. The
observed 'island universes' or galaxies in the Universe
exhibit not only clustering, but also super-clustering, vast line-like structures, walls and voids, and gigantic
streaming rivers of galaxies. These unexpected large-scale features raise three
questions in the search for empirically-testable, scientific
cosmologies. (1) Would these titanic structures require more
cosmic time to interact and form than allowed by the current
ΛCDM concordance edition of the HBBC (~13.8 Gya)? (2) Are
there peculiar features of these survey maps which indicate
that there is a non-Hubble relation component contributing to
the redshifts of some of the galaxies in clusters and
super-clusters? (3) Are there any data suggesting that the
temperature fluctuations of the CMB are connected with the
large-scale structure of the Universe?
The answers to all three of these questions are likely to be,
Yes!
In this section, we will briefly examine how large-scale
inhomogeneities, anisotropies, and structures increasingly
depart from the requirements of the ΛCDM concordance HBBC
paradigm.
In history, the tensions between human cosmological
beliefs and the contrasting emerging empirical data have
been centuries long!
Gradually humankind has increasingly discovered the
macroscopic structures of the World around us, always
against some restrictive cosmological mythology (link).
The ongoing cosmological demotion of humankind as more and
more insignificant has been continuing apace, despite some
notable attempts to rehabilitate human centrality.
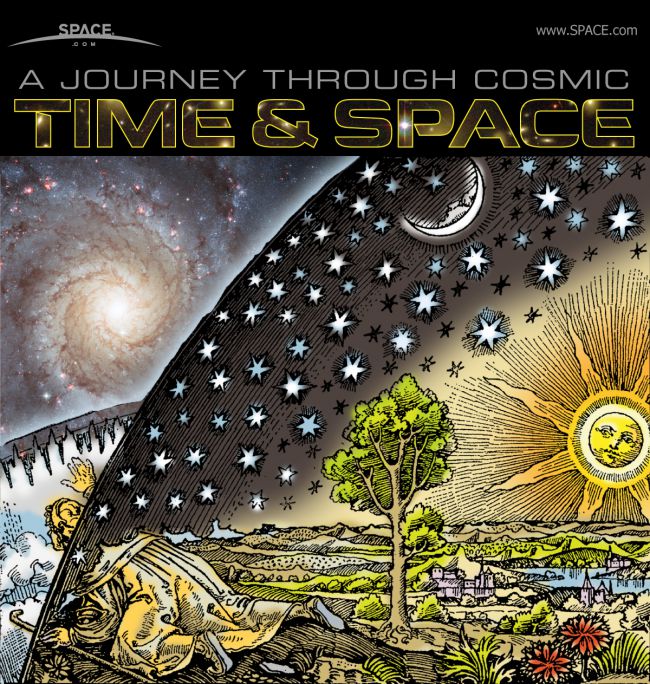
Conceptions of medieval views
juxtaposed with a Hubble view of the Whirlpool
Galaxy: This image is paradigmatic of the mix of
belief conceptions and actual observed data which
have long comprised human cosmologies
(https://www.space.com/13336-universe-history-structure-evolution-infographic.html).
|
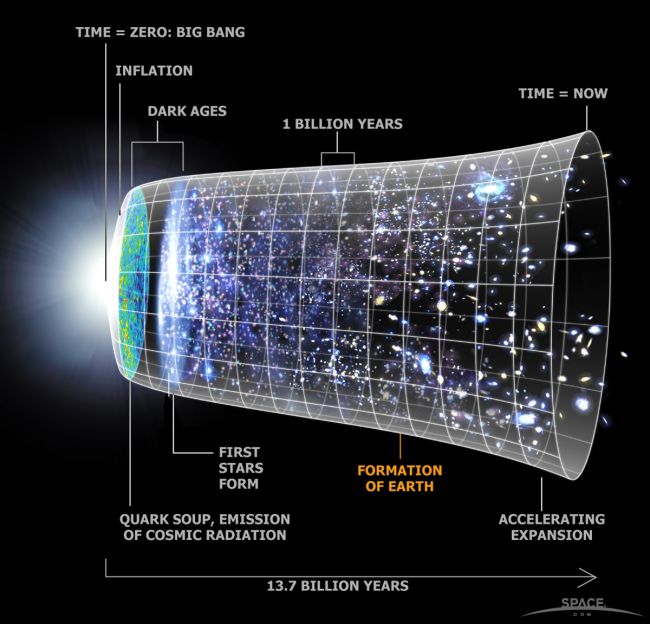
The new Ptolemaic system of the
HBB Cosmology: A mix of some of the data
observations with a predominant model and set of
assumptions, including multiple adjustable
parameters in the concordance LCDM edition of the
Big Bang. The emerging data call this dominant
model at least into some question on a variety of
points.
|
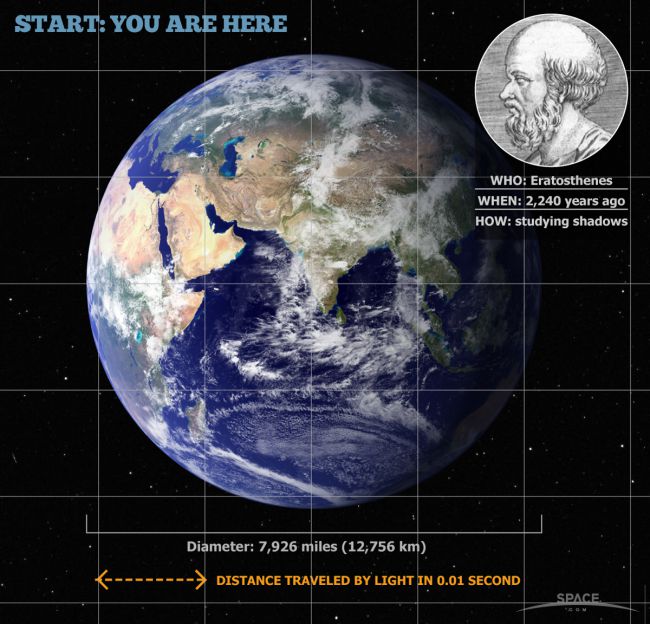
One of the great leaps forward was
Eratosthenes determined the spheric geometry and
estimated the diameter of Earth.
|
|
|
|
|
|
|
|
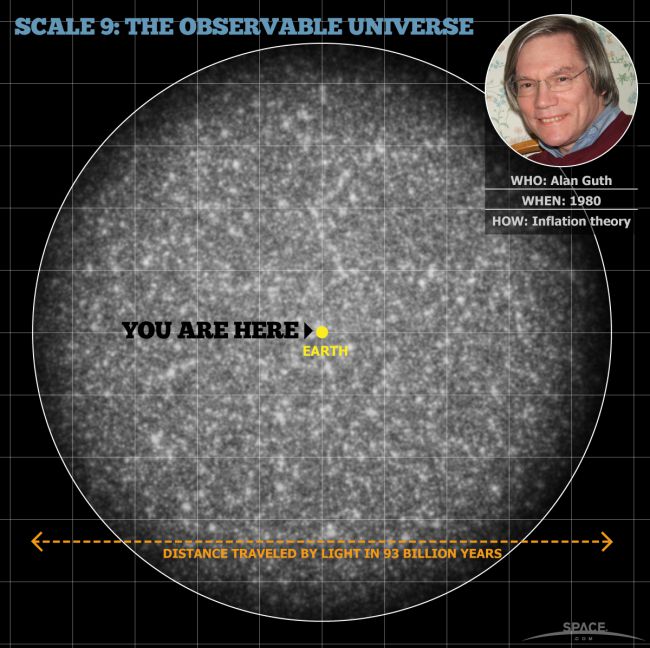
Based on simplistic and completely
ad hoc assumptions, the "inflation" scalar
field of the early cosmos was supposed to smooth out
any large inhomogeneities which would otherwise
emerge to an incredibly fine-tuned tolerance. Of
course, as Neil Turok and other colleagues have
shown,"inflation" does no such thing, and in fact,
is completely useless to solve the 'horizon' and
'flatness' problems it was invented ad hoc
to resolve.
How long do such cosmic structures take to form?
Discounting cosmic expansion, the age can be
calculated roughly by such structures
using A =R/v, where A is
the age in years, R is the radius of the
structure in light-years, and v is the maximum
velocity within the structure as a fraction of c,
the velocity of light in a vacuum. For a
more complex formula, see Ceccarelli et al.
(2006), MNRAS 373,
1440. https://doi.org/10.1111/j.1365-2966.2006.11129.x.
Given the constraints of the HBBC, astronomer
Joe Silk (October, 1988) stated, "If one
measured a gradient or large void that extended
over a thousand megaparsecs [~3.26 Gly], then I
think he or she would have to seriously question
the big bang theory" from
"Oral history interview with Joseph Silk," https://www.aip.org/history-programs/niels-bohr-library/oral-histories/38283.
According to the Hunt & Sarkar (2010)
extrapolation, Silk's estimated upper limit
may be >3 times too large.
|
According
to the Planck 2018 interpretation of the CMB data,
with dark matter, dark energy, and inflation,
i.e., the ΛCDM concordance, the Universe is ~13.813±
0.038 Ga old, while Hubble
relation estimates of Cepheid variables suggest an
age of about ~12.8±
0.2 Ga old (discussed in link).
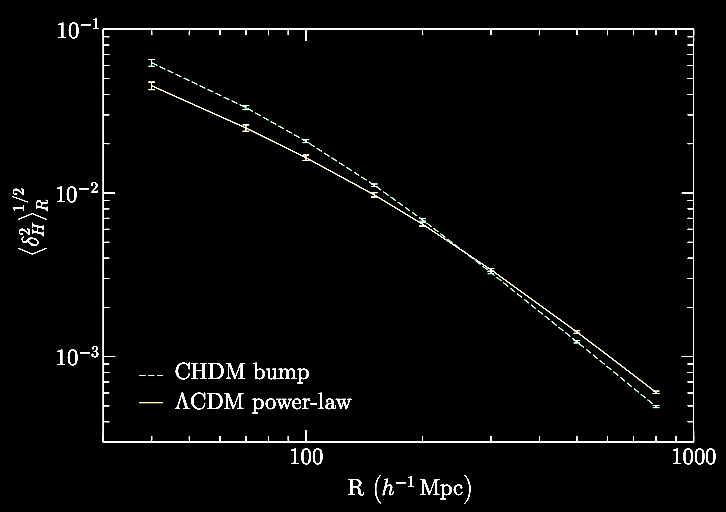
Hunt
& Sarkar (2010), MNRAS 401,
547 (doi:10.1111/j.1365-2966.2009.15670.x)
using the 5 yr WMAP CMB data and the available
SNIa data (and of course N-body
simulations for structure formation), and a lot
of parameter-fitting had them comparing the
concordance ΛCDM model with their mixed CHDM
(cold hot dark matter, with some hot neutrinos
of masses ~0.05 eV), the concordance model has
an upper limit of between ~250 and ~300 Mpc or
(~820 ly and nearly ~1 Gly) at most for possible
structure size formation in the form of voids,
observing with the two graphs cross each other
below, in light of the CMB spectrum (Fig. 2). (Conversion:
1 parsec = 3.2615637771675 light-years; Unitchefs).
mnr_156
|
Further
summaries of the status of understanding scale and
structure of the Universe may be found at the Atlas of the
Universe website, to which we may return again: http://www.atlasoftheuniverse.com/.
In January of 2022, the new Dark Energy Spectroscopic
Instrument (DESI) completed it's first 7 months of it's 5
year mission, and has already broken all 3D galaxy survey
records, completing about 10% of the area it is going to
map. DESI has about 5000 robotically-positioned optic
fibers on 8 inch focal plane of the 4 meter Mayal
Telescope (Kitt Peak). The most recent survey covers:
(https://www.astro.princeton.edu/universe/;
DESI's 3D map of the Universe so far, link).
The question of the Cosmological Principle
& its predictions. Going back to an early formal
statement of the notion with Isaac Newton's Philosophiæ
Naturalis Principia Mathematica (1687) the principle
relates to the heliocentric cosmos of the Solar System and
beyond to the 'fixed stars' within an empty space stretching
uniformly away in all directions in indefinitely large
volumes, yielding a law of 'universal gravitation' (link).
In modern cosmology, the cosmological principle is rooted in
the Friedmann-Lemaître-Robertson-Walker (FLRW) metric
(pseudo-Riemannian manifold, as in 4d space-time)
foundational to the HBBC, including in it's ΛCDM concordance model,
where the entire cosmos is enmeshed in such a uniformly
expanding 4d space-time manifold. In this case, in which one
finds good 'null hypothesis' test predictions (one of the
best features of the HBBC, setting aside all of the ΛCDM epicycles),
there must be a cosmological principle thus:
- Cosmological
Principle: At sufficiently large (i.e.,
representative) scales, the Universe must contain a spatial
distribution of mass-energy which is (a) homogeneous
(uniform at every point without any irregularities larger
than scale) and (b) isotropic (uniform in all
directional orientations without irregularities larger
than scale) because the same laws of physics operate at
every point. In the CSSC or classic steady-state
cosmology, specifically the Bondi-Gold version (1948), the
Cosmological Principle becomes the Perfect
Cosmological Principle, which also makes the same
predictions except that "the Universe must contain a spatial-temporal
distribution of mass-energy which is.... (a) ... and
(b)..." because the same physical laws operate at every
point and at every time; and so on. This likewise forms a
good 'null hypothesis test' prediction. In sum,
at representatively large scales, the Universe is homogeneous
and isotropic for all observers throughout space
(in the HBBC), and back across time (in the CSSC).
Between
the null hypotheses of the FLRW HBBC Cosmological Principle
(setting aside for the moment all of the epicycles) and the
Bondi-Gold CSSC Perfect Cosmological Principle, we have four
distinct, broad categories of predicted options, which can now
be tested by observations as they relate to large scale
structures observed in the Universe, and used to suggest more
sophisticated cosmologies for the 21st century and beyond. The
broad categories of prediction:
- A homogeneous
and isotropic Universe.
- An inhomogeneous
and isotropic Universe.
- An homogeneous
and anistropic Universe.
- An inhomogeneous and
anistropic Universe.
Here
are a few illustrations to summarize (link).
By defining homogeneity and isotropy by simple illustrations,
we can examine suspected departures from either and from both
in the large-scale Universe, which could serve as empirical
tests and limits on cosmology models.
With that, we turn to summarizing
observations which suggest departures at observable,
representative scales from the Cosmological Principle in a
HBBC model, from both homogeneity and from isotropy.
I. The question of Homogeneity:
Discovery of large-scale structures & departures from
concordance homogeneity. At the beginning of the 20th
century, the confirmed structure of the Universe was our Milky
Way galaxy and little was known beyond. Over the decades of
the second half of the 20th century, modern astronomy has
found that galaxy clusters are arranged in a series of
described superclusters separated by large intergalactic
voids. A pattern that first began to be detected in large
photographic surveys of the skies. We step back in time to
review these findings and then move forward in time to the
latest discoveries. (We examine several of large-scale
structures and great voids in cosmic structure found in recent
decades: link).
The
large-scaled structure distribution of galaxies imaged with
the old, now defunct, Automatic
Plate Measuring (APM) technique.
Galaxy Survey computer image of about 2 million galaxies and
10 million stars over about 100 degrees of the southern
skies. Within this early image, one can see the filamentous
enrichment of galaxy presentation.
(http://www-astro.physics.ox.ac.uk/~wjs/apm_survey.html)
cf. Lick survey of 800,000 galaxies in the whole northern sky N
of declination -23o, down to a photographic magnitude
of 18.8 (Peebles et al. 1977; Seldner et al.
1977; cit. in Hoyle et al. 2000).
Angular distribution of clusters
of galaxies from the Milky Way galactic plane:
Background distribution of superclusters with
their distances in Mpc (megaparsecs, where
1 megaparsec = 3,261,563.78 light-years) from the Milky Way perspective (cit. in Joseph, 2010b. Journal of Cosmology, Vol
6, 1548-1615).
Typically the large scale structure of galaxy distribution
involves, with increasing scale, galaxy clustering, galaxy
superclustering, involving line-like structures, walls,
interspersed by voids increasing with scale likewise (Hoyle
et al. 2000).
(astro.uchicago.edu/~coble/talks/pop_cosmo/grand.xy.pdf).
Another survey, the Baryon Oscillation
Spectroscopic Survey (BOSS: https://www.sdss3.org/press/onepercent.php)
is being used to refine the cosmological constant (lambda) but
this popular article with the
above odd-graphic representation (designed to represent the
baryonic acoustic 'bounce' oscillation) but fails to cite the
controversies in the field (https://www.huffingtonpost.com/2014/01/09/scale-of-universe-galaxy-map_n_4567445.html).
Beyond the
distribution of clusters of galaxies, we have the larger
distribution of local superclusters of galaxies in often
filamentous aggregates which are indicated or defined between
the larger cosmic voids / bubbles separating them:
How
were these superclusters and large wall-&-void structures
discovered? And leading to ultimately, how were they formed?
(1) Gigantic-scale structures.
The Center for Astrophysics (CfA)
surveys of extragalactic redshifts were begun in 1977 by
Marc Davis, John Huchra, Dave Latham, and John Tonry (Harvard U / Smithsonian Astrophysical
Observatory, SAO) "The first CfA Survey, completed in 1982,
(Huchra, Davis, Latham and Tonry, 1983, ApJS 52, 89) had
as its goal the measurement of radial velocities for
all galaxies brighter than 14.5 and at high galactic
latitude in the merged catalogs of Zwicky and Nilson
(the UGC)" (http://www.cfa.harvard.edu/~huchra/zcat/).
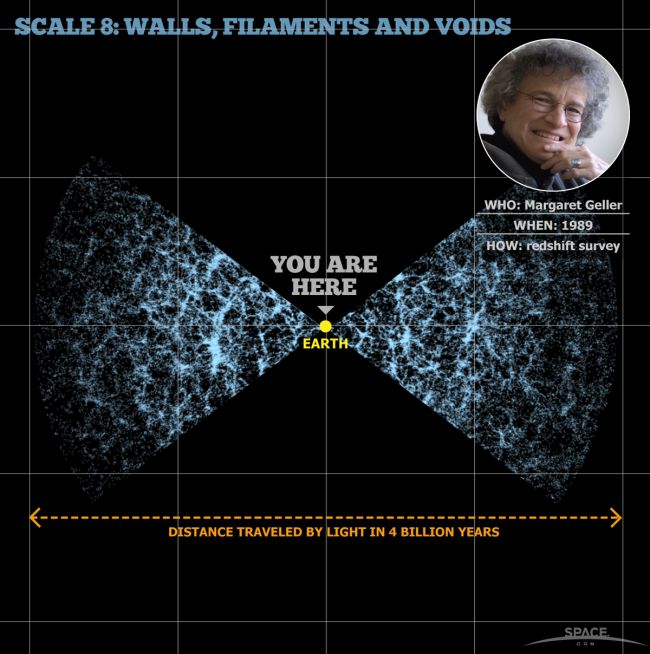
The first slice of sky spectroscopically surveyed included ca. 1100 galaxies in a region of sky 6 degrees wide
and ~130 degrees long, with Earth at the apex of the wedge,
done by Valerie de Lapparent, Margaret Geller, and John
Huchra (see table above for the reference).
As Huchra described it, "This
initial map was quite surprising, showing that the
distribution of galaxies in space was anything but random
[or homogeneous], with galaxies actually appearing to be
distributed on surfaces, almost bubble like, surrounding
large empty regions, or 'voids.'"
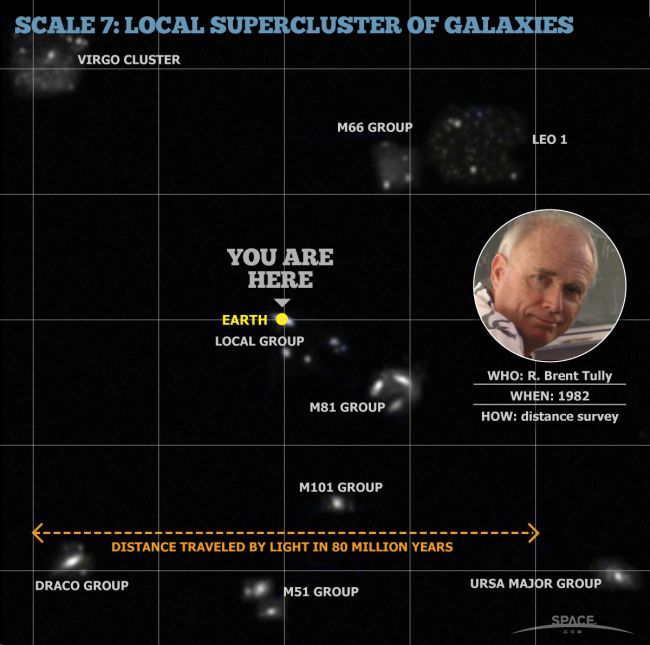
Already in
1986, Brent Tully (University of Hawaii) reported
superclusters of 300 X 100 mllion light-years in size, which
at current galactic velocities would have taken 80 Ga to
assemble (Tully, 1986; Lal, 2010). By superimposing six
contiguous slices of 6 degrees of sky each, the CfA Redshift
Survey team uncovered "the Great Wall" of galaxies 600 X 250
X 30 million light years in size (Geller and Huchra 1989, Science 246,
897), which would require at least 100 Ga to form according
to some estimates (Lal, 2010). The Geller-Huchra "Great
Wall" of galaxies discovered in a survey out to z ~
0.03 is ~200 Mpc,
i.e., ~650 Mly. From the very earliest of these angular /
redshift survey mappings (even in the first CfA slice above,
a strange phenomena began to be observed, galaxies clustered
by redshift exhibited a tendency to form oriented stringers
or 'fingers' trailing back toward the observer in a peculiar
effect whimsically called the "fingers of god"
pointing back at Earth, which has been explained as the
result of peculiar velocities within the cluster, not
explaining of course, why they should be oriented toward
Earth observers. We will return to this phenomenon later.
The 'fingers of god' phenomenon had also
been observed in 1986, including in Abell clusters of
galaxies, which are clusters of >30 galaxies which are
often very compact frequently with aging stellar
populations, and fairly low redshift values, named after a
northern hemisphere survey done in American astronomer
George Abell in 1958, and since extended to the southern
hemisphere. The 'fingers of god' effect turns out to be less
dramatic in the aging Abell clusters than in clusters
containing younger galaxies with active galactic nuclei
(AGNs), which has definite implications for galactic
cosmogony:
%20Fig1.18.jpeg)
Figure adapted from Narlikar (1993).
Introduction to Cosmology (2nd edition). Cambridge,
UK: Cambridge University Press; p. 20.
The CfA2 survey also
revealed the inhomogeneous clustering and the 'fingers of
god' phenomenon.
Above we see "6 degree
slices in the northern galactic cap. The structure running all
the way across between 8 hours and 17 hours RA and 5,000 and
10,000 km/s is called the "Great Wall,'' the largest single
structure detected in any redshift survey to that time. Its
dimensions are about 600 x 250 x 30 million light years, sort
of like a giant quilt of galaxies across the sky (see Geller
and Huchra 1989, Science
246, 897). Again the strange 'fingers of god' behavior (http://cfa-www.harvard.edu/~huchra/zcat/).
Here's another 360 degree view of the 1989 Geller &
Huchra survey data, likewise complete with the 'fingers of
god' effect.
%20Fig1.19.jpeg)
Figure adapted from Narlikar (1993). Introduction
to Cosmology (2nd edition). Cambridge, UK: Cambridge
University Press; p. 21.
The CfA2 survey of
vaster reaches of the Universe, also exhibited the
inhomogenous clustering and the 'fingers of god' phenomenon.
The redshift distribution of the CfA2 (Center for Astrophysics
2) survey can also be seen in this polar projection of the
redshifts for all the galaxies in the CfA2 survey out to
12,000 km/s. This is a section of a cylinder in equatorial
coordinates looking down from the north pole to the equator
with a height of 12,000 km/s and a radius of 12,000 km/s. Tha
major structures seen are again the Local Superluster just
above the middle of the plot, the Great Wall cutting from 9
hours and 5,500 km/s to 15 hours and 9,000 km/s and the
Pisces-Perseus supercluster centered around 1 hour and 4,000
km/s. The geometry of this projection is similar to that of a
hockey puck (http://cfa-www.harvard.edu/~huchra/zcat/).
Here is the 2001 CfA2 survey with redshift results
color-coded by estimated Doppler velocities of recession:
2001 CfA2 image (link)
with redshift
color-key for galaxies with spectra assayed in the survey,
betwixt zones of avoidance showing the positioning of the
Milky Way galactic plane in the projection map.
Although
these gigantic structures seemed to create difficulties at
the time for the HBB Cosmology, especially given the very
smooth CMB radiation as understood then, there were much
larger violations of homogeneity, which have strained and
then violated the predictions of the HBBC even further. In
the CfA2 survey mapping, the "fingers of god" phenomenon
continued to be present, especially at the lower redshift
values.
In 2003 and 2004, Tegmark et al. released, The 3D
power spectrum of galaxies from the SDSS. https://arxiv.org/abs/astro-ph/0310725,
and then published in 2004, The three-dimensional power
spectrum of galaxies from the Sloan Digital Sky Survey. ApJ
606 (2), 702. https://doi.org/10.1086/382125,
a summary paper which sought to measure the large-scale
real-space power spectrum P(k) of galaxy
distribution within the SDSS in a set of 205,433 galaxies
with an average redshift of z ≈ 0.1
arXiv:astro-ph/0310725v2 29 Oct 2003
over 2417 degrees square of the sky. The power spectrum was
not found to have a single power law (i.e., requires some
parameter-fitting). The postulate is that there is a P(k)
∝ kn-1,
a Fourier transform where k is the
wave number of the perturbation (link),
which they wished to measure so as to compare with then
recent WMAP measurements of the CMB (Bennett et al.
2003. First year Wilkinson Microwave Anisotropy Probe (WMAP)
observations: Preliminary maps and basic results. arXiv
(v3): https://arxiv.org/abs/astro-ph/0302207.
ApJ Suppl Series 148 (1), 1-27. https://doi.org/10.1086/377253)
for useful measurements of cosmological model parameters.
They wished to find corrections to distortions in redshift
space yielding well-behaved functions in the range of 0.02 h/Mpc
< k < 0.3 h/Mpc up to "some unknown
multiplicative bias factor" which they argue they calculated
to be scale-independent or scale-invariant "better than a
few percent for k < 0.1 h/Mpc." The
authors claim that their measurements are "well fit by a
flat scale-invariant adiabatic cosmological model with hΩm
= 0.213 ± 0.023 and σ8 = 0.89 ± 0.02 for
L∗ galaxies, when fixing the baryon fraction Ωb/Ωm = 0.17 and
the Hubble parameter h = 0.72" which they went on to
interpret in what they called the companion paper. In this
paper, the authors sought to account for (1) "complicated
survey geometry," and correct for (2) redshift-space
distortions, (3) artificial red-tilt based on luminosity
bias, and (4) potential systematic errors. These corrections
include dealing with the 'fingers of god' effect, which will
be discussed more below.
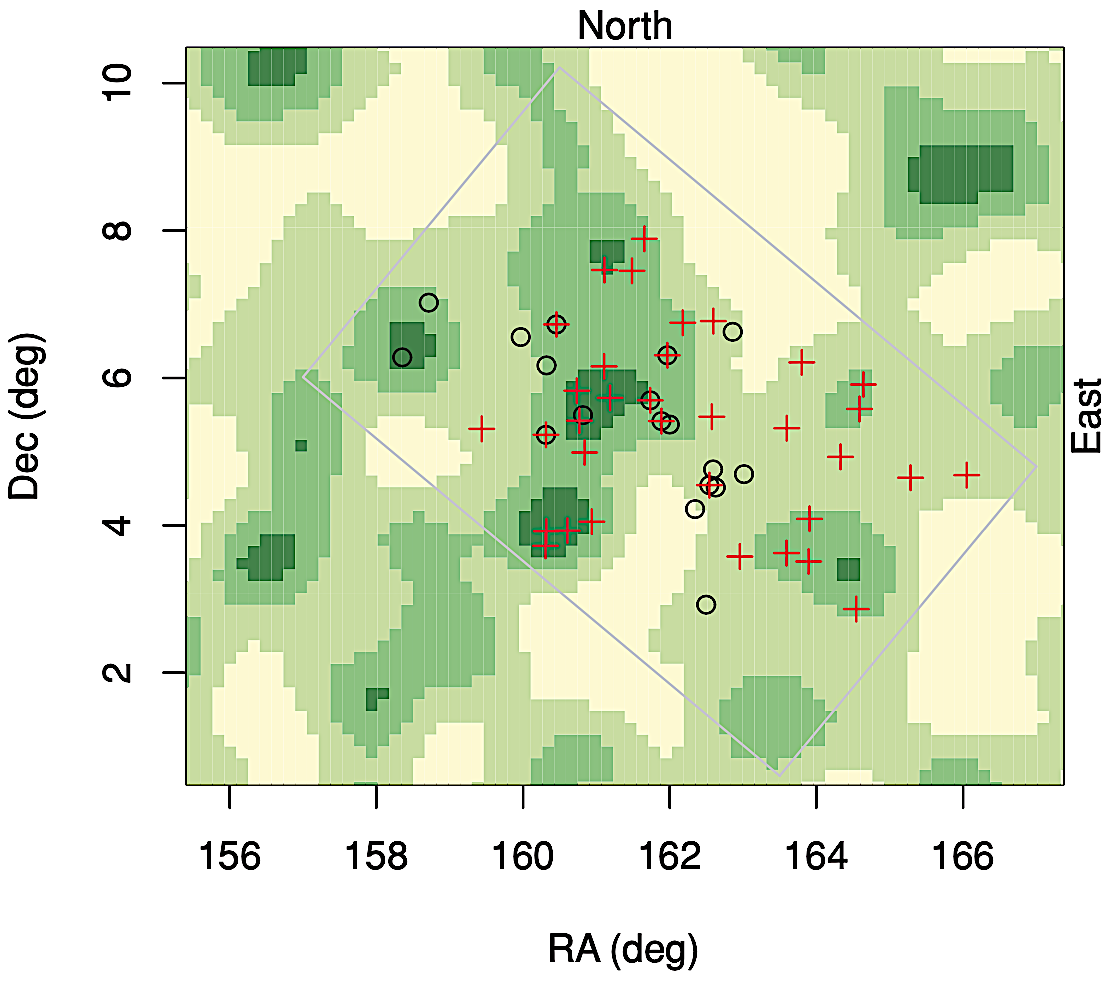
Quasar
(QSO) clusters. In 1991, astronomers Roger Clowes and
Luis Campusano discovered a large cluster of about 18 quasars
(Clowes & Campusano, 1991. A 100-200 Mpc (3.26 - 6.52 Mly)
group of quasars. MNRAS 249, 218. https://doi.org/10.1093/mnras/249.2.218;
cf. a similar cluster found back when by Crampton et al.
ApJ 345, 59). This initial cluster
though large was thought to still be within the HBBC limit.
This cluster later, when reexamined with data from the SDSS,
turned out to be part of a double cluster containing the
original 18 quasars in a group (U1.11, where average z
= 1.11) and another group of 34 quasars (U1.28, where average
z = 1.28) which together include the original
Clowes-Campusano LQG (large quasar group) or the CCLQG and now
are recognized to be about ~2 Gly in length and ~1 Gly in
width, located at an estimated distance when the light left
them of ~9.5 Gly. This result was published in 2012 (Clowes et
al. 2012. Two close large quasar groups of size ~350
Mpc at z ~ 1.2 (i.e., ~1.14 Gly). MNRAS
419, 556. https://doi.org/10.1111/j.1365-2966.2011.19719.x
). Earlier Yadav et
al. (2010. Fractal dimension is used as a measure of
the scale of homogeneity. MNRAS 405, 2009. https://doi.org/10.1111/j.1365-2966.2010.16612.x),
utilizing N-body simulations, fractal dimension
estimations, and some other parameter-fitting (the details
of which can be found in the paper), estimated that the
upper limit for the possible scale of homogeneity within the
ΛCDM model is 260 h-1 Mpc. Clowes et al.
(2012) citing Yadav et al. (2010) admit that the two
quasar groups are at the very outer limit of homogeneity at
350-400 Mpc (~1.14 - ~1.3 Gly), actually beyond that outer
limit, we might add. It is worth noting how model-laden and
parameter-fitted the Clowes et al. (2012)
calculations are: Their concordance model is set to ΩT
= 1, ΩM = 0.27, ΩΛ = 0.73, and H0
= 70 km s−1
Mpc−1
. These two LQGs both actually just beyond the concordance
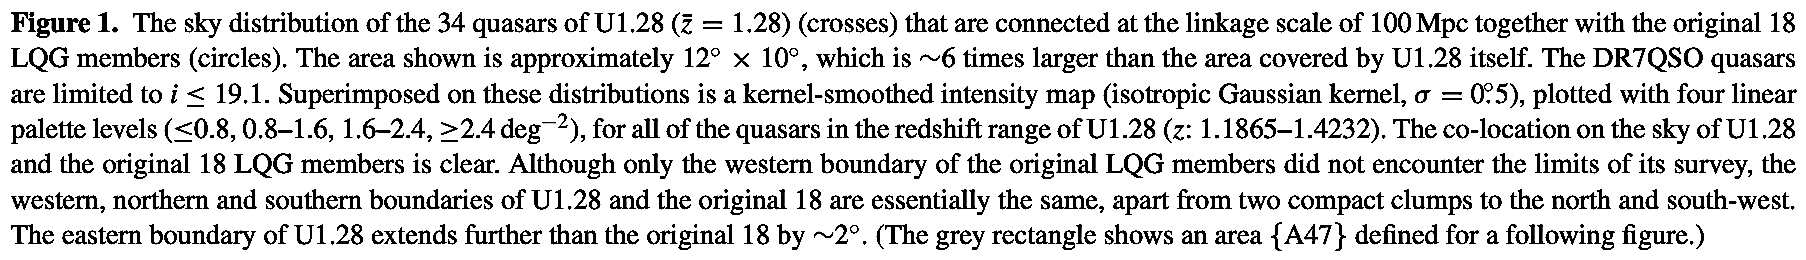
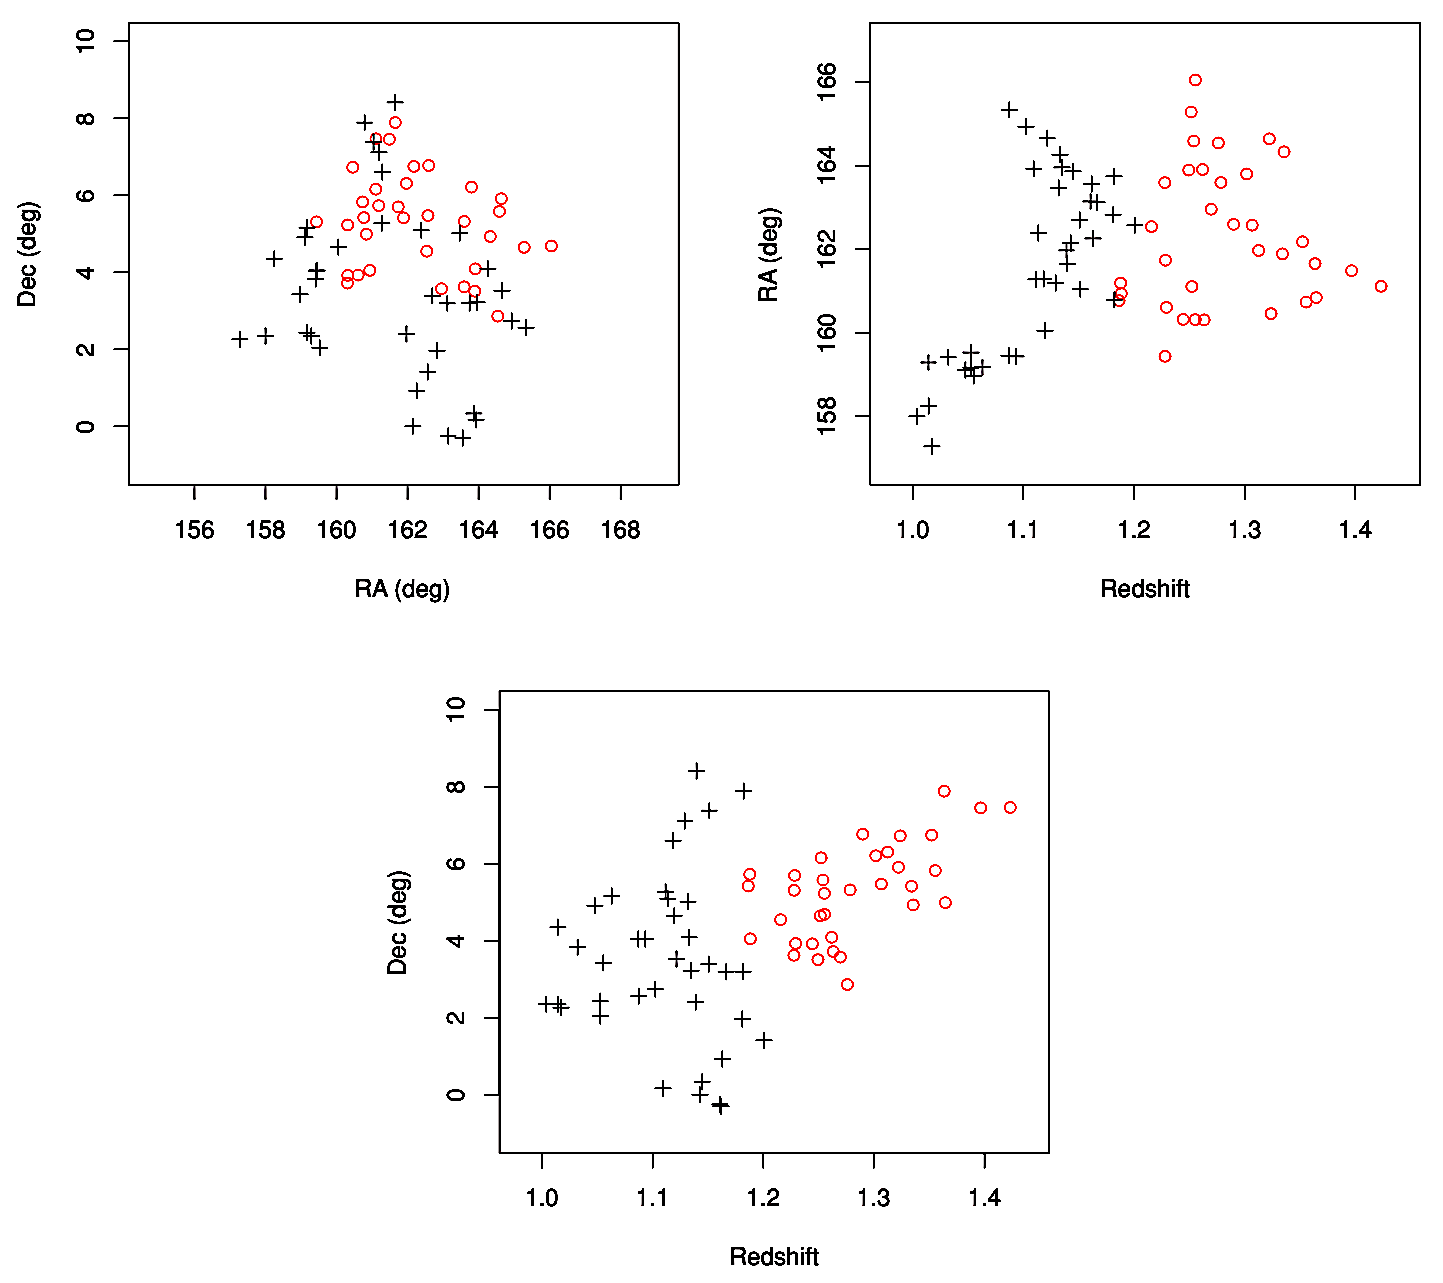
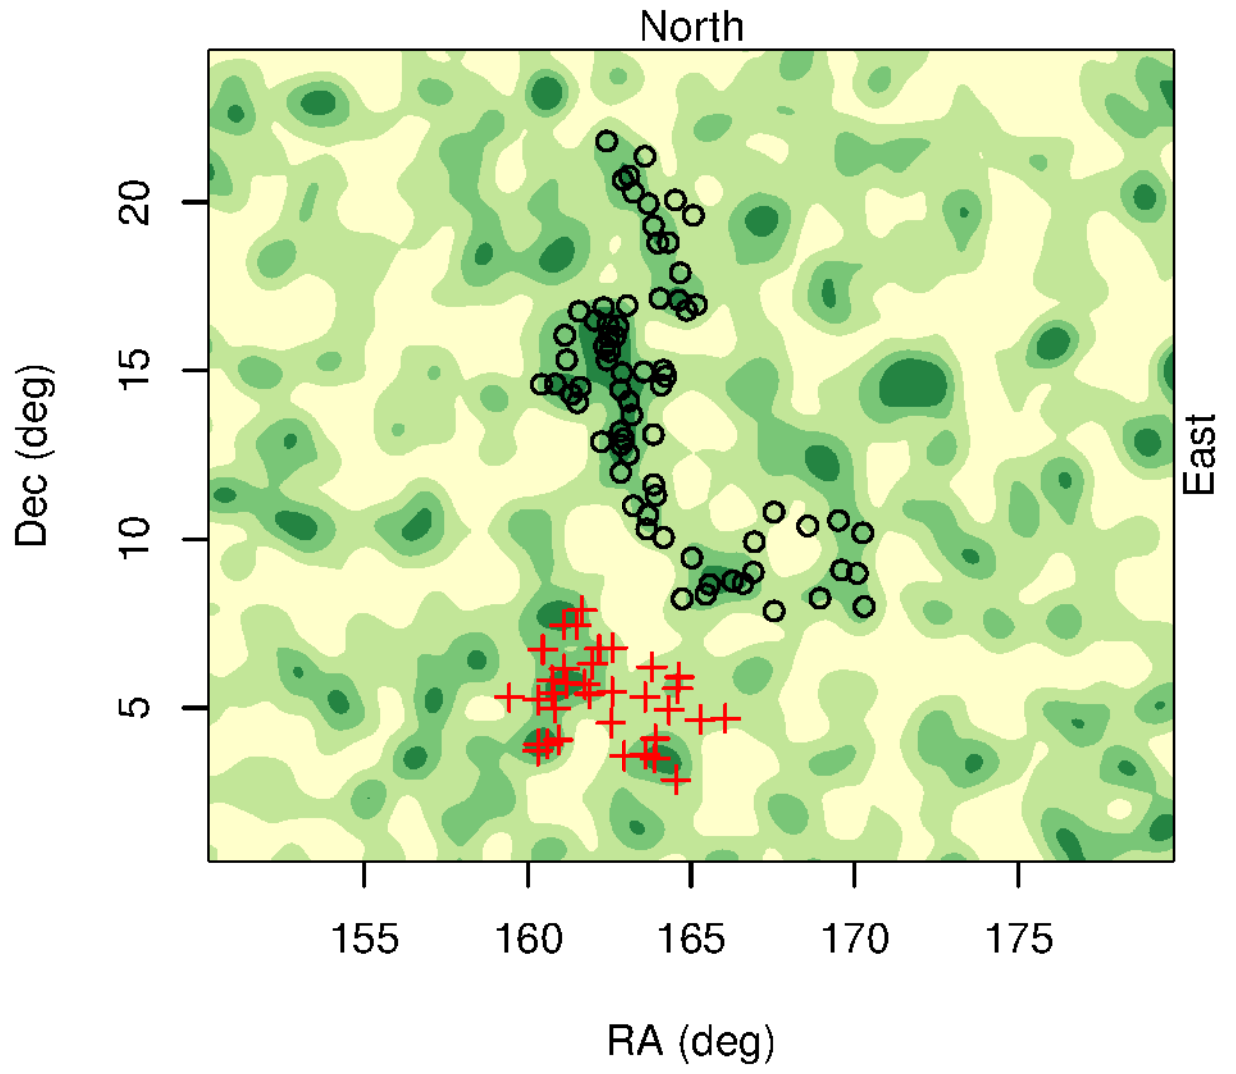
homogeneity limit. Below are images from their 2012 paper
with the angular sky distribution of both clusters (U1.11
and U1.28) in Figure 1, as well as the spatial projection of
U1.11 and U1.28 by right ascension (RA) and declination
(Dec):

And
the following year, the Clowes team admitting that emerging
data nested their double LQGs (CCLQG) in an even larger
structure, which is beyond the concordance homogeneity limit
in size. These new results were published in Clowes et
al. (2013. A structure in the early Universe at z ~
1.3 that exceeds the homogeneity scale of the R-W
concordance cosmology. Just juxtaposed near the double CCLQG, there was
another even more stupendous large structure of quasars called
the Huge Large Quasar Group (Huge-LQG) was identified by
Clowes et al. (2013; MNRAS 429 (4),
2910. https://doi.org/10.1093/mnras/sts497;
https://arxiv.org/abs/1211.6256)
in the SDSS DR7QSO group, the largest known of the LQGs (large
quasar groups), with enormous dimensions of 1.24 Gpc (~4.04
Gly) long by 640 Mpc (~2.1 Gly) and 370 Mpc (~1.2 Gly). Even
though the data is interpreted in the context of ΛCDM
concordance parameter-fitting, it is evident that something
very vast is discovered here, departing from the concordance
homogeneity limits of the time. The CCLQG (U1.28) and
Huge-LQG are separated by 615 Mpc (2.01 Gly).
Building
the Walls. A repeating pattern of 13 'great walls' in
all (each about 100 Mpc or 326 Mly in size) have been
discovered across 7 Gly of space-time, spaced about 6 Mly
apart, covering about a quarter of the Hubble diameter of
the Universe, and requiring at observed galactic velocities
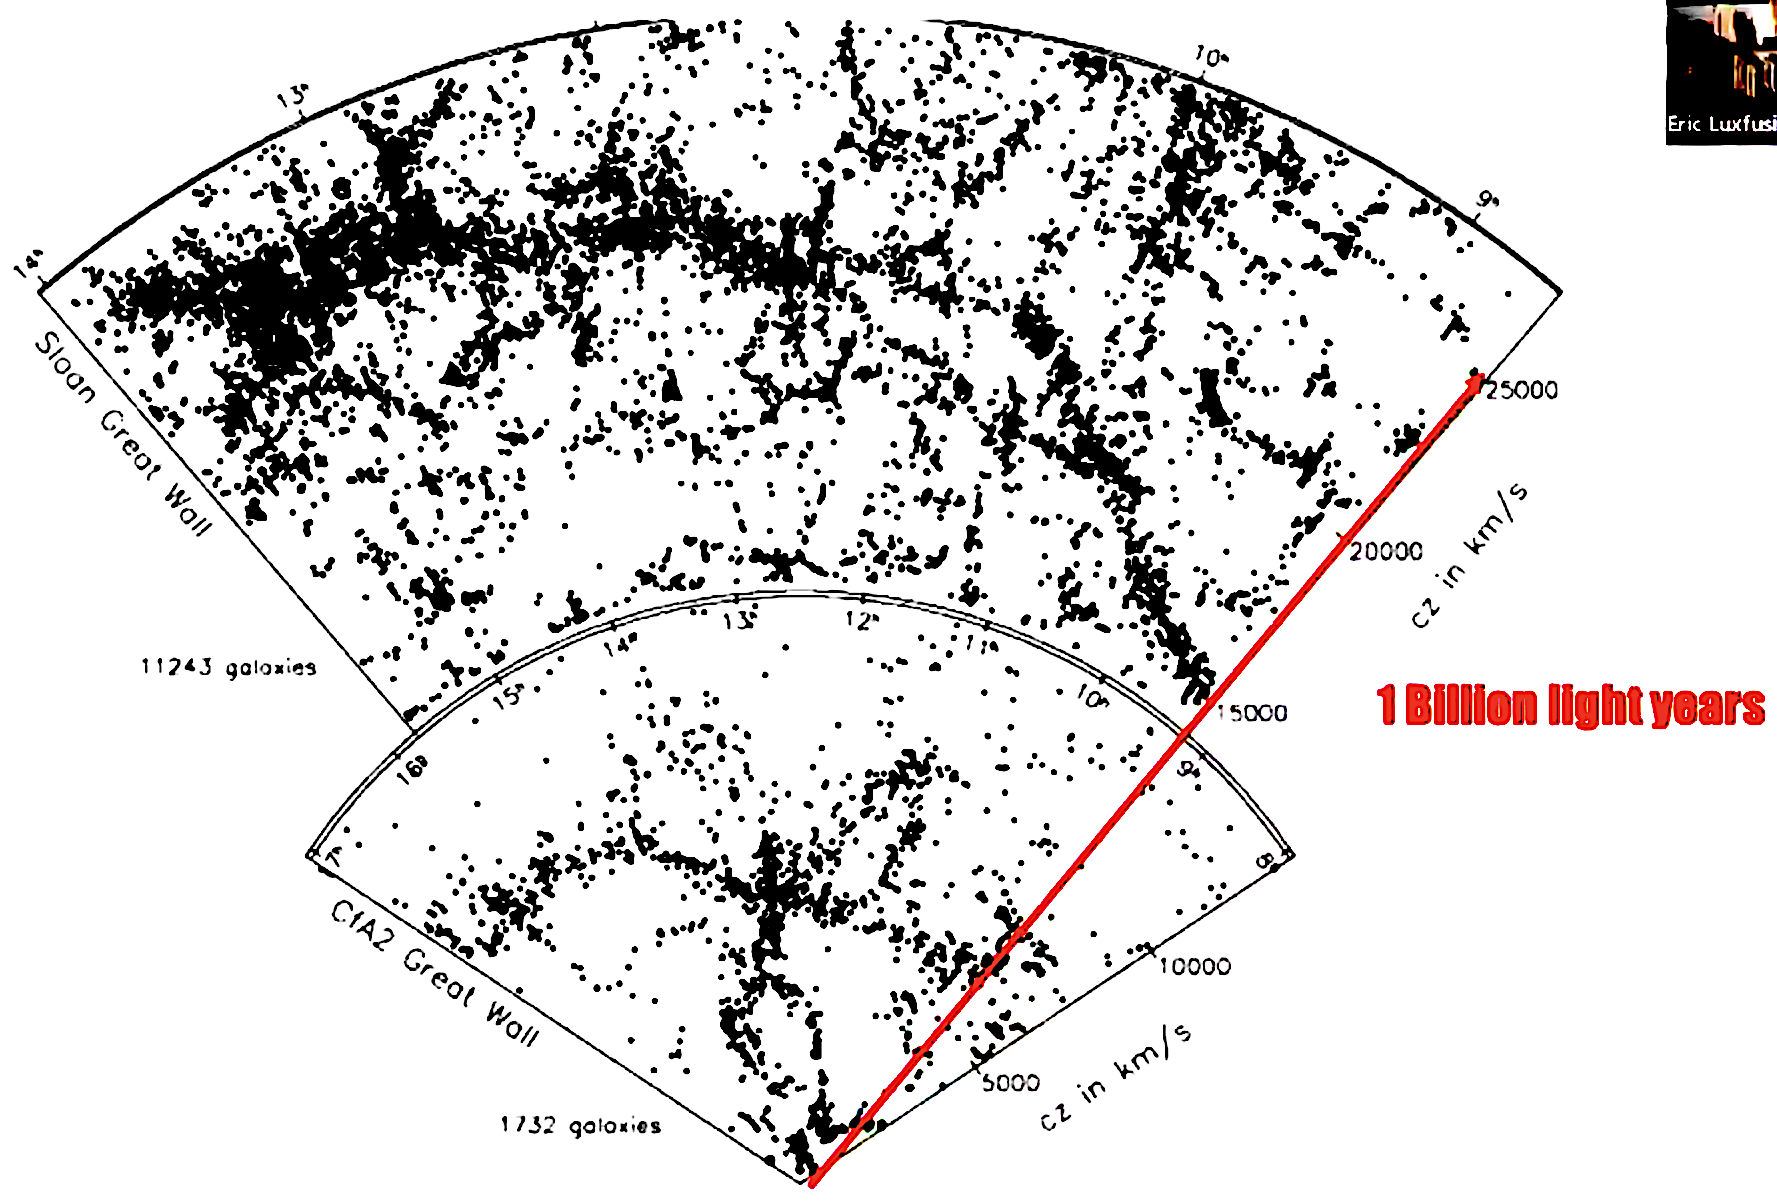
nearly 150 Gy to form (Kumar Lal, 2010). The Sloan Digital Sky Survey (SDSS) discovered an
even larger superstructure, the largest structure known to
that date: The "Sloan Great Wall" which is 1.38 Gly long,
80% longer than the first 'great wall' and which would have
required 250 Gy to form (according to Kumar Lal, 2010).
The Sloan Great Wall of galaxies (~1 Gly away) already published in
the Gott et al. (2005) study was about ~1.38 billion
light-years (Gly) across (cf. logarithmic map view of the
Universe, https://www.astro.princeton.edu/universe/),
definitely larger than the concordance homogeneity limit.
The "Sloan Great Wall" is over 1 billion
light-years (~1.38 Gly) in size (cf. Joseph, 2010b; now
defunct http://journalofcosmology.com/Cosmology4.html),
along with other superstructures such as Shapley, Pisces-Cetus,
and Horologium-Reticulum.
In
axonometric representation (3d structure represented on a 2d
plane orthogonal to the line of sight), the "Great Sloan
Wall" megacluster of galaxies looks like this:
The Great Sloan Wall in
projected 3d (Gott et al. 2005).
Another vast structure (discovered in 2020)
is the "South Pole Wall" (approaching ~400 Mpc or ~1.31 Gly), a structure
comparable in size to the "Great Sloan Wall" but half the
distance away (Pomarede
et al. 2020. Cosmicflows-3: The
South Poll Wall. ApJ 897, 133. https://iopscience.iop.org/article/10.3847/1538-4357/ab9952;
https://doi.org/10.3847/1538-4357/ab9952).
Although the Cosmicflows-3 velocity
and structure density reconstructions are derived from
model-based ΛCDM concordance adjustable parameters of
Ωm = 0.3,
ΩΛ = 0.7, and a H0 =
75 km s−1
Mpc−1
, even then, these density
reconstructions imply some very huge structures indeed at
variance with concordance expectations, implying even vaster
and more connected structures than the authors seem willing
to explicitly state, and possibly not showing the entire
structure, some excluded by Milky Way galactic zones of
obscuration, but implied by a potential continuity of the
data delimited.
Figures 1 and 5 reconstruct the structure of the South Pole
Wall with its scale, implying that it is part chosen from a
larger structure. Figure 5 illustrates that it is indeed
considered as a subset chosen somewhat arbitrarily from a
greater whole (cf. Fig. 1). The reconstruction model
restricts the peculiar velocity contours within certain
ranges (see accompanying figure legends) which suggests that
the superstructure was constrained by exclusion of some
peculiar velocity field components. This would be even more
significant an edit if one considers that these structures
may be gravitationally open in the Ambartsumian sense.
Figure 3
reconstruction to scale compares the South Pole Wall (SPW)
with the previously discovered CfA2 Great Wall and the
Sloan Great Wall. Such huge structures occur in both the
northern skies and the southern skies. The SPW is
significant because it is a much more local
superstructure.
The
Figure 4 peculiar velocity restricted reconstruction
within the galactic frame of reference implies that
there is more to the overall superstructure (resembling
the quasi-spherical shells of density) of which the
South Pole Wall is but a part.
The Figure 6
reconstruction combines two models of peculiar velocities
implied from distance. The black wire grid reconstructs
the location of the South Pole Wall within a larger
structure. If this is all one super structure, then it
might well be roughly ~500-550 Mpc (~1.6 - ~1.8 Gly) in
extent, massively outside the concordance homogeneity
limit.
The
reconstruction in Figure 2 suggests that the same
structure reaches from the south galactic hemisphere
into the northern galactic hemisphere too, across the
zone of Milky Way galactic obscuration.
The
Figure 8 reconstruction combines the large scale
structure with the estimated velocity flow lines within
that overall structure:
Of this
unusually vast structure, the authors admit, "We will
not be certain of its full extent, nor whether it is
unusual, until we map the universe on a significantly
grander scale." This indicates that we don't know how
large the great South Pole Wall of galaxies actually is,
or how common such are. Despite this, Princeton
astrophysicist Neta Bahcall (wife of the late John
Bahcall), and unconnected with the Pomarede et
al. research published, is strangely cited as
confidently asserting in the popular Live Science article
that "Knowing how the universe looks on such large
scales helps confirm our current cosmological models"
while it actually rather raises more questions about
those current models. She is quoted as going on to pile
on to that assertion this almost unintelligible (if in
context) quote, "When you look at the network of
filaments and voids, it becomes a semantic question of
what's connected" (Link).
These data hardly raise semantic issues as much as they
raise substantive questions about the prevailing
cosmology.
Another
immensely huge structure (~3.3 Gly across) and ~9.2 Gly
distant is called the "Giant Arc" of galaxies stretching
across about 1/15th of the observable part of the
Universe, with an 0.0003% probability of being
artifactual. Using Mg-absorption patterns of light from
distant quasars, Alexia Lopez et al. discerned
this arc structure (07 June 2021 presentation at the
238th meeting of the American Astronomical Society, AAS,
which has since been turned into a paper): Lopez, A. M.,
Clowes, R. G., & Williger, G. M. 2022. A giant arc
in the sky. https://arxiv.org/abs/2201.06875.
MNRAS 516 (2), 1557-1572. https://doi.org/10.1093/mnras/stac2204.
The Giant Arc with
grey regions indicating areas with magnesium (Mg)
absorbance showing the presence of galaxies / galaxy
clusters,
while blue patterns (blue dots on the L, and blue
contours on the R) show the presence of QSOs.
The placement of the Giant Arc in our night
sky:

(https://www.livescience.com/giant-arc-in-space.html;
https://www.vice.com/en/article/g5gjzm/a-structure-in-deep-space-is-so-giant-its-challenging-standard-physics).
Lopez' doctoral
advisor, Roger Clowes, opined in the context of the
increasing number of huge structures discovered,
"They're so large, you wonder if they're compatible
with the cosmological principle" (link),
which in the HBBC context would dictate a size limit
to such structures, but Pomarede, the French cosmographer who
discovered the South Pole Wall, pointed out,
"Instead, we keep finding these bigger and bigger
structures." In order to have a cosmological
principle (homogeneity and isotropy at sufficiently
large scales) within the HBBC ΛCDM model with a 1/H0
age of ~13.8 Gya, there is a theoretical limit by
some lights of about 1.2 Gly maximum size for such
structures. Of course, there is no need to
immediately consider abandoning the cosmological
principle, if one is allowed to consider older and
vaster models than the HBBC ΛCDM. Furthermore, if
the cosmological principle is to be abandoned,
then the HBBC ΛCDM is also on the way out. This
website highlights evidence suggestive of such.
In January of 2024, the same scientific team
with doctoral student, Alexia
Lopez (link)
and advisor Prof. Roger Clowes, presented at the
American Astronomical Society (AAS) another giant
structure at the same Hubble redshift distance in
the same overall direction separated by ~12, which
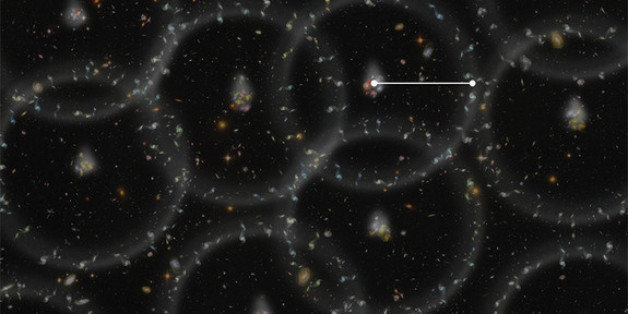
they have called the 'Big Ring' (10 January 2024).
The 'Big Ring' is also ~9.2 Gly distant, with a
diameter of ~1.3 Gly and a circumference of ~4 Gly.
Both the 'Giant Arc' and the 'Big Ring' (actually
more like a corkscrew coil) are larger than the
maximum ~1.2 Gly size of structures predicted in
standard HBBC / ΛCDM cosmology. In
February 2024, the paper was released: Lopez, A. M.,
Clowes, R. G., & Williger, G. M. 2024. A big
ring in the sky. https://arxiv.org/abs/2402.07591;
https://www.researchgate.net/publication/378157464_A_Big_Ring_on_the_Sky.
The Big Ring
which is actually more of a corkscrew, with the gray
spots representing the Mg II absorbers at z
= 0.802 0.060, considered to be in the tangent-plane
at a set distance of the Ring, while the small blue
dots represent the putative background probes or
quasars (L, Fig. 1). Fig.
2 (on the R) shows the identified Mg II absorbers
within the Ring (blue dots).
In an
article containing an interview, "A big cosmological
mystery," released by her own University of Central
Lancashire (UCLan) media (https://www.uclan.ac.uk/news/big-ring-in-the-sky;
11 January 2024), Alexia Lopez had this to say,
"Cosmologists calculate the current
theoretical size limit of structures to be
1.2 billion light-years, yet both of these
structures are much larger – the Giant Arc
is almost three times bigger and the Big
Ring’s circumference is comparable to the
Giant Arc’s length.
"From current cosmological theories we
didn't think structures on this scale were
possible. We could expect maybe one
exceedingly large structure in all our
observable universe. Yet, the Big Ring and
the Giant Arc are two huge structures and
are even cosmological neighbours, which is
extraordinarily fascinating....
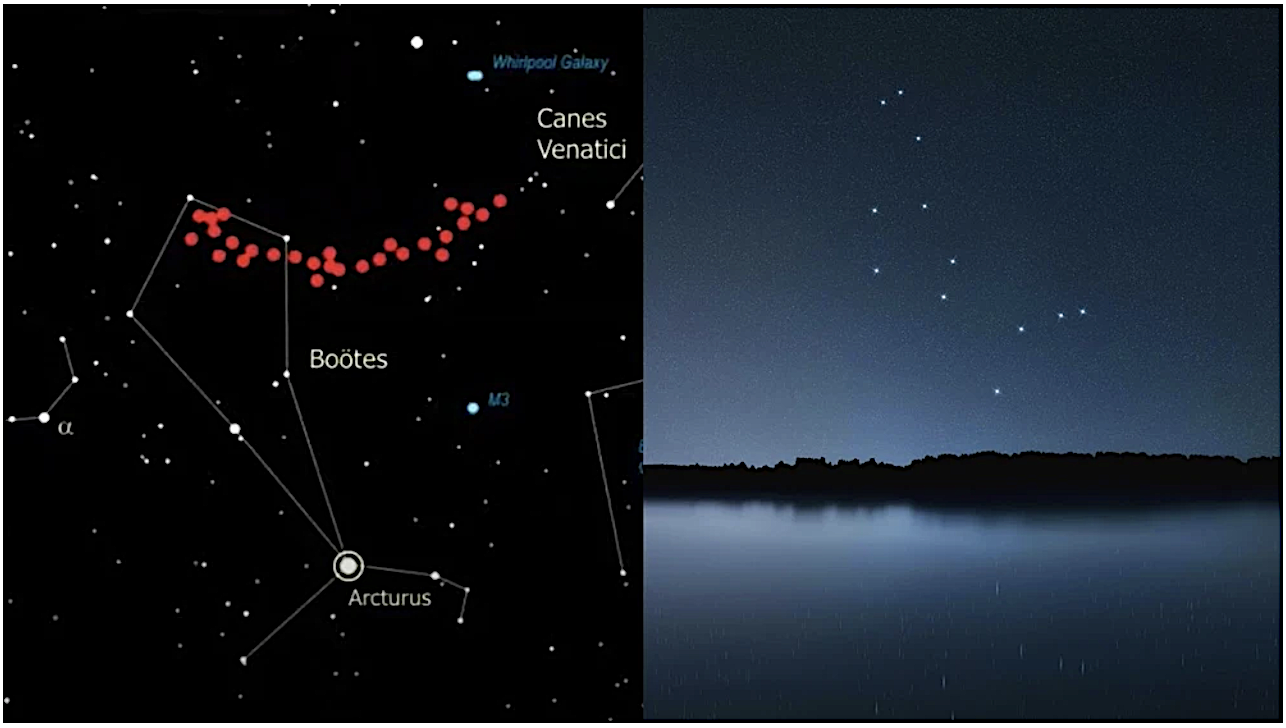
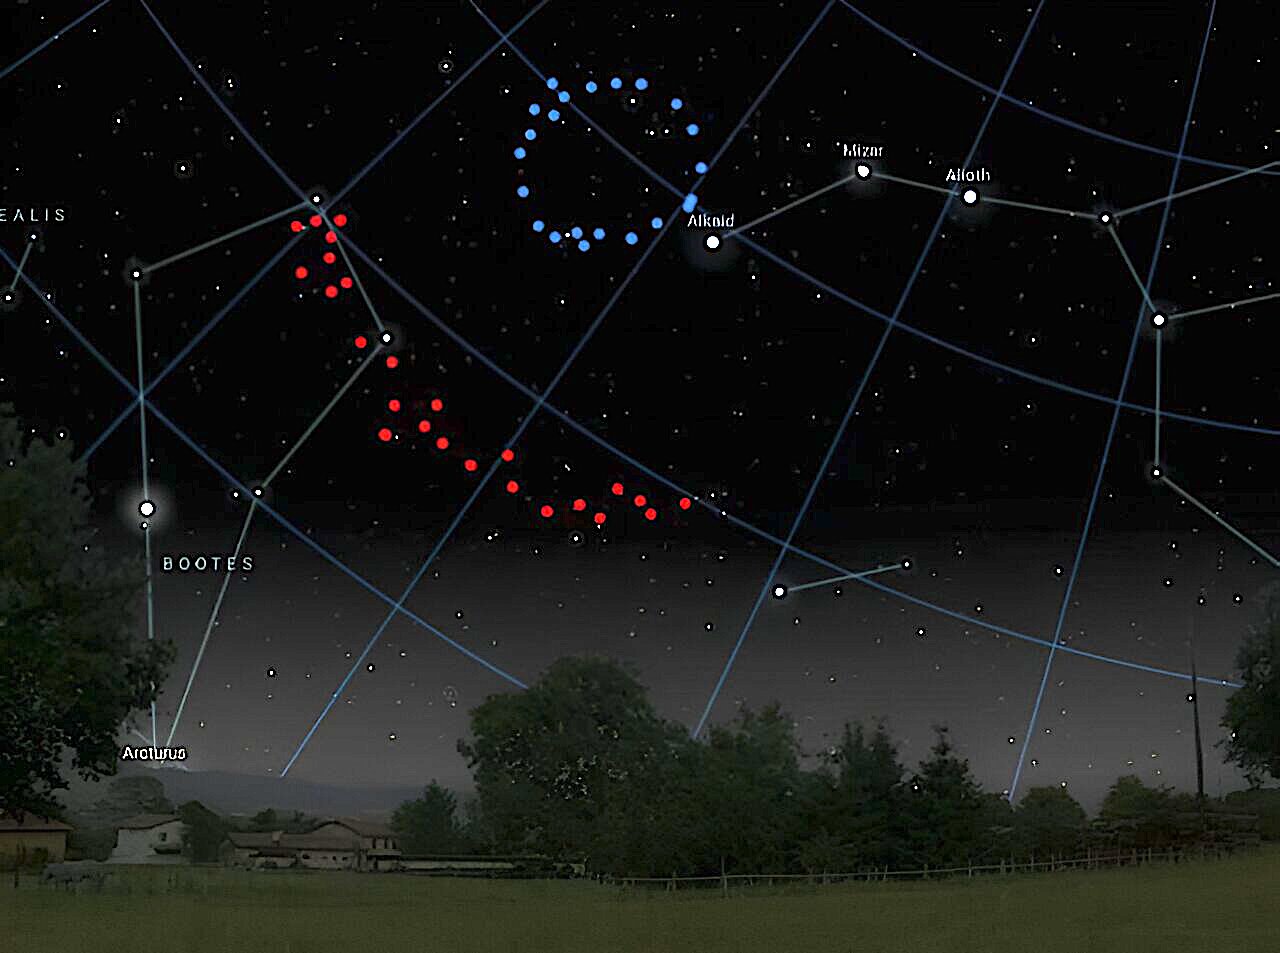
"The Big Ring and Giant Arc are the same
distance from us, near the constellation of
Boötes the Herdsman.... Identifying two
extraordinary ultra-large structures in such
close configuration raises the possibility
that together they form an even more
extraordinary cosmological system.
" |
The
UCLan article also suggests that these size violations
of the 'Big Ring' are outside of the ΛCDM predictions, and canvas the idea
that something like the Conformal Cyclic Cosmology
(CCC) model of the group around Nobel Laureate Sir
Roger Penrose have proposed (which we discuss in
our Chapter V. The Cosmic
Microwave Background (CMB) radiation: From Where
and Whence? "As far as the eye can see?"
along with other alternative cosmological models).
If Alexia Lopez is correct that both
the 'Giant Arc' and the 'Big Ring' or 'big cork screw'
are associated in a super-structure, then that could
be on the order of ~4 Gly in diameter or more. This
again shows violations of structure-size limitations
within a HBBC / ΛCDM model,
and to question the Cosmological Principle of
heterogeneity and isotropy of our observable Universe,
whether these assumptions work on the scale of our
observable horizon. If not, then standard cosmology
must be questioned.
Gamma-Ray Burst (GRB) aggregations. Another even
more vast set of structures have been tentatively
revealed through distant aggregations of gamma ray
burst (GRB) events illuminating huge, remote
structures. GRBs are considered to be the most
energetic stellar explosions in the Universe. They are
durationally short (from milliseconds to a few hours)
and they are considered to be distributed in
accordance with the cosmological principle, being
thought to be across the skies with large-scale
homogeneity and isotropy. They are hypothesized to
result from the core collapse of supermassive stars
into neutron stars and stellar blackholes, and also
the mergers of neutron stars / stellar black holes
with each other.
The data on GRBs was collected by the
orbiting Compton Gamma Ray Observatory (CGRO, link, wikipedia)
collecting data from 1991-2000 in the 20 keV to 30 GeV
region of the spectrum. One of the projects, called
the Burst and Transient Source Experiment (BATSE; link) searched
across the sky for gamma-ray bursts (20 to >500
keV) finding more than 2700 events:
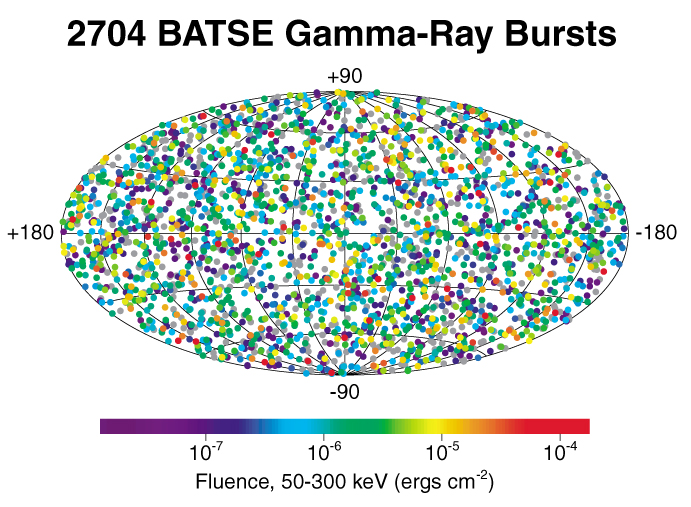 Angular locations of GRBs in the
skies with their color-coded energies (Compton Gamma
Ray Observatory legacy, 2016;
Angular locations of GRBs in the
skies with their color-coded energies (Compton Gamma
Ray Observatory legacy, 2016;
https://asd.gsfc.nasa.gov/blueshift/index.php/2016/04/13/lookingbackcgro/),
exhibiting rather high levels of apparent homogeneity.
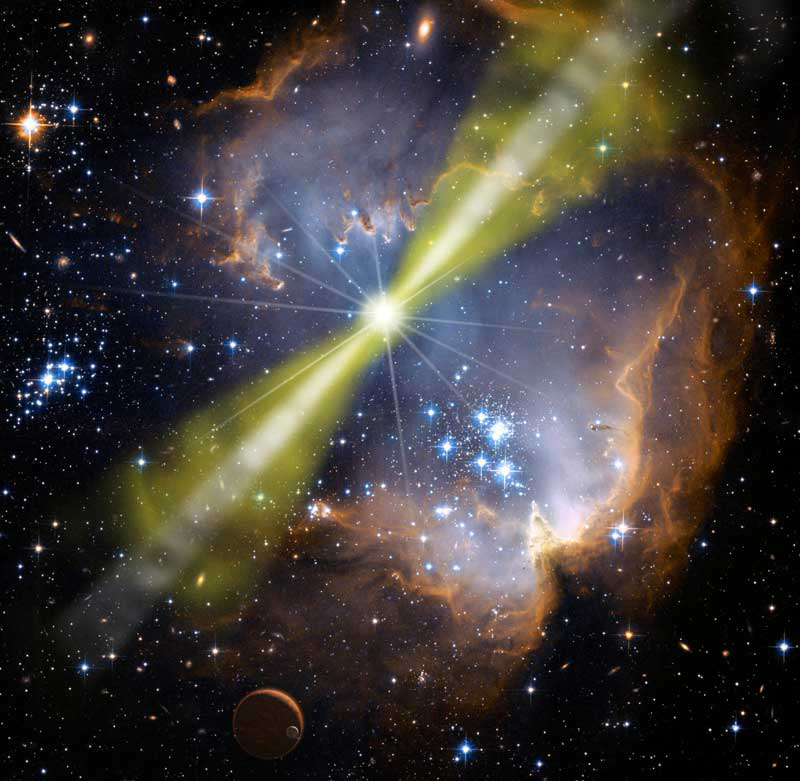 An artist's conception of a bright GRB
in an active star-burst region within a galaxy
An artist's conception of a bright GRB
in an active star-burst region within a galaxy
(https://en.wikipedia.org/wiki/Gamma-ray_burst).
From
the BATSE project, "the complete spectral catalog
of bright BATSE gamma-ray bursts" has been
published by Kaneko et al. [2006; ApJ
Suppl. Series 166 (1),
298. https://iopscience.iop.org/article/10.1086/505911/pdf].
A follow-up space observatory specializing in
gamma ray burst astronomy is the Neils Gehrel
Swift Observatory (https://swift.gsfc.nasa.gov;
cf. link)
launched in 2004, which does not contain an
acronym, 'swift' being a reference to the rapid
observing times, like the swift type of bird. The
Swift program has produced a catalog
of GRBs, with a burst
analyzer complementary site. There is also a
transient
notice site and Swift trigger and burst
real-time information site. An
interesting early finding suggesting something
unusual in distribution that GRBs at certain
regions of the sky would indicate possible vast
structures violating homogeneity assumptions as
well as isotropy assumptions inherent in the HBBC
/ ΛCDM models of the cosmological
principle. The cosmological principle (CP, the
large-scale homogeneity and isotropy of the
Universe) is sometimes held to depend on limit at
the very outermost of a transition scale limit of
the largest possible structures which don't
violate the CP: 370 Mpc (~1.207 Gly). Of
course this limiting of the scale "below which
the CP is valid" is arbitrary in part because it
is HBBC model-dependent.
In 2014, Horvath and colleagues published results from a 2012
measurement of the redshifts of 283 GRBs (Possible
structure in the GRB sky distribution at redshift
two. A&A 561, L12. https://doi.org/10.1051/0004-6361/201323020).
They found that there was an enrichment of GRBs in a
particular direction of the sky in this redshift
range,1.6 < z < 2.1, which clustered
in a statistically-significant aggregation, passing
three statistical tests: Nearest neighbor, 2d
Kolmogorov-Smirnoff, and a Bootstrap Point-Radius
Method. This structure ~10 Gly away (10x farther
than the Sloan Great Wall and 6x larger) has
dimensions of about 2000-3000 Mpc (~ 6.5 - 9.8 Gly),
i.e., far beyond the HBBC ΛCDM size limit.
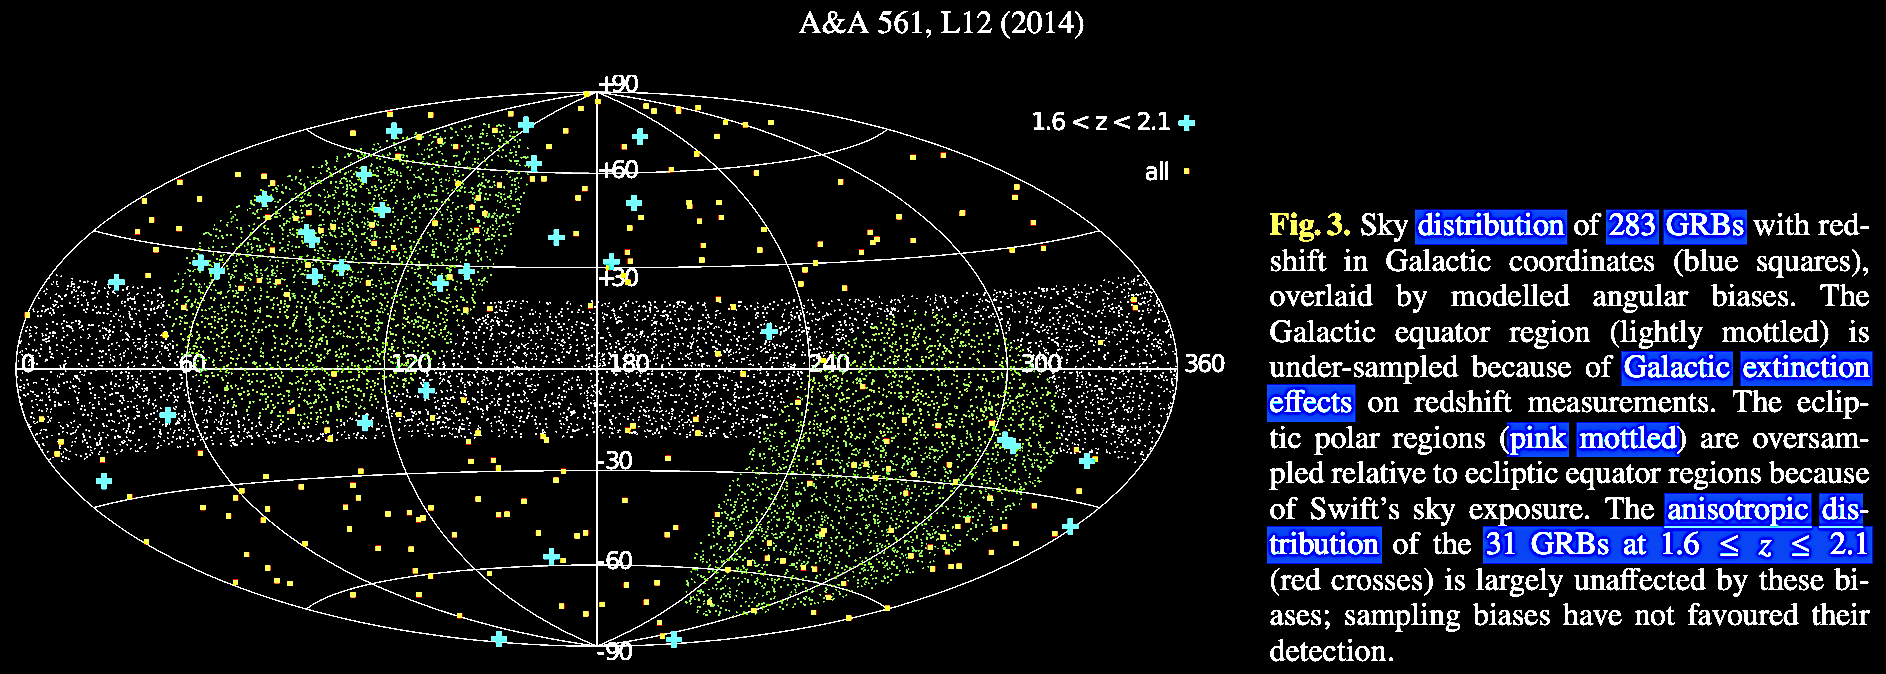
Figure 3 note: On
a projection of the Galactic celestial sphere, the
283 GRBs in total are essentially homogeneous and
isotropic in their distribution (blue squares =
yellow squares in inversion). The Galactic
extinction region along the Galactic plane is
represented by the lightly mottled or stippled
equatorial zone. Earth's ecliptic polar regions
(pink mottled = green mottled in inversion) are
over-sampled due to the GRB orbiting observatory
Swift's sky view. The 31 GRBs in the 1.6 < z
< 2.1 redshift range exhibit a striking
anisotropy (prominent red crosses = greenish in
inversion).
A preliminary 2013 paper
presented at the 7th Huntsville Gamma Ray Burst
Symposium (GRB 2013) by Horvath et al.
(The largest structure of the Universe, defined by
Gamma-Ray Bursts, paper 33 in eConf Proceedings
C1304143; https://arxiv.org/abs/1311.1104)
showed their early identification of the GRB
structure, with a binomial probability of such an
angular anisotropy to be artifactual at only p
= 0.0000055.
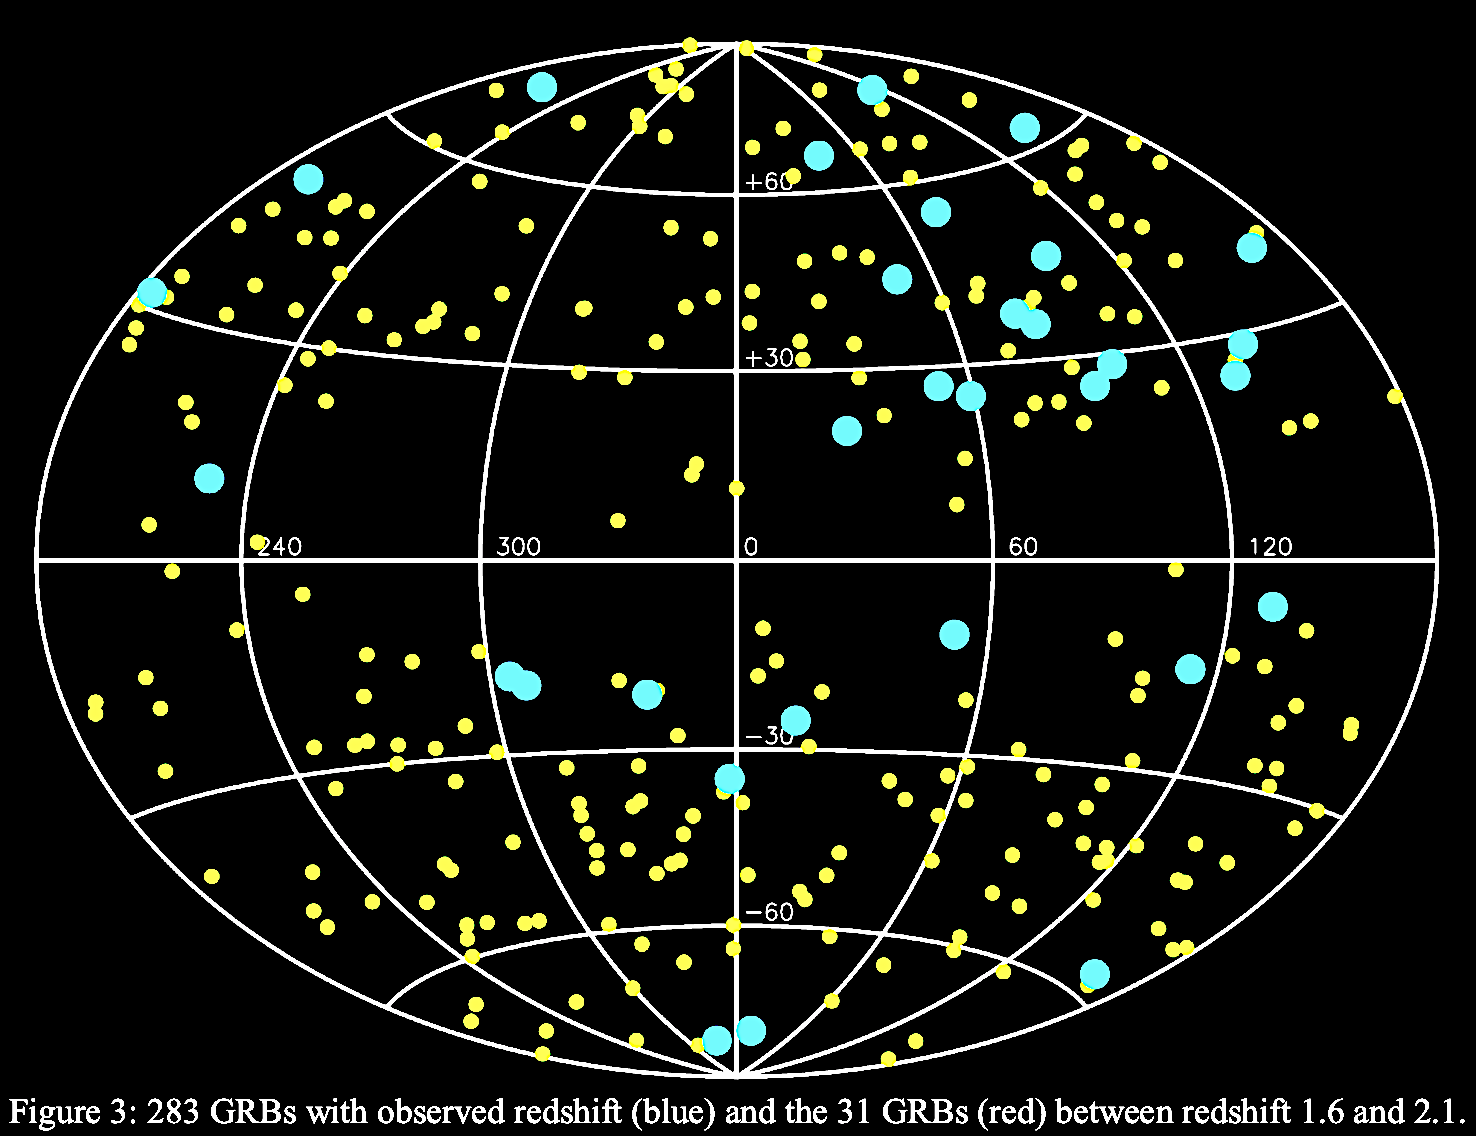 283 GRBs with measured redshifts
(blue = yellow inverted) and the 31 GRBs in the
1.6 < z < 2.1 zone (red = teal).
283 GRBs with measured redshifts
(blue = yellow inverted) and the 31 GRBs in the
1.6 < z < 2.1 zone (red = teal).
Another enormous GRB structure is
the so-called "giant GRB ring-like" aggregate of 9 GRBs,
discovered in the 0.78 < z < 0.86
range, at a distance of 2770 Mpc (~9.03 Gly)
covering an angular size of 43 by 30 degrees,
(Balazs et al. 2015. A giant ring-like
structure at 0.78 < z < 0.86 displayed by
GRBs. MNRAS 452 (3), 2236.
https://doi.org/10.1093/mnras/stv1421;
arXiv: https://arxiv.org/abs/1507.00675).
This implies that the ring-like structure is about
1720 Mpc (~5.61 Gly) in size, thus "large enough
to contradict the CP [cosmological principle]" as
the authors point out in their abstract, with a p
= 2 x 10⁻⁶ probability of being "a
random fluctuation in the GRB count rate." The
authors go on to state that "the physical
mechanism responsible for causing it is unknown."
One not terribly daring thought emerging is that
this is yet another "anomaly" for the HBBC ΛCDM theory.
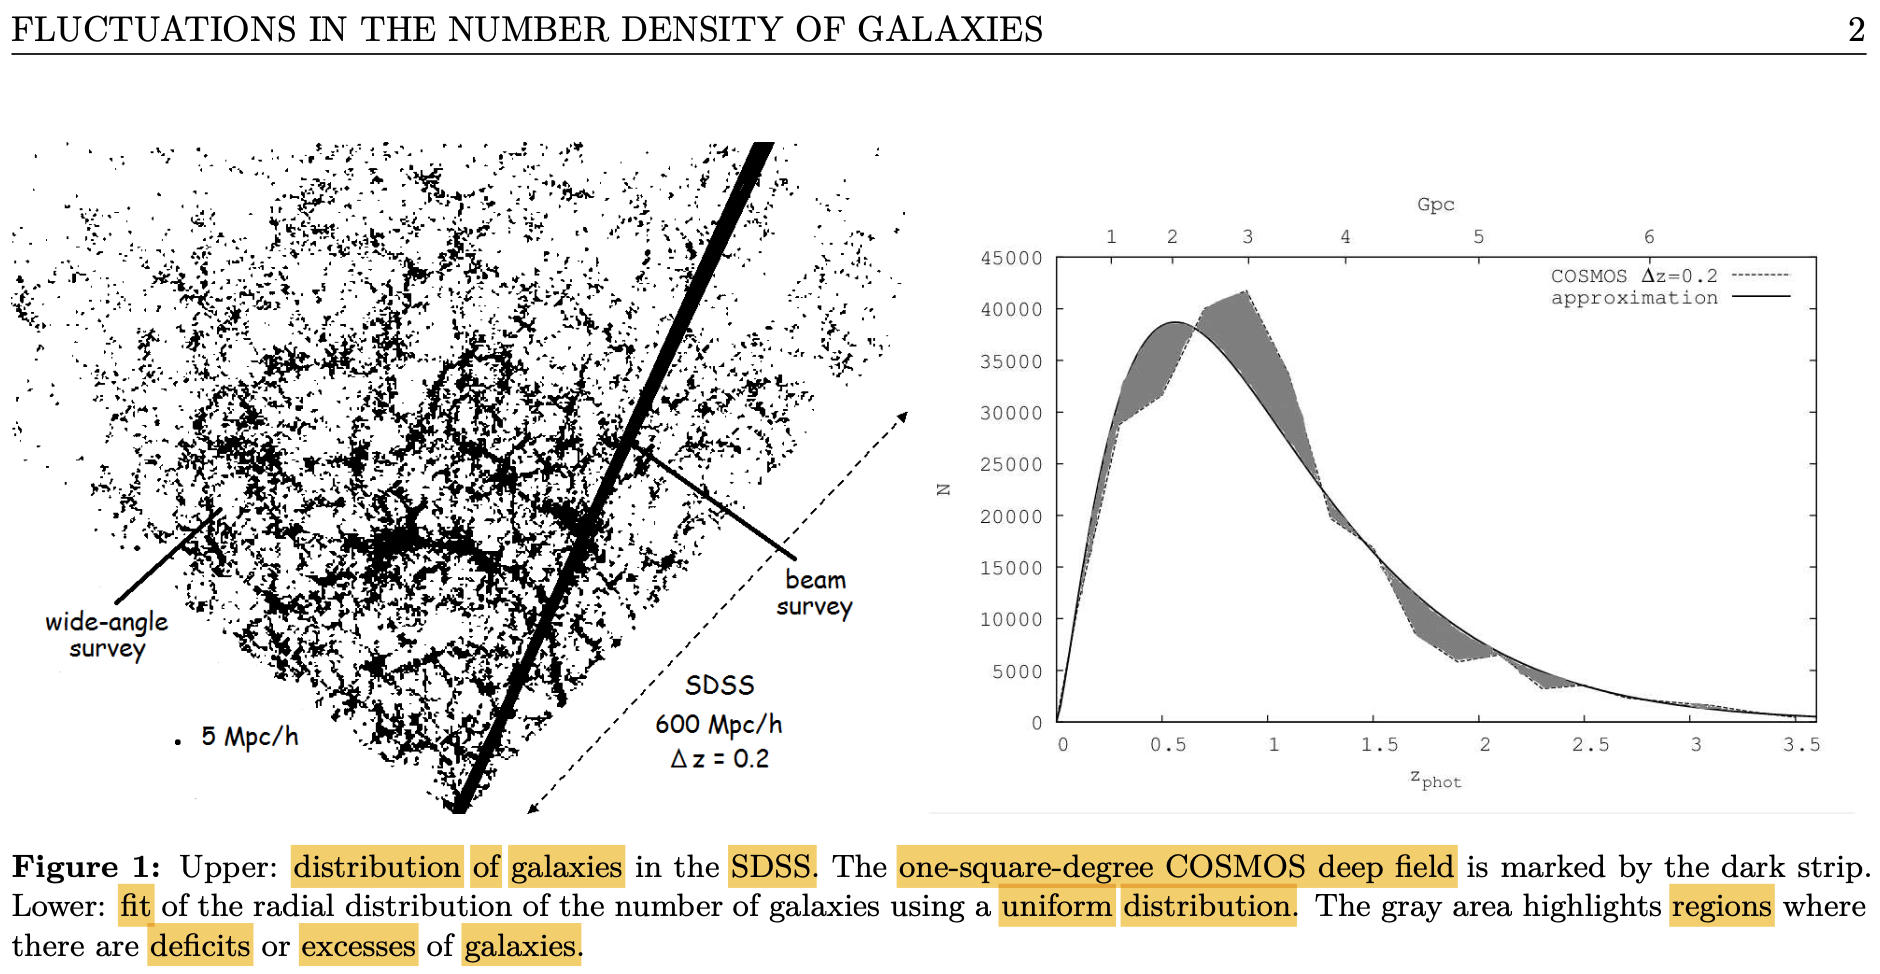
The very largest
structures so far showing violations of
homogeneity on a colossal scale involved
pencil-beam 1 degree wide surveys in the Hubble
Deep Field, North (HDF-N) and the Hubble Ultra
Deep Field (HUDF), and were published by a Russian
group, Shirakov et al. (2016). Large-Scale
Fluctuations in the Number Density of Galaxies in
Independent Surveys of Deep Fields. Astronomy
Reports 60 (6), 563. https://link.springer.com/article/10.1134/S1063772916040107.
Originally published in the Russian Astronomicheskii
Zhurnal 93 (6), 546; also in arXiv:
https://arxiv.org/pdf/1607.02596.pdf;
this paper was also cited with some formation time
estimations by Lerner, 2022. Observations of
Large-Scale Structures Contradict the Predictions
of the Big Bang Hypothesis But Confirm Plasma
Theory. https://www.lppfusion.com/storage/Structure-2022-.pdf).
The Shirakov group discovered that the structures
sampled in their pencil-beam survey showed massive
departures from the homogeneity curve, complete
with deficit and excess densities of galaxies:
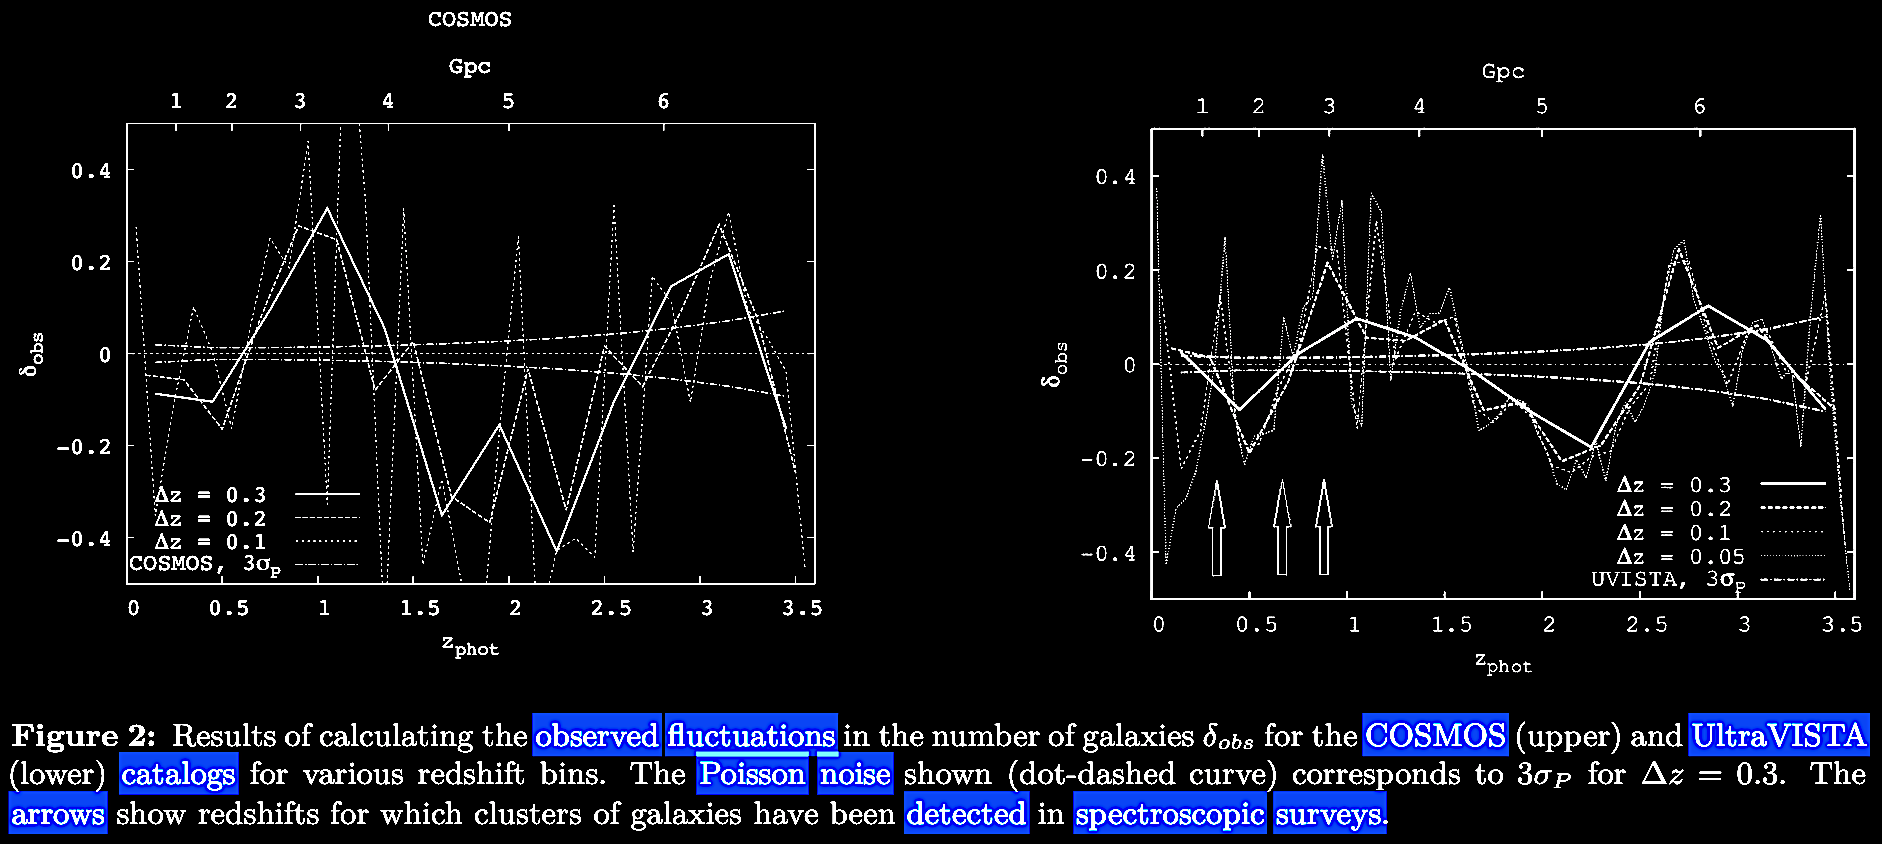
What
these pencil surveys imply is that there are
structures so vast that they are astoundingly
~/≥
3 Gpc in size or more (~/≥
9.8 Gly). This is staggeringly beyond the HBBC
ΛCDM model's assumptions of homogeneity. In
his comments upon Shirakov et al.
(2016)'s Figure 2a above left, dissident
plasma cosmologist Eric Lerner (2022) wrote
the following description of what we observe
here, including that these distances are ΛCDM model
dependent.
Musings on gigantic structures
from non-paradigmatic & paradigmatic stances.
If these giant structures are gravitationally-bound
(as they would be in the supposedly homogenous,
isotrophic Big Bang world, compounding the "dark
matter" ad hoc problem) rather than coming
apart from their multiple origin points (as they would
be in the modified cyclic or Quasi Steady State
universe with negative, scalar C-field
activation in the presence of pre-existing matter
gravitational concentrations, or some other
theoretical scenario), then they should require
billions of years longer than the 1/H0
supposed age (~13.8 Ga) of the Big Bang cosmos to
form. Under even gravitationally-bound, viriality
assumptions (see discussion in the forthcoming chapter IX
on "Vast jets, and galactic ejection phenomena"),
these may be direct empirical evidences in their own
right that we live in a Universe far older and by
implication vaster than the HBBC scenarios.
Conversely, despite the multi-featured nature of the
accumulating data, Ethan Segal, in a
pro-paradigmatic op-ed
in January 2024, questioned the growing published
claims that such HBBC-verboten large structures
as the "Big Ring" or the "Giant Arc" actually exist out there,
and are not mere visualized apparent patterns. He also critiques the
Hercules-Corona Borealis Great Wall, the Giant GRB
Ring, the Huge-LQG, the U1.11 LQG, and the
Clowes-Campusano LQG: All "ranging in size from ~2 to
~10 billion light years," he adds. The only large
structure he does not question is the HBBC-compliant
CfA2 Great Wall then reported to be 600 x 250 x 30 million light years in
size (Geller & Huchra, 1989).
Although question-raising in its own right, this <1
Gly large structure was comfortable enough so that Michael
Riordan & David Schramm could publish their
paradigmatic 1991 volume, Shadows of Creation:
Dark Matter and the Structure of the Universe.
New York, NY: W. H. Freeman (link),
which popularized the 'dark matter' web scaffolding
for ordinary matter in the HBBC. Segal cites the Malmquist
bias (an astronomical bias-in-detection of
intrinsically-bright objects [link],
a bias which also illustrates the selective
HBBC-inspired interest in certain bright objects and
not in others in cosmology, as is evident in certain
publications cited in chapter V for
instance) as a possible source of such 'structures.'
He argues that there is "little-to-no evidence" and
these patterns are like extra-galactic 'asterisms'
mistaken by statistics for an actual star cluster,
like the nearby asterism (~5,000 ly), Brocchi's
'cluster':
Segal op-ed's
citation of various figures:
(link).
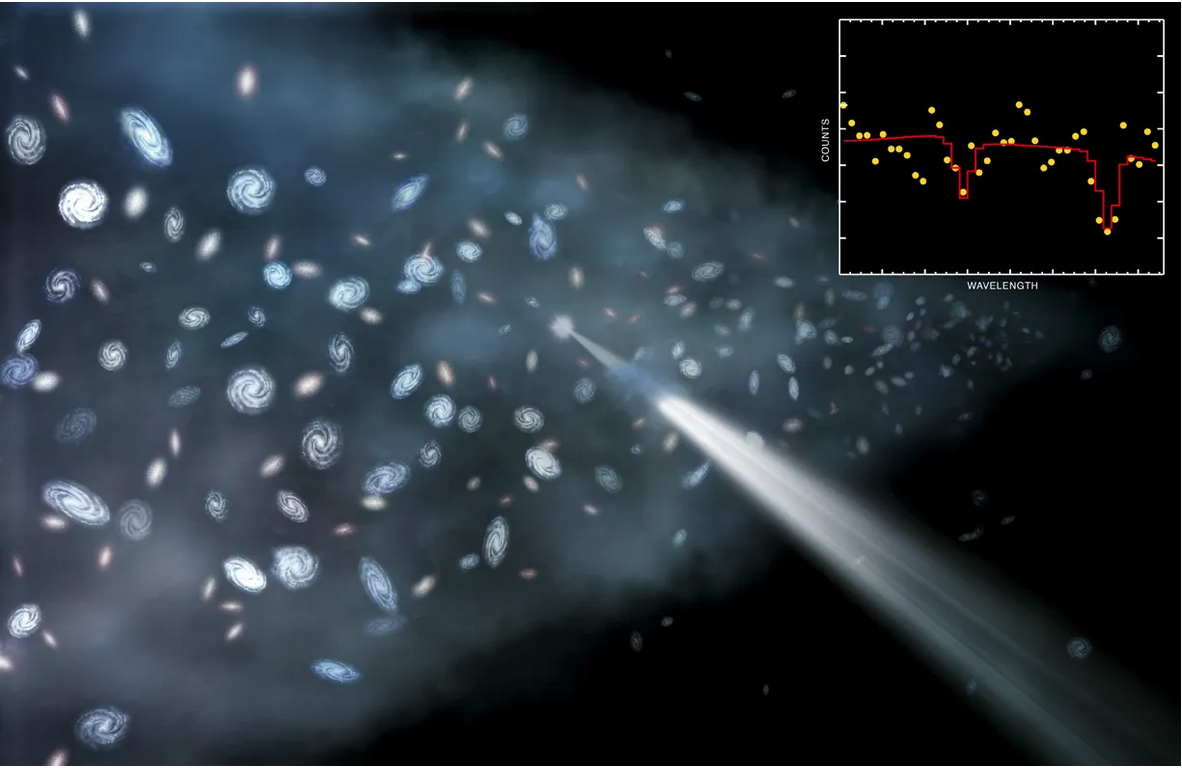
In citing
this artist representation, Segal avers that
since galaxies (in 'cosmic filaments'
whatever that means in model-dependent and
model-independent ways) are surrounded by
matter in neutral and ionized, the
absorption spectra show the density and
temperature not only of the intergalactic
media around those galaxies, but also around
the intervening galaxies, and in our own
galaxy, so therefore such absorption spectra
(as in the Mg-absorption of the 'giant arc'
and 'big ring') are biased / imperfect
indicators of underlying mass distribution,
which he asserts paradigmatically includes
'dark matter.' Aside from the fact that the
absorption features likely have their own
spectral redshifts, he does not mention that
the 'dark matter' existence is an assumption
required by the deeper assumption of
viriality in the HBBC ΛCDM. So the claims of
beyond ΛCDM-allowed large structures
existence should not simply be dismissed on
such model-based grounds.
|
.png)
(link).
The op-ed
cites the redshift-space 'fingers of god'
(FOG) distortions (or phenomena) as
artifacts which had to be removed from the
SDSS galaxy sample, assuming the effect was
entirely caused by galaxy proper motions in
an HBBC cosmos. Actually, there are reasons
to think that there are data of cosmological
model-testing significance in the so-called
'fingers of god' phenomena, as discussed
below.
|
(cit. link).
Segal's
op-ed also slams the claims about large
structure derived from QSOs (which he claims
are the result of non-merging galaxies) and
from transient Gamma Ray Bursters (GRBs),
such as GRB170817A pictured above, in part
because GRBs are found in ordinary galaxies
caused by neutron star collisions resulting
in kilonovae, which can be juxtaposed, and
therefore don't necessarily represent large
structure markers. However, if the large
structures with mostly ordinary galaxies
exist, one would expect that GRBs would
illuminate these in 'Christmas tree' style.
His argument here seems particularly weak.
|
Brocchi's
'cluster' which is really an asterism:
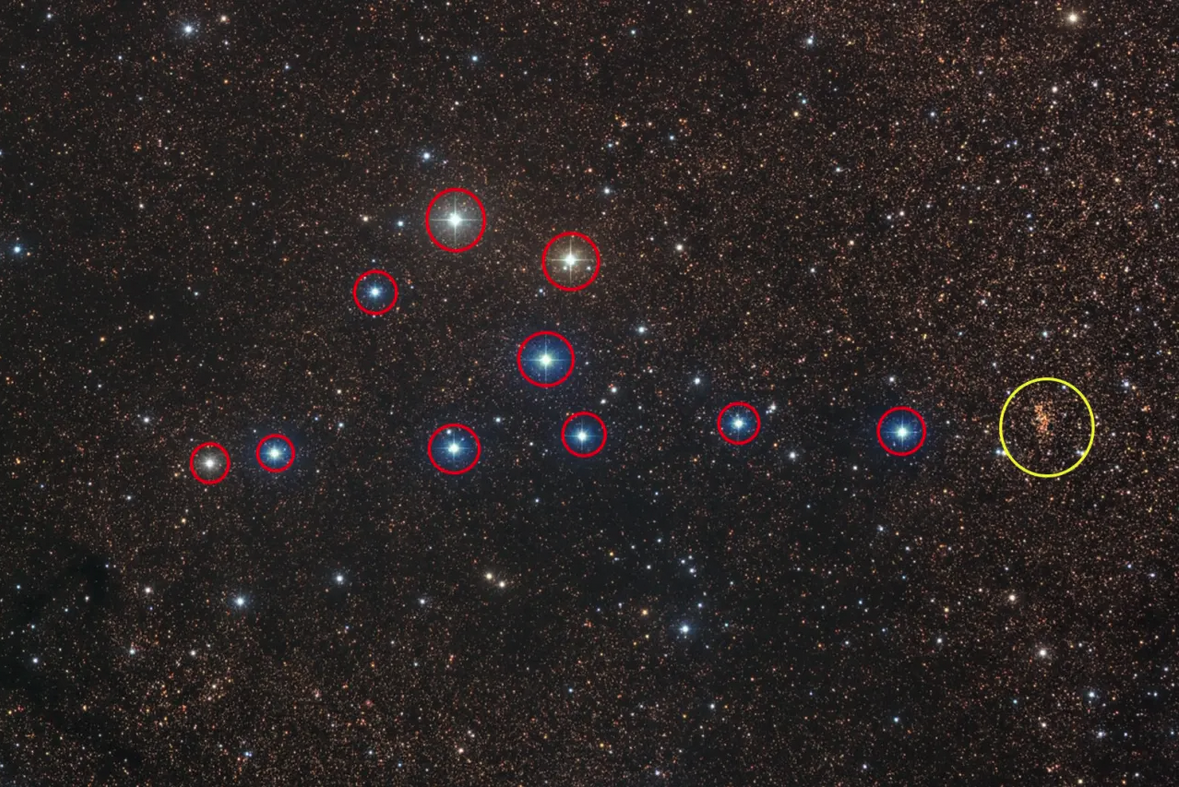
(op-ed annotated link
citing link).
As an
example of his claims about artifactual
juxtapositions of QSOs or GRBs, Segal cites
the asterism, which statistically (without
other information) was thought to be a bona
fide star cluster.
Of course, the authors he critiqued, while
using statistics to buttress their claims of
detecting large structures, also cited data
beyond mere juxtaposition.
|
Segal's op-ed also
expressed his peeve about the UCLan issuing a press
release (link)
before the Lopez et al. (2024) paper was
released. His annoyance and pique seems unnecessary
given that the university wished to highlight and
generate interest in the work of their doctoral
student Alexia Lopez and her her advisor, so that when
the paper was released, a discussion could begin. One
hopes that the controversy is not what causes the
annoyance.
More galaxy superclusters or superstructures.
Before turning to the primary paper, in February of
2025, the Universe Today (link) blog
released a superlative-swinging news story,
"Astronomers Find the Largest Structure in the
Universe and Name it 'Quipu'" (link),
on the paper by Böhringer et al. (2025). Contrary to the usual
method in these popular stories about new giant
structures, the UT blog authors instead of
starting with the putative dimensions light-years or
megaparsecs, start with the estimated mass of the
newly identified galactic supercluster named 'Quipu'
named after the Incan knotted rope measuring system (link):
400 quadrillion solar masses (~400 x 1015
M☉), and then name the size as
>1.2 Gly (actually ~1.4 Gly, see paper below). Of
course, a quick glance at the literature shows that in
fact lengths of >1.2 or ~1.4 Gly do not make the
largest structure known, since we also structures
distinctly larger (as summarized in this chapter and
its references; see the data reviewed by Aluri et
al. 2023 cited below). It is important to note
again that the
HBBC ΛCDM theoretical size
limit according to Hunt & Sarkar (2010) is
calculated to be between ~250 and ~300 Mpc or
(~820 ly and nearly ~1 Gly) at most.
UT blog
entry (February 2025) figures (with blog legends
quoted):
UT blog site figures (link).
The
blog at one point says that some of the giant
structures "are so massive that they break our
models of cosmological evolution" and state that
the great mass of such structures "distorts our
measurement of the Hubble constant" (H0) and "can alter and
distort our sky images through large-scale
gravitational lensing. This can introduce errors
in our measurements." They go on to claim that
simulations under the ΛCDM can accommodate them.
Also, they state that such
"superstructures leave on imprint on
the ... CMB
... [through] the integrated Sachs-Wolfe (ISW)
effect." The Sachs-Wolfe effect is the
gravitational shift of CMB photons by mass-energy
distributions at 'the surface of last scattering'
supposedly primordial (non-integrated SW effect;
~400 ky post-BB) while the integrated SW effect is
the effect of gravitational redshifts between the
primordial surface of last scattering and the
observer. Separating these is a challenge, and
there are protocols within the standard cosmology
to attempt to do so. At any rate, this UT
blog entry does not seem to understand how the ΛCDM version of the HBBC is
challenged by such results.
We turn to the primary paper now:
Böhringer, H., Chon, G., Trümper,
J., Kraan-Korteweg, R. C., &
Norbert Schartel, N. 2025. Unveiling
the largest structures in the nearby
Universe: Discovery of the Quipu
superstructure. arXiv release 31
January 2025: https://arxiv.org/abs/2501.19236.
First of all, it is important to
recognize that the authors are
referencing the discovery of local
giant structures in the 'nearby
Universe,' indicating that their work
is not specifically about giant
structures more remote in the
Universe, such as are canvassed in
other studies cited in this chapter.
They indicate that local giant
structures will have effects on local
streaming / peculiar velocities,
gravitational lensing in our imagery
of the sky (including of the CMB), and
on measurements of the Hubble
constant, H0.
Since they considered that the local
Universe has been well-characterized
out to z ~ 0.03, their goal
was to do an all-sky survey of galaxy
clusters as tracers of large-scale
mass-energy distribution for a
cosmography across the redshift range
of z = 0.03 –
0.06, which with their
adopted flat
cosmology, a Hubble
parameter of H0
= 70 km s–1
Mpc–1,
and a matter density
parameter of Ωm
= 0.3, corresponds to
a distance range of
130 –
250 Mpc, ~424 –
~815 Mly.
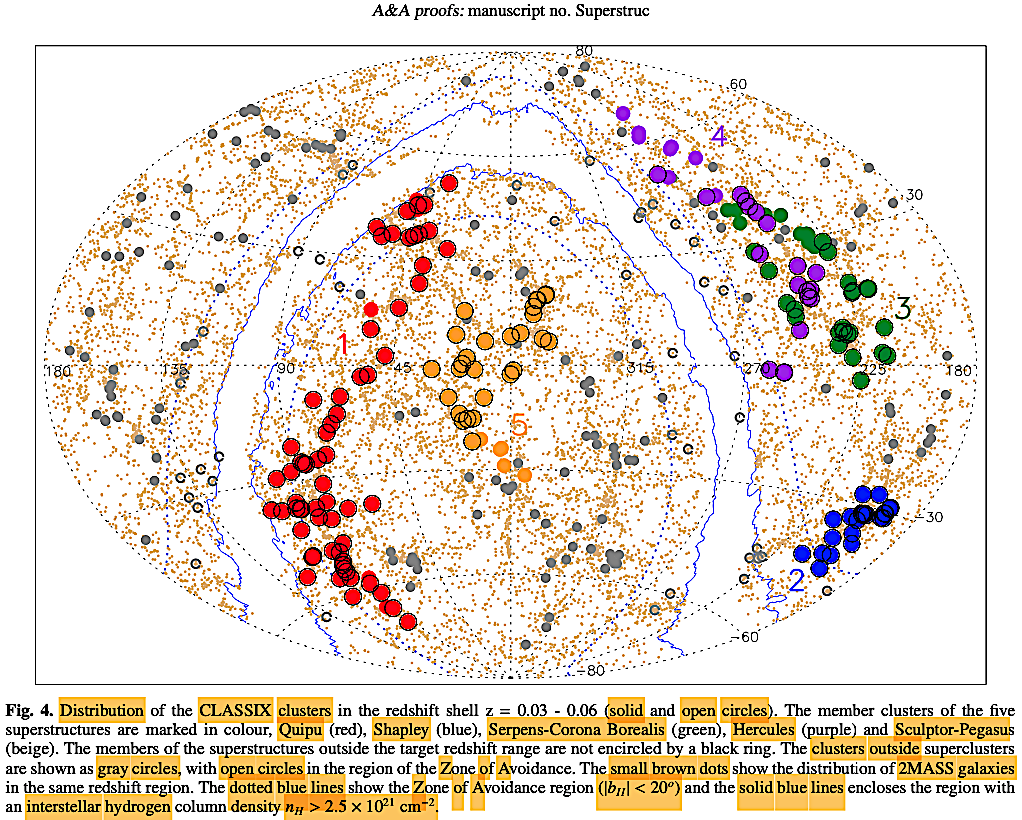
They used the CLASSIX cluster survey
based on X-ray cluster detection
through the ROSAT All-Sky Survey [Trümper,
J. 1993. ROSAT—A new look at the X-ray
sky. Science 260
(5115), 1769. https://doi.org/10.1126/science.260.5115.1769],
and the full cluster catalogue used in
the study may be found at http://cdsweb.u-strasbg.fr/cgi-
bin/qcat?J/A+A/. The survey
covers about 86% of the sky including
part of the galactic zone of avoidance
(ZoA) at latitudes |bII|
< 20o. Their criteria
for inclusion as a cluster is having a
minimal estimated mass of ≥ 1013
M☉.
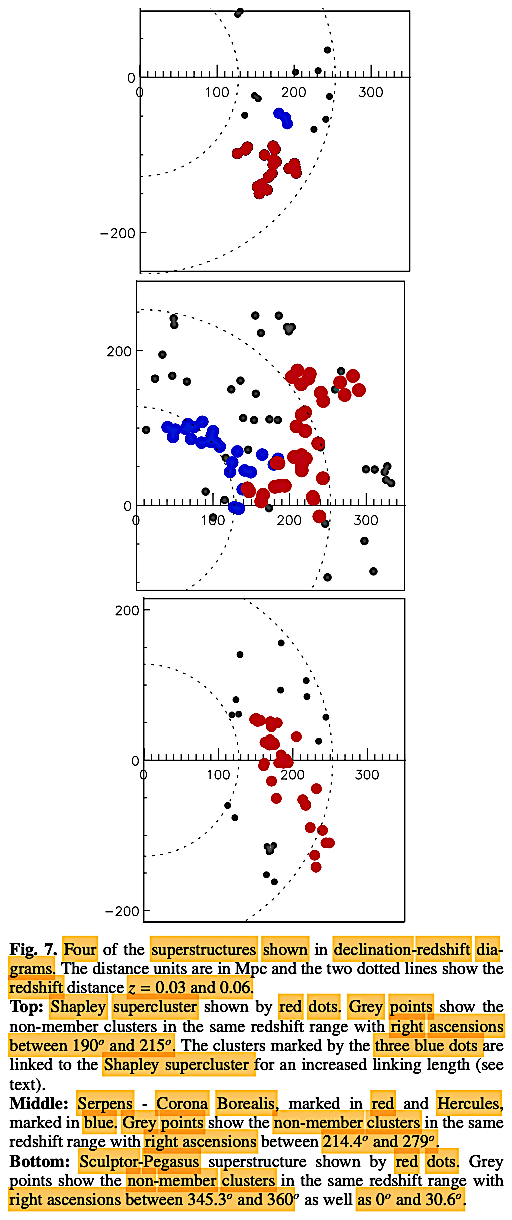
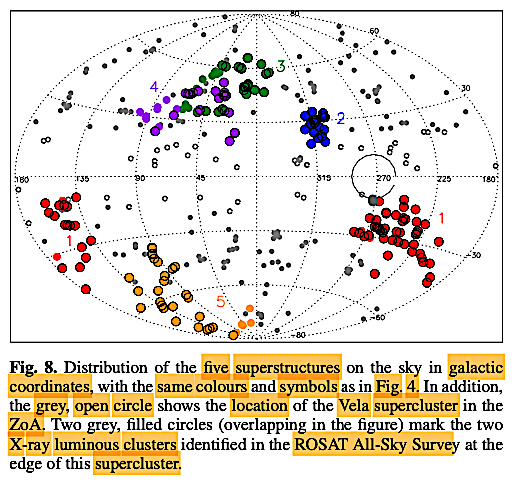
Within this redshift interval, they
found 6 giant superclusters with
>20 CLASSIX galaxy cluster members
out to z = 0.06, and only
supercluster found nearer than z
≤ 0.03 is the Perseus-Pisces
supercluster, previously described
(Böhringer, H., Chon, G., &
Trümper, J. 2021. The cosmic
large-scale structure in X-rays
(CLASSIX) cluster survey: III. The
Perseus-Pisces supercluster and the
Southern Great Wall as traced by X-ray
luminous galaxy clusters. A&A
651, A16. https://doi.org/10.1051/0004-6361/202140864):
Böhringer et
al. (2025).
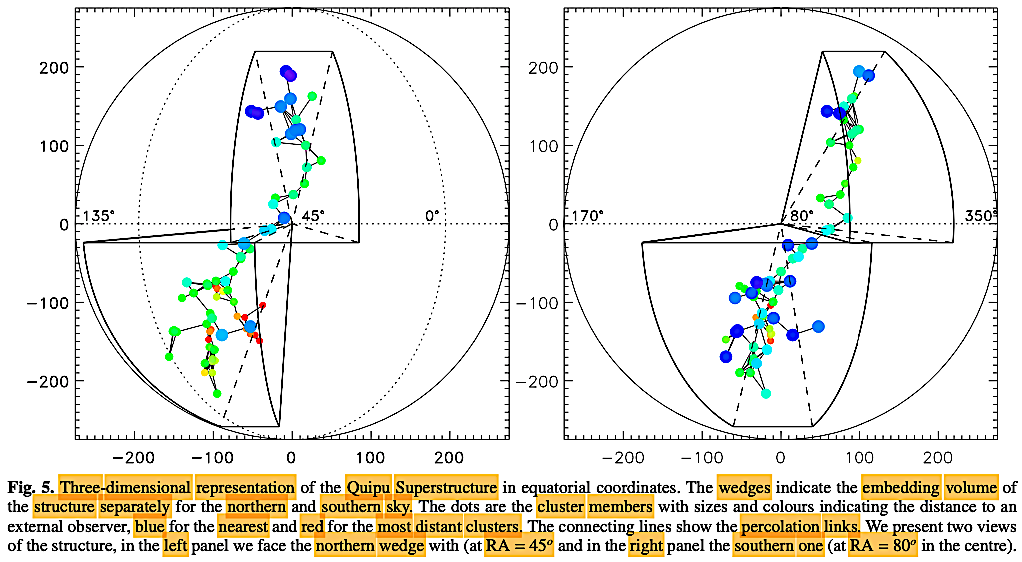
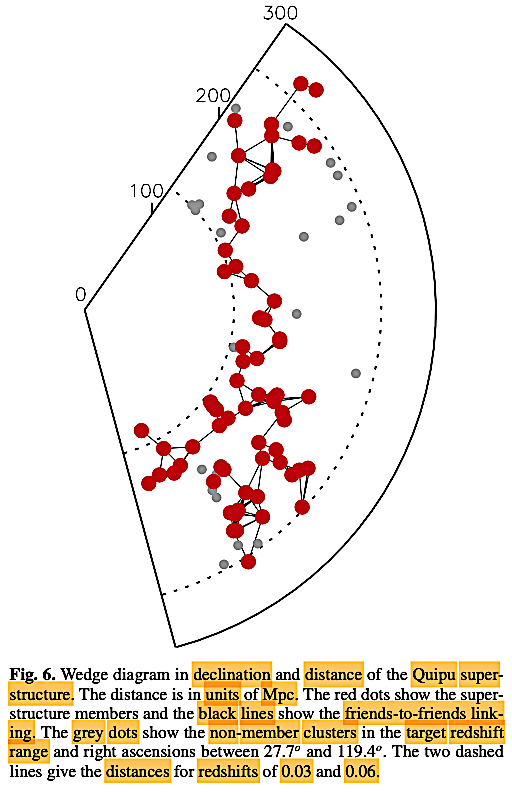
The Quipu supercluster
stretching across z
= 0.027 –
0.065, has a
length of 428
Mpc, which is
~1.4 Mly,
making it the
largest
superstructure
in the local
Universe, as
well as above
the
theoretical
threshold
limit for the
HBBC (Hunter
& Sarkar,
2010). The
authors do not
comment on
that.
In reaching
their various
conclusions,
the authors
rely heavily
on simulations
and parameter
fitting within
various ΛCDM
scenarios of
the HBBC,
including
various
simulated
estimations of
the
overdensities
of galaxies
compared with
extrapolations
from the data
contained
within the
'superstructures'
as opposed to
more 'typical
superclusters,'
following the
extrapolation
that these
superstructures
are larger in
size and have
lower
overdensities
than typical
superclusters,
and thus are
comparable
only to the
largest
superclusters
known (Chon,
G., Böhringer,
H., &
Zaroubi, S.
2015. On the
definition of
superclusters.
A&A
575,
L14. https://doi.org/10.1051/0004-6361/201425591),
hence they
used 'a
friends-of-friends
algorithm' to
find these
superstructures.
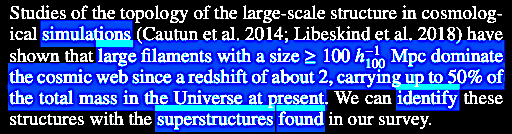
- Based
on the data from the 'nearby
Universe,' they conclude that
'superstructures are a major
component of the Universe' with ~45%
of the clusters, ~30% of the
galaxies, ~25% of the matter
occupying ~13% of the volume, which
they contrast with 'more typical
superclusters (including cluster
pairs)' with overdensities of ~7%,
~50% of the clusters in a volume of
~7% (Chon, G., Böhringer, H.,
Collins, C. A., & Krause, M.
2014. Characterising superclusters
with the galaxy cluster
distribution. A&A 567,
A144. https://doi.org/10.1051/0004-6361/201424047).
- Based
on their Millennium simulations of
overdensities of matter and 'dark
matter,' (see their Figures 1-2, not
reproduced here), they conclude that
these superstructures correspond
with the large filaments in the
simulations (setting aside the large
structure limits of the ΛCDM
models of the HBBC. They write,
 Citing Cautun, M., van
de Weygaert, R., Jones, B. J., &
Frenk, C. S. 2014; 2015; 2016.
Understanding the cosmic web. Proceedings
of the International Astronomical
Union 11 (S308), 47. https://doi.org/10.1017/S1743921316009613;
arXiv submission, June 2015: https://arxiv.org/abs/1501.01306;
and Libeskind, N. I., van de Weygaert,
R., Cautun, M., et al. 2018.
Tracing the cosmic web. MNRAS 473
(1), 1195. https://doi.org/10.1093/mnras/stx1976.
Citing Cautun, M., van
de Weygaert, R., Jones, B. J., &
Frenk, C. S. 2014; 2015; 2016.
Understanding the cosmic web. Proceedings
of the International Astronomical
Union 11 (S308), 47. https://doi.org/10.1017/S1743921316009613;
arXiv submission, June 2015: https://arxiv.org/abs/1501.01306;
and Libeskind, N. I., van de Weygaert,
R., Cautun, M., et al. 2018.
Tracing the cosmic web. MNRAS 473
(1), 1195. https://doi.org/10.1093/mnras/stx1976.
A big question is how do they get around
the theoretical size limits in the ΛCDM?
Well, that's
easy; they
simply assert
at the end of
the paper in
the last
paragraph that
"In the
future cosmic
evolution,
these
superstructures
are bound to
break up into
several
collapsing
units. They
are thus
transient
configurations.
But at present
they are
special
physical
entities with
characteristic
properties and
special cosmic
environments
deserving
special
attention"
(emphasis
added).
This is simply
a suggestion
that these
large
structures are
not
gravitationally-bound,
that is, they
do not comply
with the
viriality
theorem.
See the
forthcoming
chapter IX. Vast jets and galactic ejection phenomena. Such
structures
would thus have
implications
for testing
the AVVA
cosmogony
suite of
hypotheses
(see in
chapters V, this chapter VI,
VII, VIII,
and IX so far). |
|
|
Comment. The
'friends-to-friends algorithm'
linking is a way to find the
'superstructure' associations
among the clusters of galaxies
without having to abide by the
viriality theorem /
'gravitationally bound'
assumptions required by the ΛCDM
models of the
HBBC—assumptions
which spawned
the required
epicycles of
non-baryonic
'dark matter'
within the
HBBC Ptolemaic
system to keep
the paradigm
afloat.
|
|
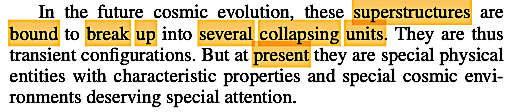
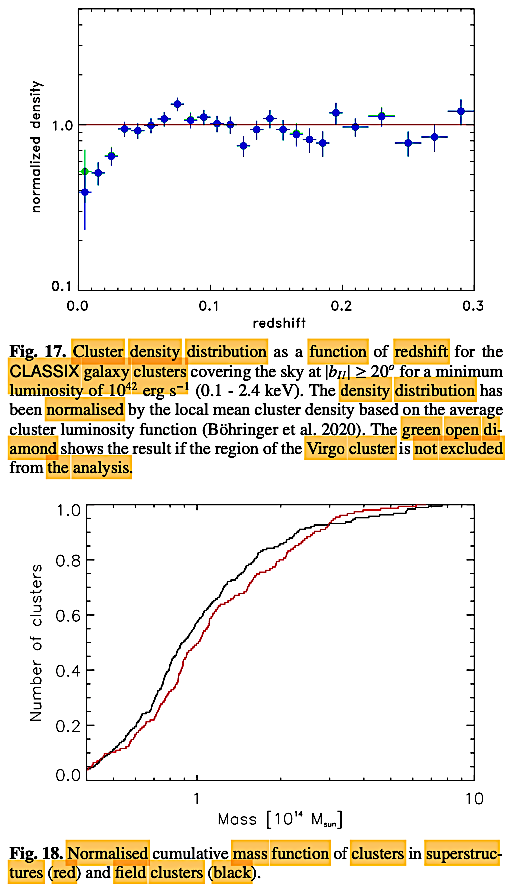
In Figure 17, the
authors show the galaxy cluster
density distribution as a
function of redshift, both
including and 'not excluding'
the Virgo Cluster :). It is
interesting to note that with
the Virgo Cluster, which is
assumed to be gravitationally
bound in the HBBC, there are
data suggesting that it is in
fact no gravitationally bound.
The authors' attempt to find the
cause of the higher galaxy
densities in these non-virial,
i.e., gravitationally-open
'superstructures' yields a
statement which is comical in
its circularity:
... a possibility they explored
in Figure 18 with comparisons of
cumulative cluster mass
functions for both galaxy
clusters and the
'superstructures.'
Before the paragraph runs out,
the authors are forced to
concede that they are left
without a cause for the higher
galaxy density in
superstructures, because, after
running a Kolmogorov-Smirnov
statistical test for the
probability of distinguishing
the two curves, they find that
with a not-significant p
= 0.127 value, there is no
explanatory cause for the
overdensity. By contrast in
their study of classical
superclusters (Chon et al.
2015), they found statistical
support for 'a top heavy mass
function' given 'the constraint
that they [classical
superclusters] are
gravitationally bound'!!
This suggests that the
not-significantly different
cumulative mass function curves
(Fig. 18) imply that the
viriality or 'gravitationally
bound' status of both clusters /
superclusters and the
'superstructures' should be
called into question! That
obviously has deep consequences
for cosmological models. In the
closing paragraph they further
the question with the ambiguous
following words:
 |
|
Finally, we turn
to the issue of integrated
Sachs-Wolfe (ISW) effect of
'superclusters' on the CMB. Here
again deep implications for
competing cosmological models
rise to the fore.
They embark on their 'holy
grail' quest for the ISW
(post-primordial 'surface of
last scattering') effect on the
CMB, by analyzing their data /
simulations with HBBC-dependent
parameter-fitting against the
CMB data (3rd CMB Planck data
release; rather than the Planck
2018 results):
- Planck
Collaboration, Ade, P. A.
R., Aghanim, N., et al.
2016a. arXiv
release 20 Feb 2015: https://arxiv.org/abs/1502.05956.
Planck
2015 results. IX. Diffuse
component separation: CMB
maps. A&A
594, A9. https://doi.org/10.1051/0004-6361/201525936.
- Planck
Collaboration, Ade, P. A.
R., Aghanim, N., et al.
2016b. arXiv
release 17 June 2015 (v3): https://arxiv.org/abs/1502.01589.
Planck 2015 results. XIII.
Cosmological parameters. A&A
594, A13. https://doi.org/10.1051/0004-6361/201525830.
- Planck
Collaboration, Ade, P. A.
R., Aghanim, N., et al.
2016c. arXiv release 11 Nov
2016 (v2): https://arxiv.org/abs/1502.01595.
Planck 2015 results. XXI.
The integrated Sachs-Wolfe
effect. A&A 594,
A21. https://doi.org/10.1051/0004-6361/201525831.
|
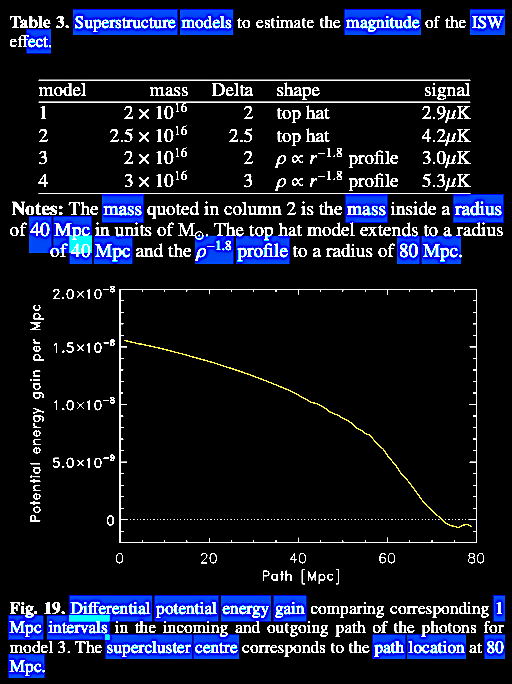
The authors pursue
their 'superstructure' ISW
effect by making a series of
simple mass density assumptions
for simplified 'spherical'
simulated versions of their
superstructures, and then
proceed to scrub CMB data via
various parameter fitting
adjustments to detect ISW,
(following Crittenden, R.,
Boughn, S., & Turok, N.
1996. In American Astronomical
Society Meeting Abstracts, Vol.
189, American Astronomical
Society Meeting. Abstracts,
51.04; and Cai, Y.-C., Cole, S.,
Jenkins, A., & Frenk, C. S.
2010. Full-sky map of the ISW
and Rees-Sciama effect from Gpc
simulations. MNRAS 407
(1), 201. https://doi.org/10.1111/j.1365-2966.2010.16946.x).
|
|
This is done by the ΛCDM-dependent
use of the
Poisson
distribution equation (1) to
account for "the evolution of
the overdensity with time and
the expansion of the Universe,"
.png)
to calculate the
expected ISW effect in
gravitationally-redshifted
temperature in Kelvins changes
in the CMB, where Φ is
the time variable gravitational
potential formulated in a
comoving frame of
reference.
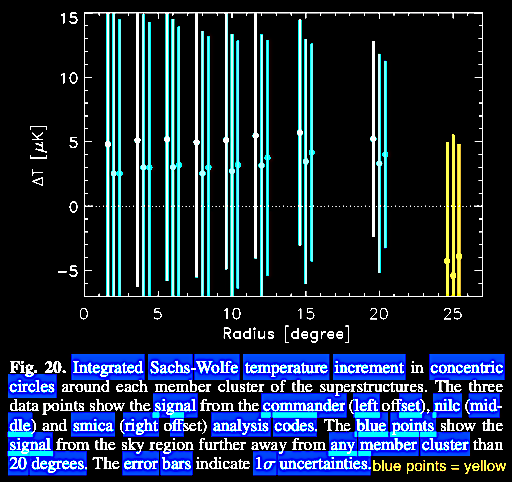
In the search for the ISW
effect, the authors used the
Planck CMB maps "cleaned from
all foregrounds with the
commander, nilc, and smica
methods [software]." They assert
that "the noise in the singal
comes mainly from the
statistical fluctuations of the
primordial CMB" (i.e., the
primordial 'surface of last
scattering'). They argue that
there's a correlation of the
superstructures and the CMB as a
differential function of angular
radius, the signal averaged over
all sky pixels from 2 to 20
degrees, with the highest
significance between 15-20
degrees from superstructures
(Fig. 20). They used aperture
masks of the 5 superstructures
on 100 simulations of the CMB
for each software on simulated
data from https://wiki.cosmos.esa.int/planck-legacy-archive/index.php/CMB_maps.
|
|
After all of the data
massaging, simulations, and cleaning
methods, the integrated Sachs-Wolfe
(ISW) effect could not be detected even
for these local superstructures except
to <1σ. They claim that "the
magnitude of the [ISW] signal is exactly
in the range predicted by the ...
models." However, they immediately
concede: "We note, however, that the
variance of the original CMB
fluctuations is of similar size as the
ISW signal"—hence the non-significance
of <1σ.
They say that the ISW effect has been
found before through "statistical
studies of tracer-CMB correlation
functions" (Giannantonio,
T., Crittenden, R., Nichol, R., &
Ross, A. J. 2012. The significance of
the integrated Sachs–Wolfe effect
revisited. MNRAS 426
(3), 2581. https://doi.org/10.1111/j.1365-2966.2012.21896.x;
Nadathur, S. & Crittenden, R. 2016.
A detection of the integrated
Sachs-Wolfe imprint of cosmic
superstructures using a matched-filter
approach. ApJL 830 (1),
L19. https://doi.org/10.3847/2041-8205/830/1/L19)
and the stacking of many superclusters
and voids (Granett, B. R., Neyrinck, M.
C., & Szapudi, I. 2008. An imprint
of super-structures on the microwave
background due to the integrated
Sachs-Wolfe effect. ApJ 683,
L99. https://doi.org/10.1086/591670)
but still only yielded a significance of
~3σ.
Then another admission: "It is generally
difficult to separate the ISW signal
from the CMB fluctuations even for
larger survey volumes." They express
hopes that significance can be improved
with "a tailored matched filter
detection method," the acquiring of CMB
polarization data on large scales, and
adding superstructures at higher
redshifts. And then this assertion: "A
more precise knowledge of the ISW effect
would in turn also allow to clean the
CMB maps from this foreground
modification."
Comment. And there we have it,
- On
a low-level blackbody radiation
permeating the sky, where repeated
thermalizations and
re-thermalizations are likely
happening, separating the primordial
'surface of last scattering' from
other surfaces of last scattering is
a conundrum which is HBBC
model-dependent. A renewed and
less-stacked look at the CMB and at
cosmological models could be a
breath of fresh air.
- The
giant superclusters and
superstructures may well not be
gravitationally-bound in keeping
with the viriality theorem, making
'cold dark matter' and other HBBC
epicycles unnecessary.
Surely,
it is past time for a full and open
reevaluation of cosmologies.
|
Böhringer et al. (2025).
Gigantic
Voids as inverse structures. Concomitant with an
extremely interesting feature of large cosmic structure is
the existence and nature of large-scale and even giant
cosmic voids found in intergalactic space:
A survey of ~110,000
galaxies about 2 Gly from Earth including the Shapley
Supercluster, and showing areas of far less galactic density,
excluding the Milky Way galactic 'dark' wedge zones of reduced
visibility (https://www.newscientist.com/article/dn16903-new-cosmic-map-reveals-colossal-structures/).
Before we turn to
the great 'voids,' we must place our attention briefly on our
Milky Way galaxy zone of avoidance (ZoA, a dark zone see image
immediately above) which is a region where our surveys of
structure in the Universe are not visible because of optical
extinction from peering through our own galaxy. In late 2022,
a discovery has been made which reveals structure within that
ZoA. Galdeano et al. (2022) published, "Unveiling a
new extragalactic structure hidden by the Milky Way" (https://arxiv.org/pdf/2210.16332.pdf).
Newly discovered galaxy cluster in our Milky
Way galactic zone of avoidance, VVVGCl-B J181435-381432.
Although the newly-discovered galaxy
cluster, VVVGCl-B J181435-381432, at z = 0.225 ±
0.014, in our galactic ZOA, is modest compared to the
massive and vast extragalactic structures we've been
considering, it is another glimpse to where we've not seen
before, a continuation of the quest behind human
cosmology-making, to peer where no one has peered before.
Now, we can direct ourselves back to the vast 'voids'
observed in the Universe.
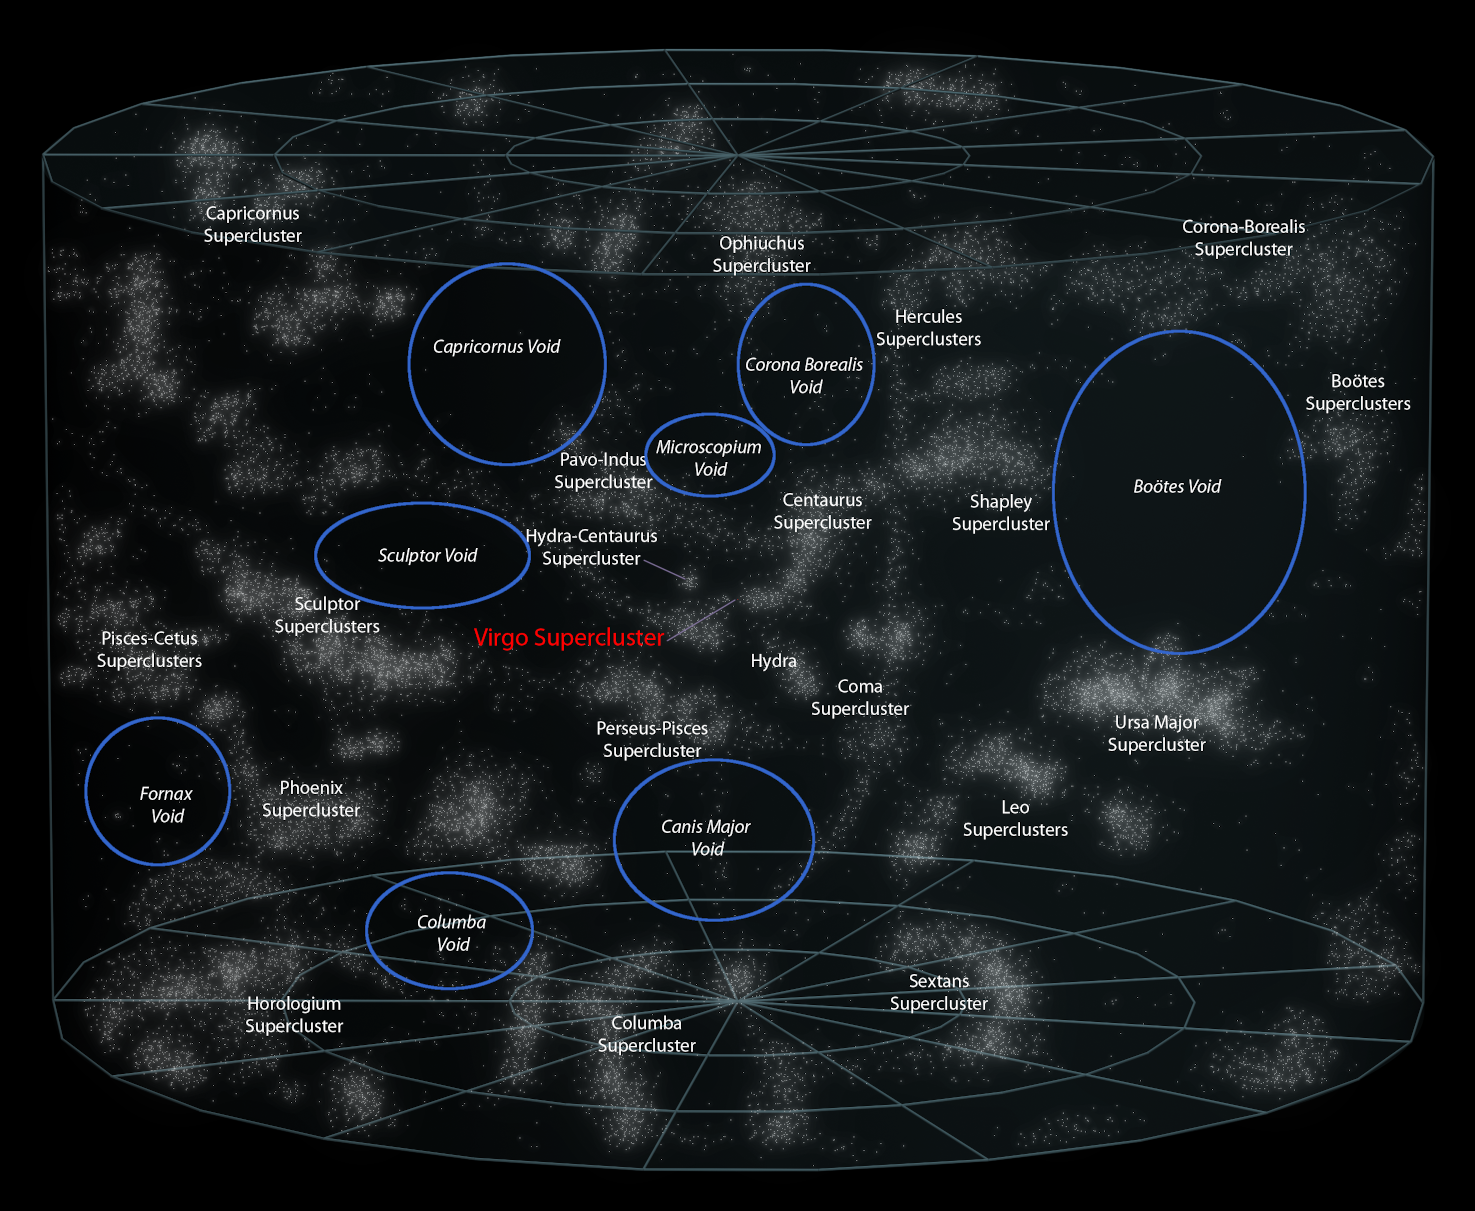
Map of some of the well-characterized intergalactic voids and
their boundedness by superclusters of galaxies (List of
Voids).
In
fact, we now realize that we live in a "local void" out to
about ~200 Mpc (~652 Mly). Wong et al. (2022. The
Local Hole: A galaxy under-density covering 90% of sky to ≈
200 Mpc. MNRAS 511 (4), 5742. https://doi.org/10.48550/arXiv.2107.08505,
version 5 in arXiv: https://doi.org/10.1093/mnras/stac396)
have shown that in this local hole, there is an
under-density of galaxies at about ~22% by two different
estimates.
This is in tension with the
homogeneity predictions of the ΛCDM cosmology by about ≈
3𝜎. Since the Local Hole is out to about 200 Mpc, it is
worth observing that the diameter of the Local Hole is ~400
Mpc (~1.31 Gly), again above the predicted ΛCDM upper limit.
These giant voids are like
spherical like cosmic 'soap bubbles' with galaxies on their
surfaces. These intergalactic voids have a wide range of
diameters. Centered about 75 million light-years from us,
the Local Void centered is about 150 million light-years
across, about half the diameter of another cosmic void. Another cosmic void discovered in
1981 is the Boötes Void or the 'Great Void' which is about
300 million light-years across, and it's center at z
= 0.052 or about 700 million light-years away (Richard
Powell, NASA; https://www.flickr.com/photos/nasablueshift/9402300439/):
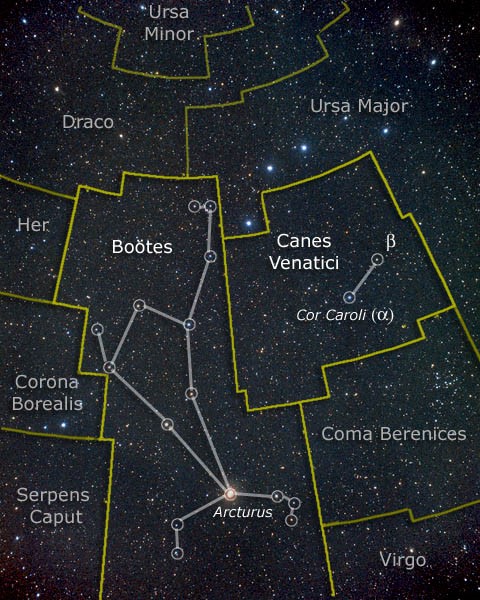
Big
as it is, the 'Great Void' is dwarfed by even larger voids, such
as the 'Giant Void' in Canes Venatici which is 1-1.3 billion
light-years across (http://cosmologyscience.com/cosblog/gigantic-voids-are-expanding-and-shrinking/#more-6920).
Canes Venatici, a constellation with the
'Giant Void' is in angular proximity to the 'Great Void' in
the constellation of the Boötes the Herdsman:
Canes
Venatici (above pictured
in the Hevelius' Atlas Coelestis, 1690; note
the inverted "god's eye view" of the celestial
cartographer, as if viewing the constellations from
outside the 'celestial sphere') contains the Giant
Void, 1-1.3 billion light-years in diameter. It is in
angular proximity to the constellation Boötes, which
includes the smaller 250-330 million light-year 'Great
Void.'
|
|
The 'Giant Void' or Canes Venatici
supervoid
The 'Giant Void' of Canes Venatici (http://tothelandofdreams.blogspot.com/2016/07/canes-venatici.html).
Large-scale
structure & the CMB. Radio astronomers (NRAO Very
Large Array) a few years ago discovered a large nearly
billion light-year in diameter cosmic void revealed through
a paucity of radio sources in a 1 degree region of the sky,
which also not surprisingly (if one questions the Big Bang)
corresponds with a temperature dip in the CMB of the WMAP
data. (Rudnick et al. 2007; https://arxiv.org/abs/0704.0908).
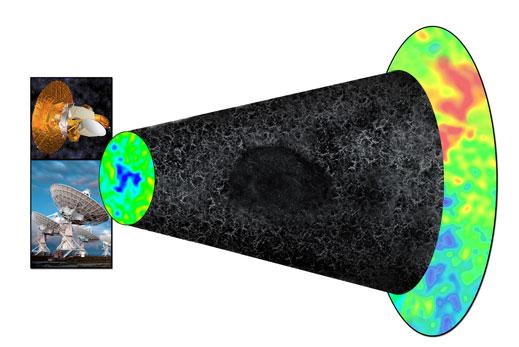
(Rudnick
et al. 2007)
(Szapudi et al. 2015)
|
According to the hot Big Bang
cosmologies, the CMB fluctuations are supposed
to represent primordial fluctuations in the very
radiation background which is supposed to be the
clinching data set / primordial 'dying echo' for
the Big Bang & specifically not something as
'mundane' as variations because of the large
scale structure of matter.
A series of papers
attempted to come to terms with the possible
correlation between a large cosmic galactic void
near the last surface of scattering in the
direction of the sky and the CMB 'cold spot.' The
danger to the Big Bang cosmology is that
one might recognize the CMB
temperature fluctuations to be linked
causally to the surrounding large-scale
structure of the Universe—the most
parsimonious null hypothesis. However,
everything was done to avoid the obvious. Appeal
was made for corrections based on an integrated
Sachs-Wolfe (ISW) effect, which assumes that the
CMB is cosmological and that correction must be
made for intervening and local distribution of
matter since the last cosmic Thomson scattering
of the CMB photons.
- 1967: Sachs &
Wolfe, assuming simple Friedman-Lemaitre models,
the CMB as cosmological, non-curved (k =
0) space-time, and a q0 =
+1/2 (consistent with data at the time, although
we know today that q0 = ~ -1, as
long predicted by the CSSC!), calculated the
angular variations in the CMB arising from
"density fluctuations, rotational
perturbations, and gravitational waves"
expected in these carefully chosen FL models
(http://adsabs.harvard.edu/abs/1967ApJ...147...73S).
- 2006: Inoue &
Silks argued that local voids could cause
large-angle CMB anomalies by using an adjusted
ISW effect (between an "ordinary" and
"late-time" effect to accommodate q0
= ~ -1) in order to be consistent with the
ΛCDM
(accelerating cold dark matter version of the
Big Bang) model (https://arxiv.org/abs/astro-ph/0602478v2).
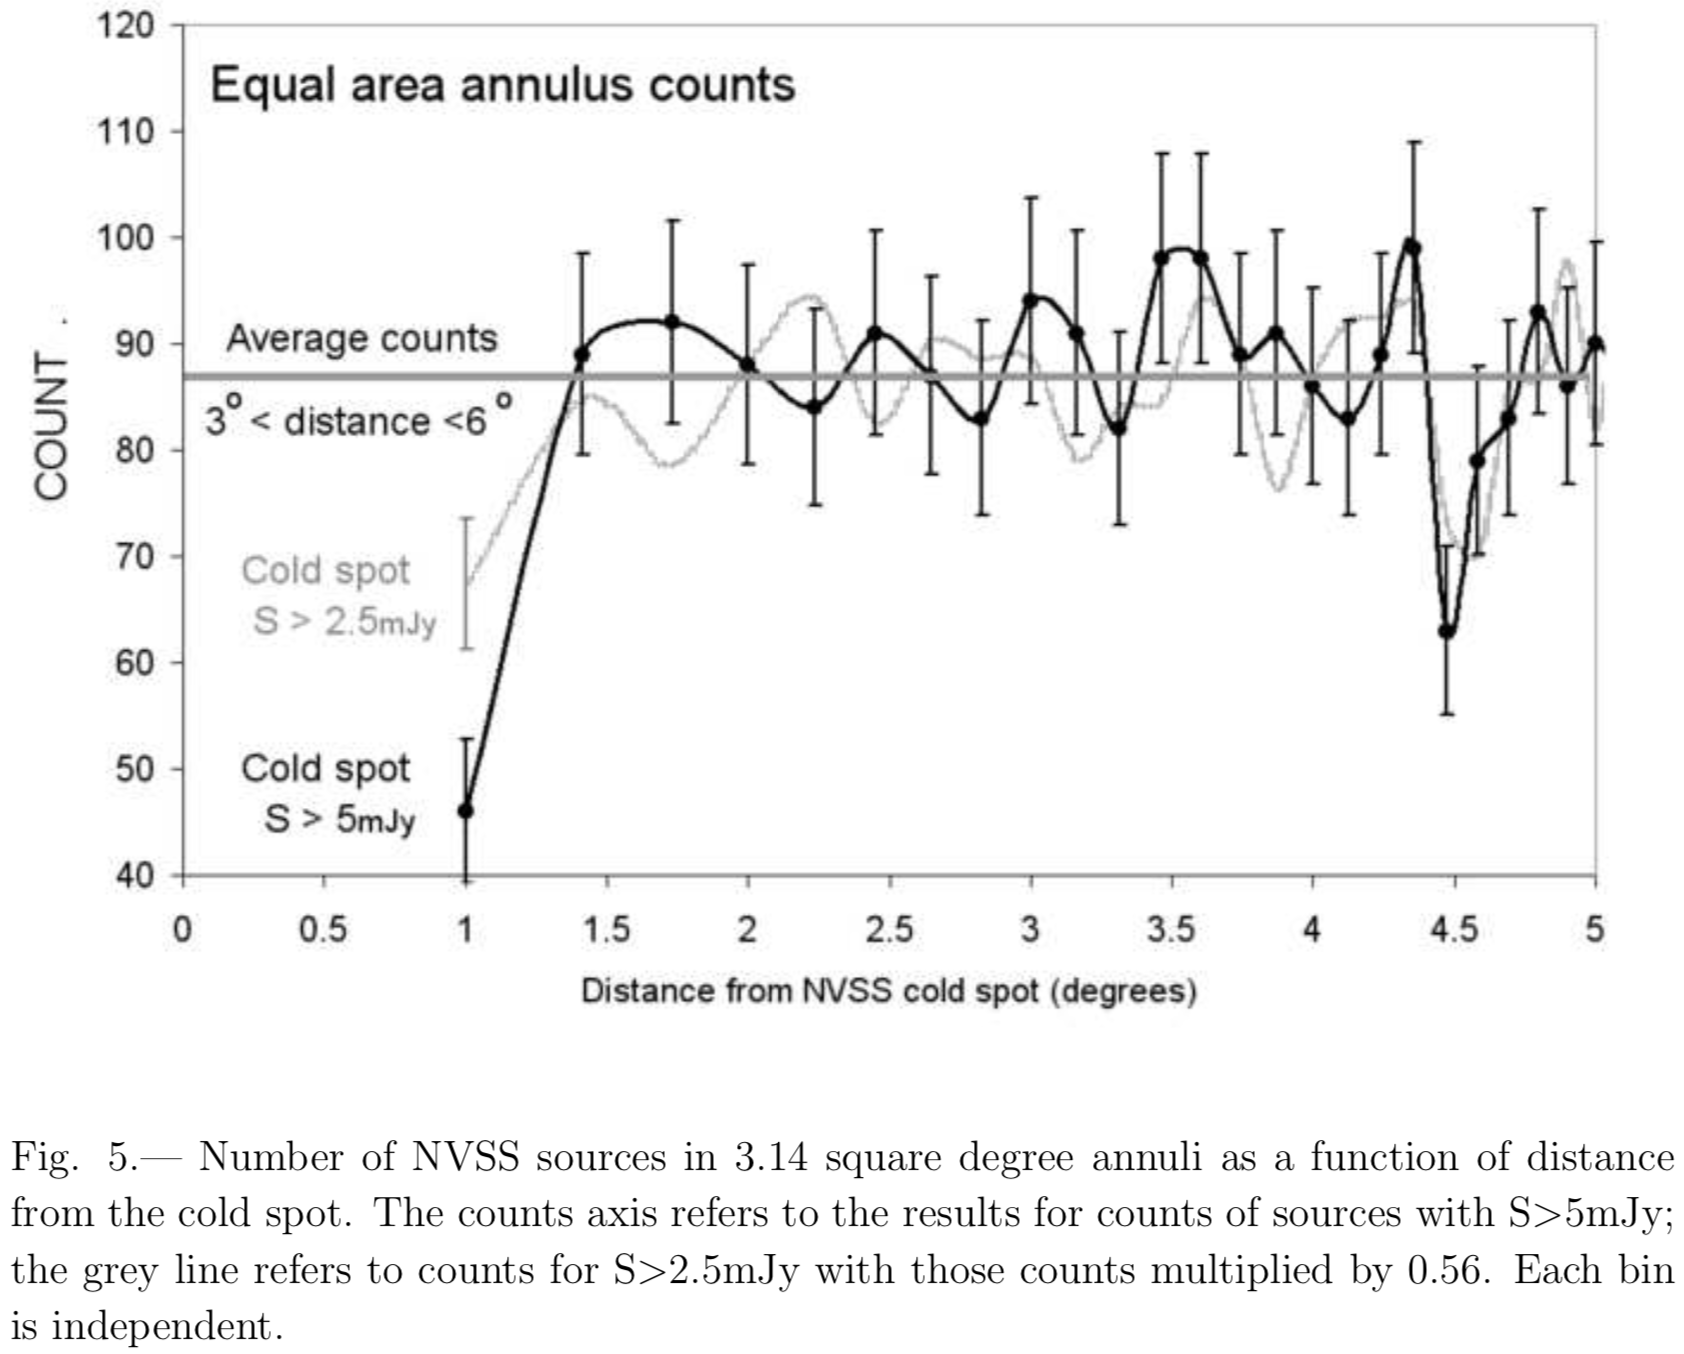
- 2007: Rudnick
et al. find a correspondence between
the CMB 'cold spot' and a drop / void in the
radio source count (https://arxiv.org/abs/0704.0908).
- 2007 (-2008, 2011,
2018): Smith* & Huterer, in a paper
curiously remaining in the preprint process
between 2007 and its final publication in
January of 2018, worked very hard using various
a posteriori selection cuts, flux
smoothing procedures, and statistical
re-analyses to show that there is no
corresponding dip in radio sources associated
with the CMB 'cold spot' and surprisingly
frankly acknowledged their motivating concern:
"Such matching cold spots would be difficult if
not impossible to explain in the standard ΛCDM cosmological model." (Please just make it go
away!!). Not surprisingly, data are sparse in
their paper. In their conclusion, they wrote:
"Despite the null result of this paper, one
should not be disheartened. More detailed
observation of the cold spot region in galaxy
surveys will likely improve confidence about the
existence of any over/underdensity or lack
thereof" (https://arxiv.org/abs/0805.2751).
Although delayed until 2018, this paper
curiously makes no reference to the Planck 2013
re-mapping of the CMB.
- 2015: In a
data-rich paper Szapudi et al. showed
through very careful z-binned data and
analysis that there is indeed a galactic
supervoid about 1.8 billion light-years across
coincident with the CMB 'cold spot.' The group
suggested further research but were very careful
to include, "Such a supervoid, constituting at
least a ≃ 3.3σ fluctuation in a Gaussian
distribution of the ΛCDM model, is a plausible
cause for the Cold Spot" (https://arxiv.org/abs/1405.1566).
- 2016: Nadathur
& Crittendon applied "a matched-filter
approach" to detect an ISW "imprint of cosmic
superstructures" (https://arxiv.org/abs/1608.08638).
- Throughout and
especially lately, some ΛCDM adherents have also
sought for exotic explanations for the
troublesome 'cold spot' through appeals to
possible parallel universe, such as a quantum
entanglement of our universe with another during
the 'inflationary epoch.'
|
*Ironically, Smith is affiliated with the
Institute of Astronomy at Cambridge, originally established as
the Institute for Theoretical Astronomy in a more open-minded
time and philosophical frame by Sir Fred Hoyle.
In the popular
write-up about the Szapudi et al. (2015) paper, Vox
stated that "fewer galaxies" are only "a partial
explanation" for the 'cold spot' in the CMB. In their
publicity figure (below) from the ESA Planck Collaboration,
"corrections" and accounting for astronomical structures on
the CMB is blindingly obvious, even structures as local as
the Andromeda Galaxy and our Moon. The CMB would be taken by
scientists for what it is phenomenologically, a
straightforward scattering and thermalization of radiation
by matter from local and large-scale astronomical
structures distributed throughout the Universe, if it
were not supposed to continue to play the role of the master
linchpin and Gaussian remnant of a "primordial fireball" in
the modified ΛCDM Big Bang cosmology. Instead the CMB is
an endless theoretical 'thorn in the flesh' of the Big
Bang establishment, requiring endless specialized
corrections, parameter adjustments, filtering,
smoothing, and scrubbing of it's data. The ancient
Pythogoreans trying to conceal the 'appalling' existence
of irrational and transcendental numbers would have been
proud, as would any of the pious protectors and
defenders of the Old Ptolemaic system against the
Copernican Revolution.
The empirical data indicate strongly
that the inhomogeneities and anisotropies of the CMB are
determined in a major way by intervening large scale
structures in the Universe, rather than some supposed
primordial conditions at ~340,000 years post-Bang.
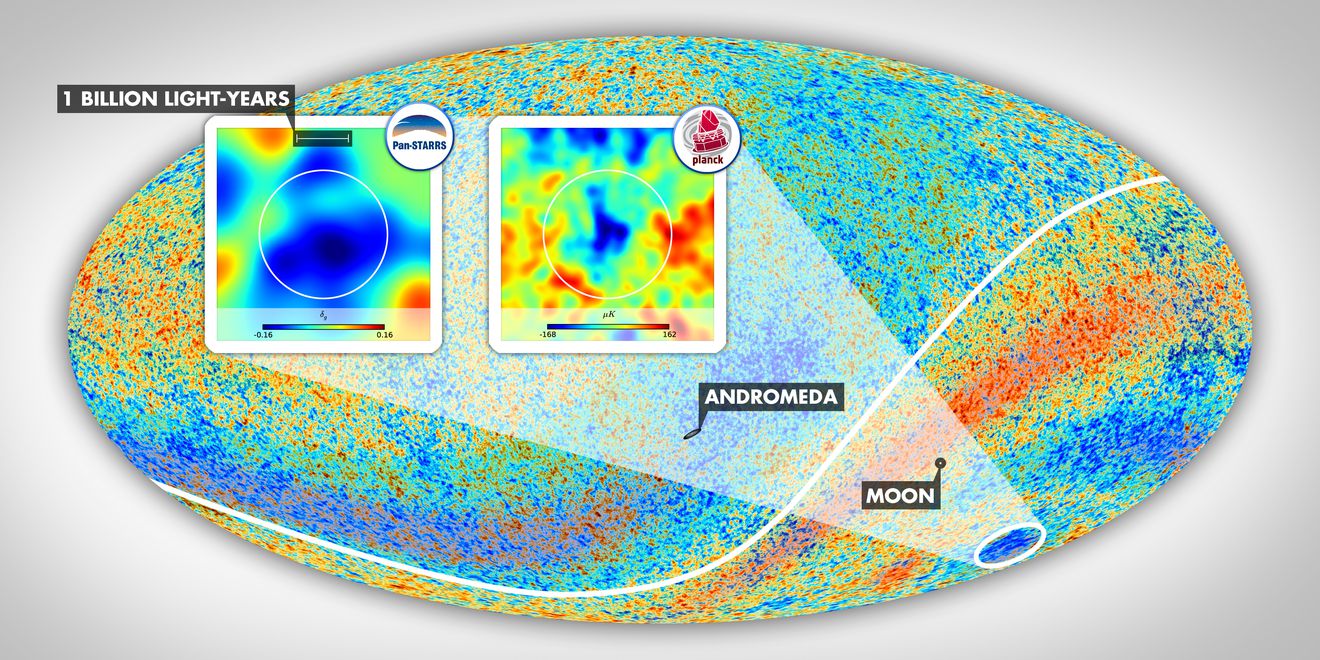 Image: ESA Planck Collaboration (https://www.vox.com/2015/4/21/8461329/supervoid-cold-spot).
Peculiar non-Hubble flows of
galaxies, such as the galaxies (including our own
falling toward the Great Attractor centered in
Centaurus) and the likely effects of intervening
galactic groups have never been accurately
assessed for their effect on the CMB (https://giphy.com/gifs/galaxy-Znl8ETAk6iY9i,
cf. https://imgur.com/gallery/1ioCq;
http://www.atnf.csiro.au/people/mcalabre/animations/index.html).
We develop in
greater detail issues related to questions about the CMB in
our section, "The Cosmic
Microwave Background (CMB) radiation: From Where and
Whence?"
On cosmic voids and supervoids, an
interesting study from Argentina's National University of
about 245 cosmic voids discovered through the Sloan
Digital Sky Surveys (http://www.sdss.org/surveys/)
that these cosmic voids were changing in size and had
specific velocities 300-400 km/sec faster than indicated
by red-shifts of the galaxies surrounding them (Lambas et
al. 2015, https://arxiv.org/abs/1510.00712,
Lambas et al. 2016. The sparkling Universe: the
coherent motions of cosmic voids. MNRAS Letters, 455
(1), L99. https://doi.org/10.1093/mnrasl/slv151.
cf. discussion by Cowen, Nature 2015, https://www.nature.com/news/vast-cosmic-voids-merge-like-soap-bubbles-1.18583;
http://cosmologyscience.com/cosblog/gigantic-voids-are-expanding-and-shrinking/#more-6920).
Attempts to explain these goings on within Big Bang
cosmology require the conjuring up of further ad hoc
adjustments appealing to "dark matter" and "dark energy"
mechanisms. If one lets the Big Bang go, much less ad
hoc and more organic, empirical models of our
Universe are possible.
Furthermore, large-scale intergalactic
structures of intergalactic neutral hydrogen gas clouds
are found intervening between Earth and a distant quasar
at a red-shift of z = 3.62, revealed by spectral
forest of emission and absorption lines. Naturally arising
in the Classic Steady State Cosmology (CSSC) such
intergalactic hydrogen is predicted by a negative scalar C-field
hadron creation mechanism, whether in the classic or quasi
Steady State cosmologies. And of course, other cosmologies
are possible models too.
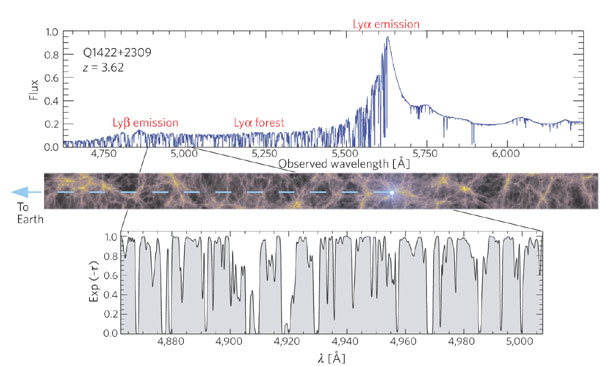
Top: A typical high-resolution spectrum of
a quasar Q1422+2309 at redshift z = 3.62. At the
spectral shorter wavelengths of the redshifted Lyman
emission line at 1216(1 + z) Angstroms, the spectrum
shows a 'forest' of absorption lines of different strength
produced by intervening neutral hydrogen gas (not consistent
with electrical plasma type models) along the line-of-sight
from the quasar to the Earth. Bottom: Hydrodynamical
simulations reproduce a segment of the observed absorption
spectra, corresponding to intervening. Middle panel: An
example of the gas distribution in a simulated,
highly-parameter-adjusted ΛCDM model (Springel et al. 2006).
Another
extremely high redshift (pre-JWST) quasar (z = 6.53)
with its Lyman-α forest of emission and absorption spectral
lines has also been spotted in the accumulating DESI survey
(2022). Notice that this quasar which is thought to be close
to 13 Gly away is found in a far distant field of galaxies
with a full range of galactic stellar ages, as would be
expected in an older, vaster Universe.
Empirical thought: Of course
none of this ad hoc
curve-fitting is required if one does not insist on the
young Big Bang model but allows the Universe to be as old
and as vast as it is increasingly, empirically shown to be,
and modeled through a more empirically-based theoretical
framework.
Combined large-structure galactic
redshift surveys across different sections of the
skies compared with the Millennium simulation
(Springel et al.
2006). 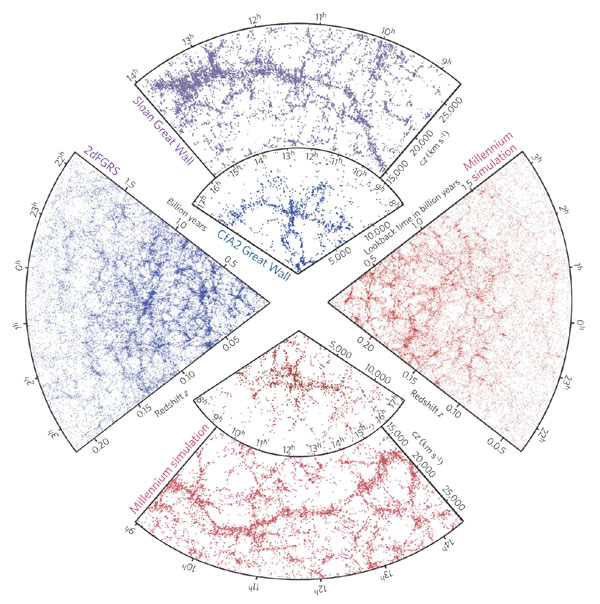
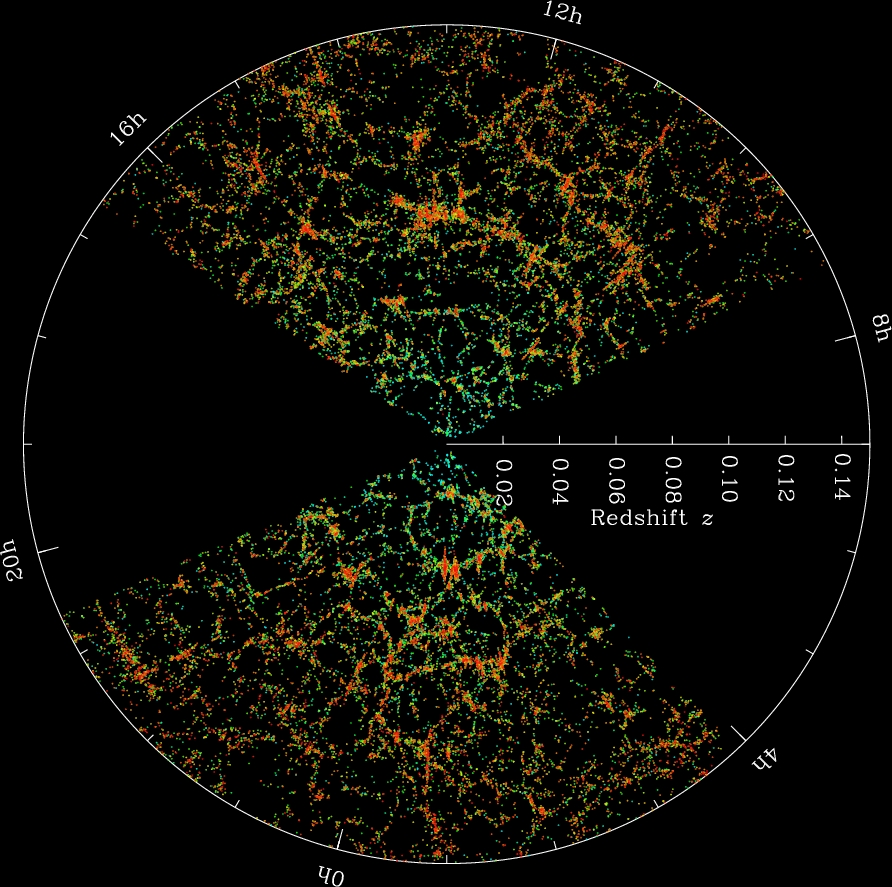
The Sloan Digital Sky Survey map of galactic
redshifts: "Slices through the SDSS 3-dimensional map of the
distribution of galaxies. Earth is at the center, and each point
represents a galaxy, typically containing about 100 billion
stars. Galaxies are colored according to the ages of their
stars, with the redder, more strongly clustered points showing
galaxies that are made of older stars. The outer circle is at a
distance of two billion light years. The region between the
wedges was not mapped by the SDSS because dust in our own Galaxy
obscures the view of the distant universe in these directions.
Both slices contain all galaxies within -1.25 and 1.25 degrees
declination. Credit: M. Blanton and the Sloan Digital Sky
Survey" (http://www.sdss.org/includes/sideimages/sdss_pie2.html).
Even
in
this
corrected
composite image, the 'fingers of god' effect is present (for
explanation see below).
II. The question of
Isotropy: Departures from concordance isotropy. One
of the pillars of the ΛCDM cosmology since 1998 has been
that the Λ term describes a cosmos born from the Big Bang
primordial fireball and exhibiting accelerating expansion because of "dark energy." What
happens then when the acceleration observed in the
Universe is anisotropic? That would mean that assumptions
in the prevailing ΛCDM concordance
cosmology are being violated. Well, a paper published by
Colin et al. (2019. Evidence for anisotropy of
cosmic acceleration. A&A 631, L13. https://arxiv.org/abs/1808.04597;
https://doi.org/10.1051/0004-6361/201936373) shows just such a
finding.
Using the then most
up-to-date publicly available cohort of SNe Ia light-curve
properties and angular locations: the SDSS-II/SNLS3 JLA
catalogue, which comprised 740 spectroscopically confirmed
SNe Ia, including some in the z < 0.1 range,
three seasons of SDSS-II (0.05 < z < 0.4)
data, and three years of SNLS (0.2 < z < 1)
data, building on the work of earlier studies, Collins et al. conclude,
after the necessary corrections for co-moving reference
frames and various statistical tests, that there are
evidences of a peculiar velocity local "bulk flow" that
likely extends well beyond the assumed needed corrections
out to z ~ 0.1, and includes most of the SN Ia
cohort in the study, rather than assuming as is usually done
that the "bulk flow" suddenly stops about this z-value.
They had to account for the monopole (qm)
and dipole (qd) modulating components of
the deceleration parameter (q) and found that the SN Ia dipole is congruent with the CMB frame.
They found that they could calculate the luminosity
distance (dL) of the SNe Ia data set
just as accurately calculated using a Taylor series
expansion without any model assumptions, independent of any
of the ΛCDM model
parameter fitting of matter density (ΩM), cosmological
constant (ΩΛ),
or curvature densities (Ωk)
in critical density units, as well as assuming H0 = 100h km s−1
Mpc−1
. The SNe Ia light curves may be sample or
redshift-dependent, which undermines, the authors say, their
utility as standard candles as part of a cosmological
distance ladder. Maximum likelihood estimator (MLE) tests
confirmed that the best fit to data rejects isotropy (qd
= 0) by a hugely significant 3.9σ and is congruent with no
acceleration at all (qm
= 0) at a significance of 1.4σ. The
separation between the CMB 'kinematic' dipole and the SNe Ia
acceleration dipole indicates that our view is at the least
not large enough to be representative or Copernican, and
that we have a 'tilted' view of the Universe, hence the
anisotropy, the authors argue. In sum, not only are (a) SN
Ia more questionable as distance estimators, (b) the data
sets, monopole and dipole corrected, are consistent with no
acceleration, and (c) these data strongly suggest that FLRW
isotropy is violated, against the requirements of the
ΛCDM HBB cosmology.
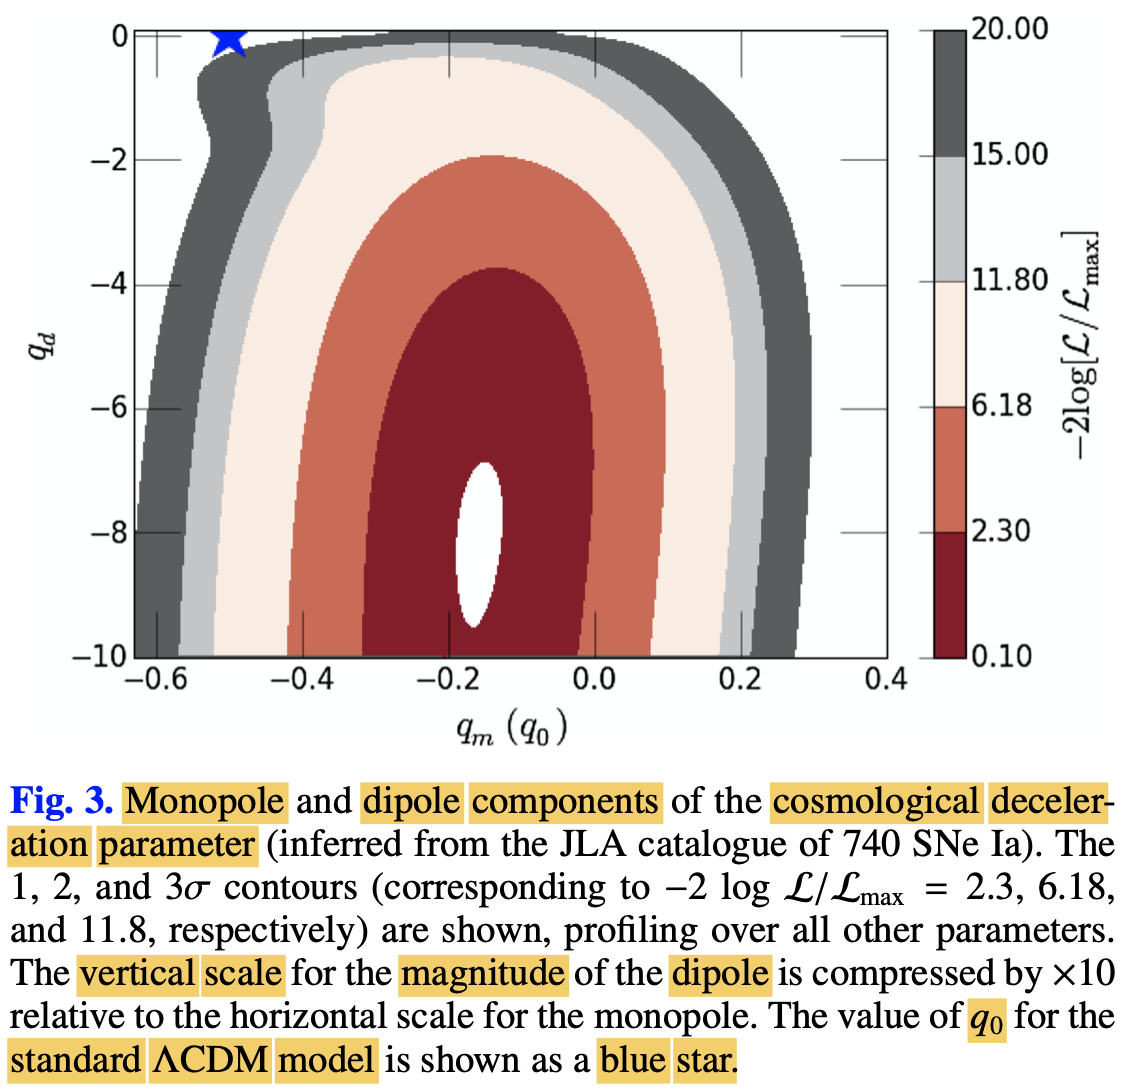
In another even more elegant paper, the
same research group also published their proposed
anisotropy test, the data, and the implications in the
case of a flux-limited sample from across all the sky of
~1.36 million quasars measured by the Wide-field
Infrared Survey Explorer (WISE) by deep photometric
assays at 3.4 and 4.6 μm (Secrest et al.
2021. A test of the Cosmological Principle with quasars.
ApJ Letters, 908, L51. https://doi.org/10.3847/2041-8213/abdd40),
in a sample from the CatWISE2020 catalog, as well as
data from other radio surveys
. A dipole in the CMB is expected because of the Sun's
heliocentric rest frame motion against the isotropic CMB, and
is called the kinematic dipole, usually attributed to our
system's motion in local inhomogeneity toward the 'great
attractor,' although there is play of factors allowed in the
Planck CMB measurements. Using the ΛCDM model
concordance model, the authors point out the very specific
prediction. Beyond the local inhomogeneities, the Universe at
larger scales >~100 Mpc (~326 Mly) should be "sensibly
homogenous" because of ΛCDM structure formation
(although known to be violated), the reference frame of matter
dipole should converge in direction and amplitude aligning
with the CMB dipole, because of Doppler shift effects and
special relativistic aberration. The authors state that they
are running an independent data test of the 'cosmological
principle' and the standard cosmology, using their selected
CatWISE quasar data set. In their detailed Methods, they
describe their selected zones of the sky for the test with
respect to our Milky Way galactic coordinates.
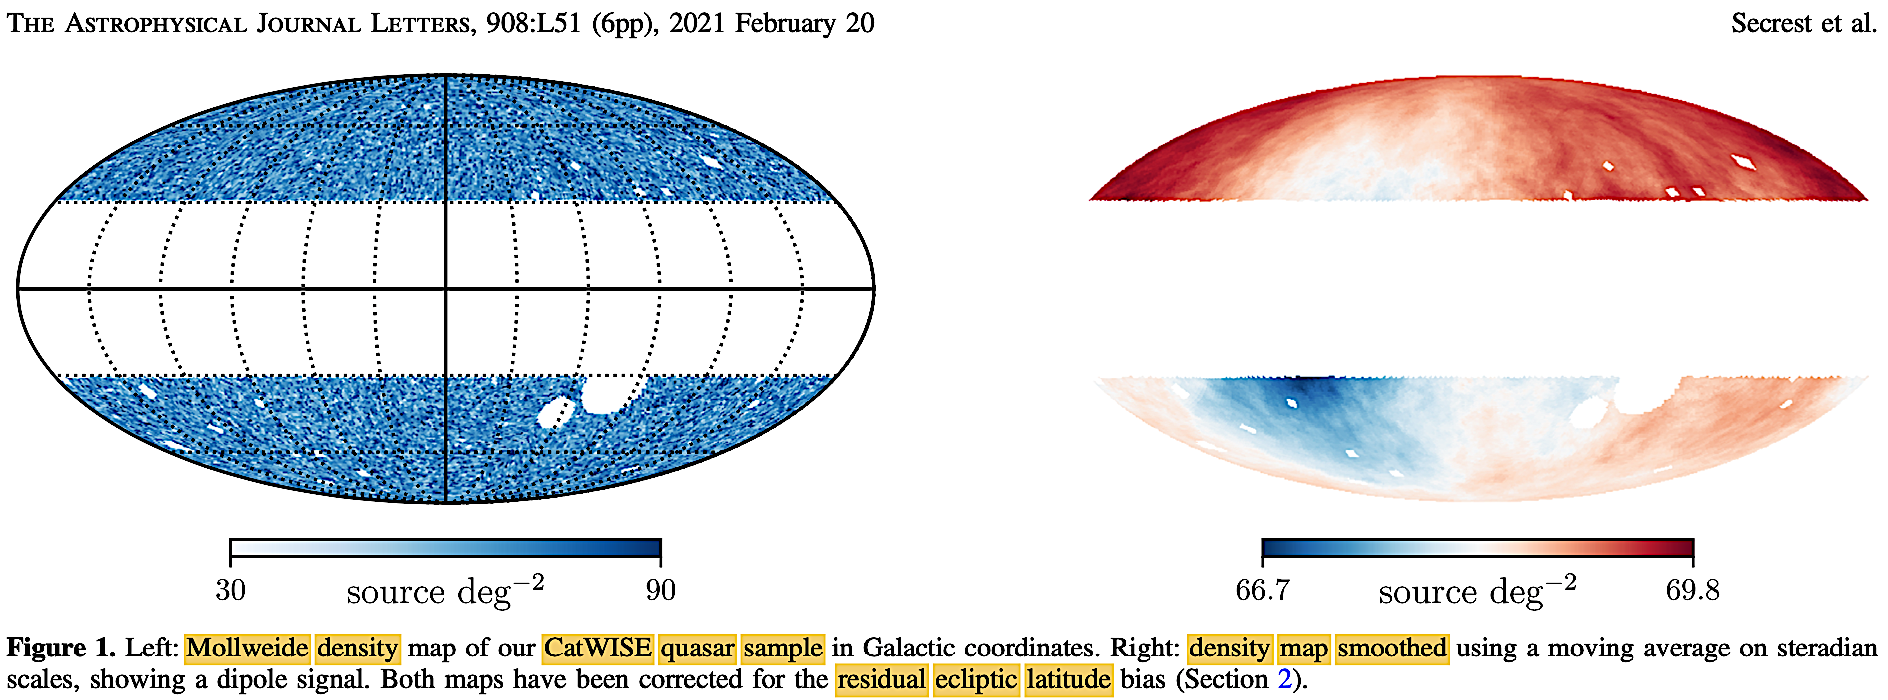
They point out that
this 'cosmological principle' test for distant matter and the
CMB dipole convergence was first proposed by Ellis &
Baldwin (1984. On the expected anisotropy of radio
source counts. MNRAS 206 (2), 377. https://doi.org/10.1093/mnras/206.2.377).
Assumption of convergence "underpins modern cosmology," they
note because the SNe Ia data are routinely transformed into
the CMB rest frame in order to assay the (isotropic)
acceleration of the Hubble expansion. Their results are
graphically summarized in this color-inverted version of their
Figure 4:
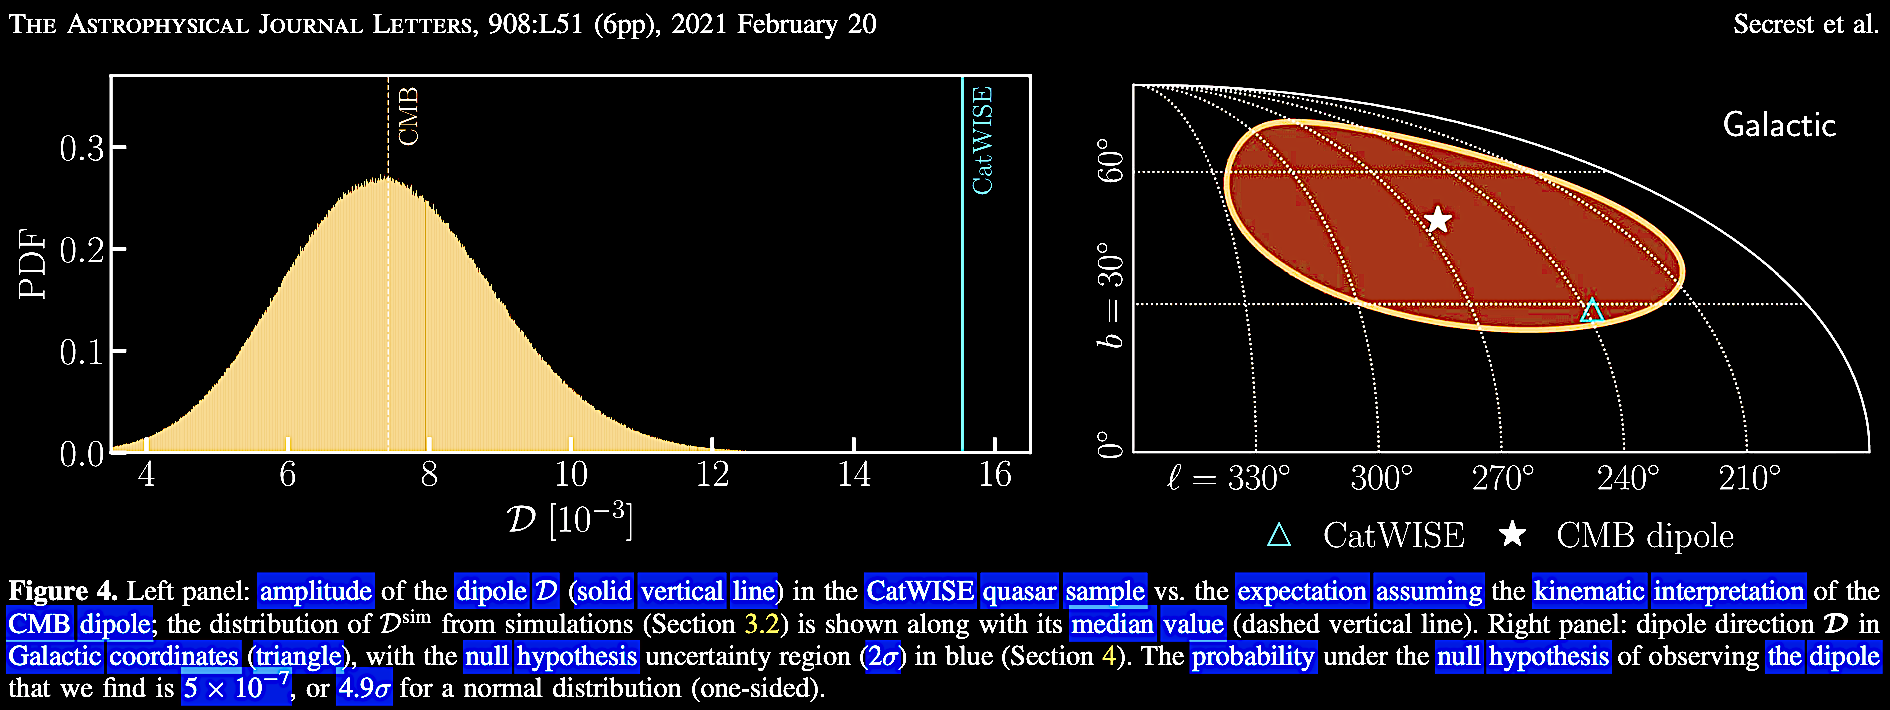
The null hypothesis 2σ uncertainty
region is marked above right in red, the inverted negative of
the blue, cited in the Fig. 4b legend.
What they found
that althought the quasar data set dipole was in the same
general direction as the CMB dipole, While the direction of
the dipole in the quasar sky is similar to that of the cosmic
microwave background (CMB), "its amplitude is over twice as
large as expected, rejecting the canonical, exclusively
kinematic interpretation of the CMB dipole with a p-value
of 5 x 10⁻⁷ (4.9σ
for a normal distribution, one-sided), the highest
significance achieved to date in such studies. Our results
are in conflict with the cosmological principle, a
foundational assumption of the concordance ΛCDM model"
(emphasis added). Citing Ellis & Baldwin (1984), Secrest et
al. (2021) conclude that "a serious disagreement between
the standards of rest defined by distant quasars and the CMB
may require abandoning the standard FLRW cosmology itself. The
importance of the test we have carried out can thus not be
overstated." Spot on! In fact though, Ellis & Baldwin
(1984) went farther than Secrest et al. (2021). In
asserting the test, they in fact in 1984 stated, that if the
resting frames of reference for the CMB and the number of
radio source counts were in serious disagreement, we'd have to
abandon either of the following:
- (a) the hypothesis that the
radio sources are at cosmological (H0)
distances,
- (b) that the CMB is a relic
radiation of the Big Bang, or
- (c) the standard F[L]RW
cosmological models.
Thus with this
study and others, the emerging data strongly suggest that both the homogeneity and the isotropy assumptions
of the Cosmological Principle (CP) as
needed for the FLRW metric of the HBBC ΛCDM model
of cosmology are deeply violated by those very
accumulating data. We expect that the coming research will
reveal further such violations as the prevailing New
Ptolemaic paradigm continues to face its Kuhnian crisis.
Any paradigmatic theory still worth its scientific salt
should be making ongoing successful predictions about the
World. The standard HBBC ΛCDM concordance cosmology is no longer
making successful predictions, and continuously
requires various and looming epicycles to even
attempt to keep up with the growing data, and to
fail at doing so. A new fruitful, predictive
cosmology is needed. We turn next to a 102 page
review of the situation, which asks many of the
right questions.
Are the
homogeneity and isotropy assumptions behind
the HBBC ΛCDM
model even met? Is the
Cosmological Principle (CP)
foundation of modern standard
cosmology sound?
In 2022, a collaboration,
including Alexia Lopez, submitted a
massive review paper on the issue of
observational violations of the
Cosmological Principle (CP) in the
predicted spacetime metric of the
Friedmann-Lemaître-Robertson-Walker (FLRW)
cosmologies and whether the anomalies have
accumulated to the point where the FLRW
cosmologies in their currently-favored ΛCDM
model has been outgrown by
cosmology:
Aluri, P. K. et al. 2022 (arXiv: https://arxiv.org/abs/2207.05765,
four versions). 2023. Is the observable
Universe consistent with the Cosmological
Principle? Class. Quantum Grav. 40,
094001. 103 pp. https://doi.org/10.1088/1361-6382/acbefc.
We cite the reviewers' state of the
Cosmological Principle, with some added
clarification: "The cosmological principle
(CP) is a working assumption in modern
cosmology that can be simply stated as the
Universe is (statistically) isotropic
and homogeneous at suitably large scales"
(emphasis theirs), to which we
qualify for clarity that statistically
means what is observed at representative
scale for any observer in the Universe,
meaning our vantage point is not special
but typical.
How important are the assumptions of
homogeneity and isotropy at representative
scale in the FLRW cosmologies? The
reviewers point out the criticality of
these assumptions which are required to
solve the equations of general relativity,
and "once the FLRW symmetries are imposed
and the energy-momentum tensor associated
with a homogeneous and isotropic cosmic
perfect fluid specified, the Friedmann
equations reduce to a first order ordinary
differential equation with a unique
integration constant, namely the Hubble
constant H0. As a
result, within the FLRW paradigm, H0
is a universal constant parameter in any
FLRW cosmological model." That is, these
assumptions which comprise the CP are
indispensable in FLRW HBB cosmology. One
of the Bianchi-type cosmoses would be one
where the homogeneity assumption is met
but not the isotropy assumption, and no
one is yet stating that we are compelled
by the data to postulate such a cosmic
model.
Since in the FLRW model, the H0
is a universal
constant in a
spherical time-space
slice
homogenous-isotropic
cosmos, the 'Hubble
tension' is the
beginning of sorrows
for standard
cosmology on the
issue of the CP
assumption (which we
have reviewed in ch.
VII. Unexpected galactic Redshifts), and
furthermore,
which the JWST
data has not
alleviated but
actually
aggravated for
the standard
model. The
reviewers
emphatically
state, "the
discrepancy
between local
determinations
(measurements)
based on
Cepheids and
Type Ia
supernovae (SNe)
(H0
= (73.04 ± 1.04)
kms−1
/ Mpc) and
Planck’s
analysis of the
CMB based on the
ΛCDM model (H0
= (67.36 ± 0.54)
km s−1 /
Mpc) has now
reached a
discrepancy of
5σ." What they
don't state is
that this result
calls into
question the
very central
notion of the
primordiality of
the CMB, a
sacred cow in
standard HBBC
cosmology. They
go on to state
on the question
of the isotrophy
assumption that
"Later we will
argue that this
actually extends
to orientations
on the sky, so
the Hubble
tension may be
a
three-dimensional
problem and
not a
one-dimensional
(redshift)
problem,
as is routinely
assumed." (emphasis
theirs).
This review highlighted key ares for
testing these cosmological assumptions:
- Homogeneity scale (the
scale at which large structures can form, which we have
been reviewing above) according to the flat ΛCDM model under N-body
simulations under Friedmann-Lemaître-Robertson-Walker
(FLRW) metric has a lower bound of 60–80 h−1
Mpc and an upper bound on the homogeneity
scale of 260 h−1 Mpc. Even as
early 1989, the Geller-Huchra 'the Great
Wall' with its size at 600 X 250 X 30 million light
years in size or ~200 Mpc, i.e., ~650 Mly. This
upper bound has long already been violated
by the Sloan Great Wall galaxy structure
with a scale of ~420 Mpc (see above), let
alone the original
Clowes-Campusano LQG (large quasar group)
at ~2
Gly in length and ~1 Gly in width, the
two QSO clusters at 350-400 Mpc
(~1.14 - ~1.3 Gly), the SDSS
DR7QSO group, the largest know of the
LQGs (large quasar groups), with
enormous dimensions of the Huge
Large Quasar Group (Huge-LQG)
at 1.24 Gpc (~4.04 Gly) long by 640
Mpc (~2.1 Gly) and 370 Mpc (~1.2 Gly),
the South Pole Wall at ~400 Mpc or ~1.31
Gly, or the possibility that the Shapley
Wall, the Great Attractor, South Pole Wall,
the Perseus-Pisces cluster and Lanakea are
all part of one giant structure. Then
there's Giant Arc at
~3.3 Gly across, and now the Giant
Ring / Corkscrew at ~1.3 Gly and a
circumference of ~4 Gly, which may be
actually both facets of an even more
gigantic structure at about ~9.2
Gly distant! And
that's not all, there is the gigantic ring-like
structure of gamma ray bursters
(GRBs) at about 1720 Mpc (~5.61
Gly) in size.
Above we also covered the pencil surveys
which revealed gigantic (running out of size
superlatives) repeating structures at ~/≥
3 Gpc in size or more (~/≥
9.8 Gly), and of course
the giant voids and chasms of low galaxy
occurrence which even affect the CMB,
inducing giant cold spots in the supposed
primordial surface of last scattering at
~380 years post-Big Bang. These are all
increasingly astounding violations of FLRW
expected homogeneity.
A few of the large-scale
structure violations of homogeneity scale reviewed in the
following figures from the Aluri et al. (2022; 2023)
review paper:
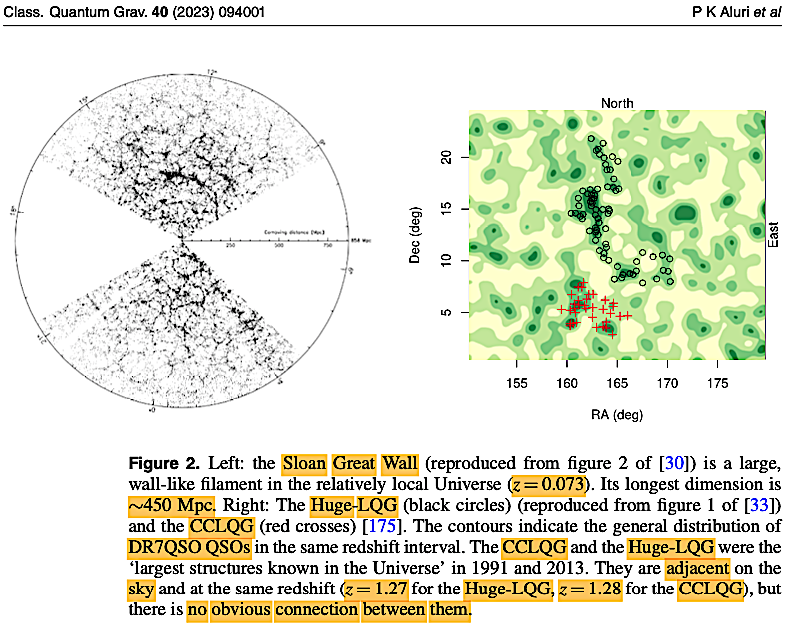
|
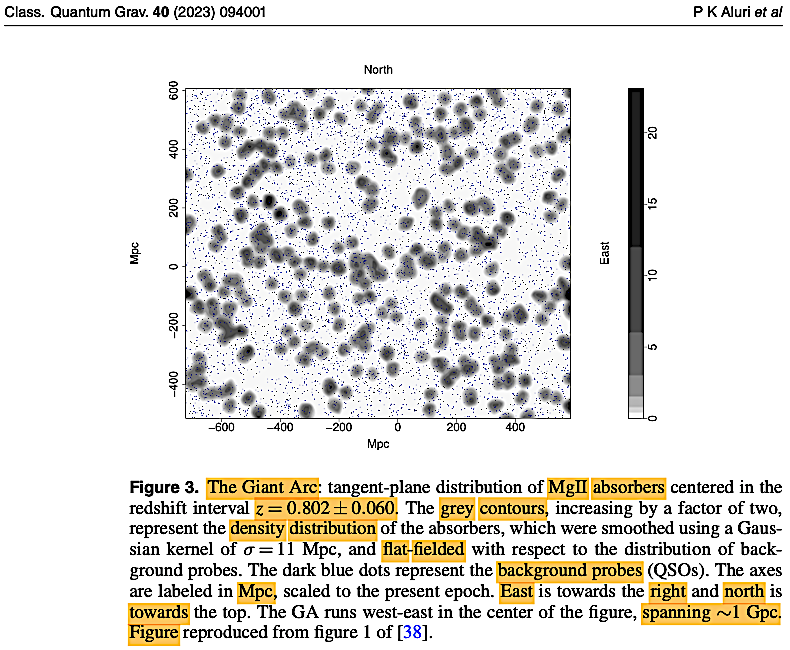
|
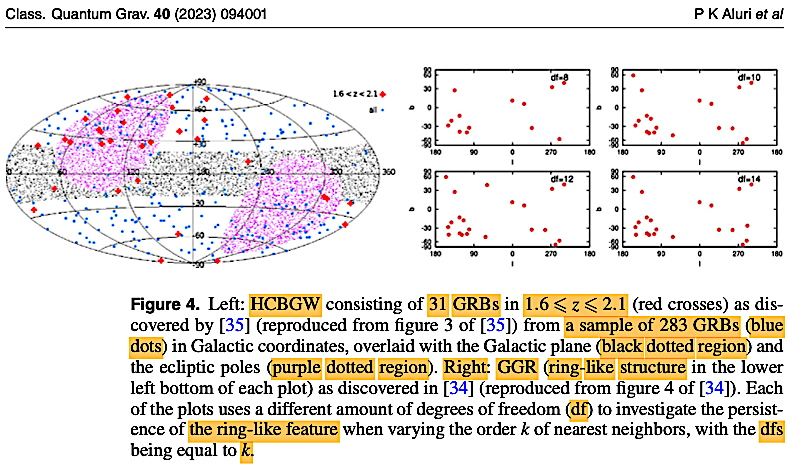
|
And
these cited examples do not include all the even
more amazing homogeneity violations we have explored
and summarized above.
However, the Aluri et al.
(2023) paper, figure 4 also raises the issue of
the isotropy assumptions of the FLRW.
The great astronomer Vera Rubin discerned (as
cited in the review) regarding the 1989 discovery
in CfA data of 'the Great Wall': "It certainly
has convinced me that we’re not living in a
homogeneous, isotropic [Universe]. I mean these
things that I really suspected in the back of my
mind, I can now say publicly. I’m not sure the
Robertson-Walker Universe exists." —Vera
Rubin on the 1989 discovery of the CfA Great Wall
(emphasis added). Her praiseworthy honesty
is refreshing.
Next we turn to the troubling prospect of an
anisotropic cosmos, as hinted in their Fig. 4 and
detailed in some of the studies we have cited
above.
|
- On the question of violations
of FLRW ΛCDM
expected
isotropy and of the Cosmological Principle
(CP), the reviewers in keeping with the FLRW
ΛCDM paradigm
have divided
their survey of challenging data in terms of
spherical time-slices required in an FLRW
metric solution between (a) the putative
early FLRW anomalies (such as anisotropic
cosmological parameters, topological
anomalies in the CMB, parity violation,
&c.) and (b) putative late FLRW
anomalies (like galaxy cluster anisotropies,
anomalous bulk flows of galaxies, radio,
QSO, and SNe Ia dipole anisotropies,
&c.). As can be seen from the figures,
there are multiple anisotropic anomalies in
violation of the CP in the FLRW ΛCDM paradigm
in their
following
Figure 1 and
its
corresponding
Table 1 where
they 'count
the ways' in
which isotropy
is violated.
The sheer
number and
variety of
anomalous
anisotropies
within the
FLRW metric
paradigm is
astounding,
both in
putative early
and late FLRW
anomalies.
This naturally
suggests that
it's indeed
time to
reexamine the
cosmological
models on
offer, and
search perhaps
for new ones.
In the
reviewers
discussion of
the various
anomalies,
they suggest
that there are
tensions with
the FLRW,
which may make
it less
precise than
desirable and
some anomalies
remain
unexplained.
They hope for
further
surveys of the
data. We may
return to more
of these
results later.
Suffice for
now to show
that tensions
exist and that
paradigms need
to be tested
further at the
least.
At this juncture, we will be augmenting our discussion with
the ballooning new JWST data on galaxies with even higher z
values, which are further illustrative of the same trends.
Within this next
section, we turn in brief to the issue of the connection
between galactic morphology and systematic effects in redshift
measurements, and to a possible explanation for the 'fingers
of god' effect.
The 'fingers of god' effect—A
systematic but morphological-selective bias
superimposed on the overall Hubble relation.
Also observable in the images above and below is the
so-called 'fingers of god' phenomena where galactic
redshifts are plotted as a function of distance (Hubble
relation) the computations yield an apparent situation where
large structures often point straight at earth! This
peculiar phenomenon has been interpreted in the orthodox
HBBC explanation as a bias created by the proper (nonradial)
motions within the galaxy cluster among the various galaxies
within the cluster. But this does not explain why there is a
bias in the redshift-related direction, and as we shall see
of galaxy classification type, creating the apparent but
spurious effect of trailing structures 'pointing' back to
the observer on earth.
The data
however indicate that on the average there seems to be a
component of the redshifts which are intrinsic to the
galaxy morphology type: Elliptical (E0-E7), spiral (S01-3,
Sa, Sb, Sc), and barred spiral (SB01-3,
SBa, SBb, SBc). The normal, more 'relaxed' spirals having
the lowest average redshift within a cluster, while the
more 'disturbed,' higher energy elliptical and barred
spiral galaxies have higher average redshifts. (This
anomalous intrinsic, excess redshift connected with smaller,
more energetic galaxies (AGNs) when interpreted as part of
the Hubble shift-distance relation, yield the purely
artifactual 'fingers of god' effect. This odd artefactuality
disappears when one recognizes the existence of an intrinsic
redshift component, which cannot be explained in the HBBC.
The large effect is also
visible in the Proust et al. (2006) survey. 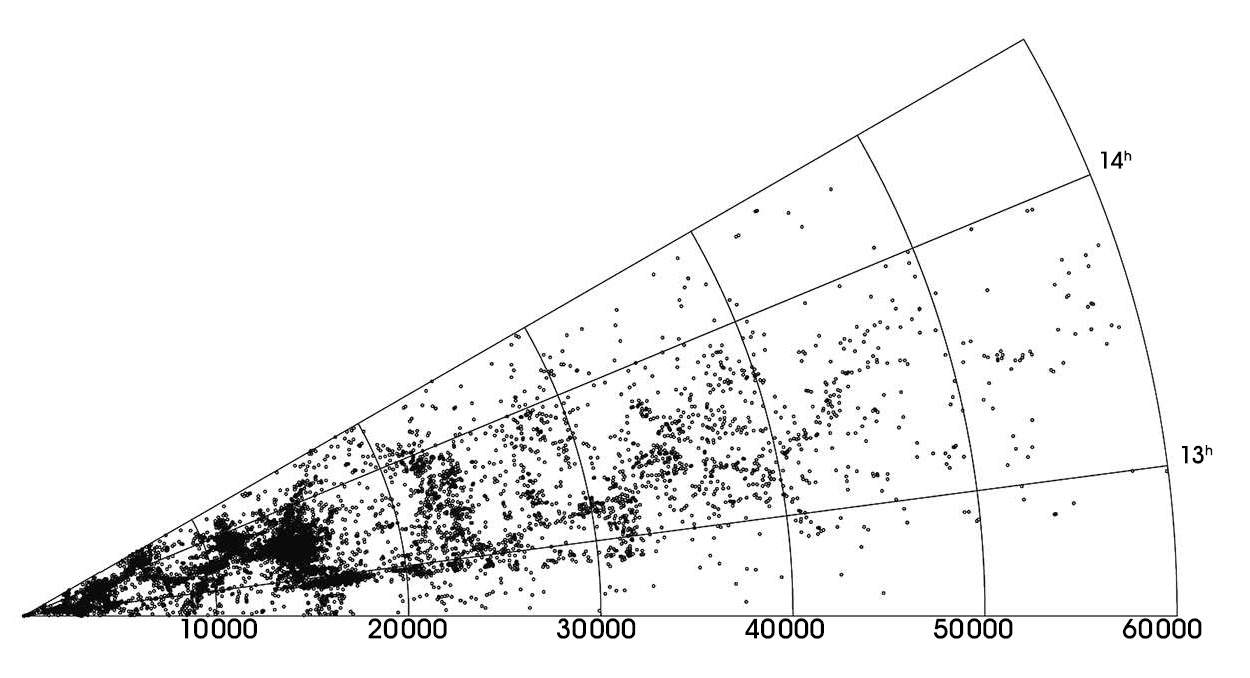
Even in the recent (2022) emerging DESI 3D
slice survey results (>5 Gly / 1500 Mpc), the huge
structures and the 'fingers of god' phenomena are
manifest popping into and out of view upon observation
of this animated cosmographic map:
 Even the caption on
this heavily processed animated .gif of the data accentuates
the HBBC model-dependent interpretation of this cosmographic
map, making no mention of the redshift peculiarities which
generate the visible 'fingers of god' effect, caused by the
added intrinsic redshift component, especially noticable
under 500 Mpc:
Even the caption on
this heavily processed animated .gif of the data accentuates
the HBBC model-dependent interpretation of this cosmographic
map, making no mention of the redshift peculiarities which
generate the visible 'fingers of god' effect, caused by the
added intrinsic redshift component, especially noticable
under 500 Mpc:
Such intrinsic
red-shift effects overlaid as they are on the general Hubble
relation are what are expected and predicted in quasi Steady
State cosmologies, where some fraction of the z-values
result from negative scalar c-field activations around heavy
gravitational centers resulting in novel baryonic matter
ejection understood within a Machian gravity framework, such
as proposed by Hoyle & Narlikar (1964). These features
find no explanation in the standard, or adjusted HBB
cosmologies. Later, we consider direct astronomical data of
such possible predicted new baryonic ejection events.
Hubble Galaxy Classification 'Tuning Fork'
diagram
Implications of classifications of galactic
evolution for cosmological model tests
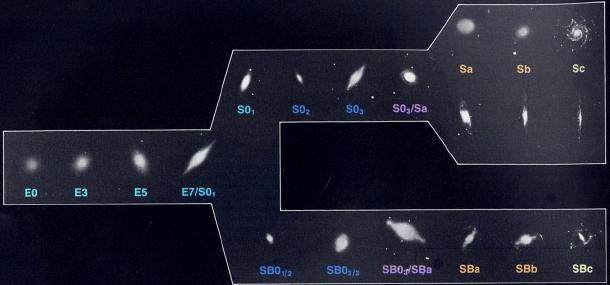
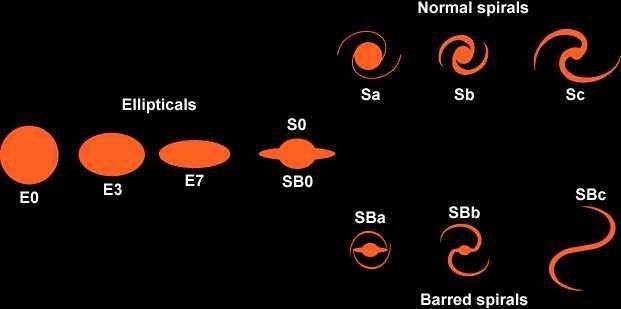
(http://www.astro.livjm.ac.uk/courses/phys134/cosmo.html).
Given the common
hypothesis that galaxy morphology relates to galactic
evolution and age, it is interesting that quite fully
developed and mature "tuning fork" morphologies with a
spectral colors of mature quiescence as well as youthful
starburst formation activity in galaxies have been observed
all the way to between 10.7 to 12.2 billion light-years
(supposedly 1.5-3 Gy after the Big Bang).
That implies that these galaxies
whose light left them more than 11 billion years ago already
showed galaxies and stellar-spectral ages both young and old.
This fits the predictions of steady state type cosmologies
(whether of the CSSC or QSSC type), or other types of non-BB
cosmologies.
Ancient morphologically-mature spiral
starburst galaxy
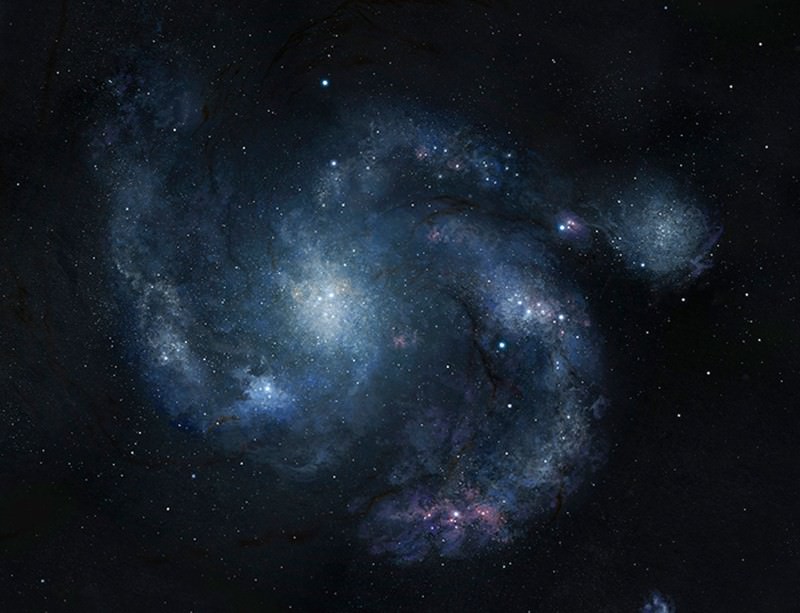
The Hubble Space Telescope's Cosmic Assembly
Near-Infrared Deep Extragalactic Legacy Survey (CANDELS) data
set revealed mature galaxies >11 billion light-years
distant with fully mature galaxies with both young and old
stellar spectral ages. (Lee et al. 2013, http://iopscience.iop.org/article/10.1088/0004-637X/774/1/47/meta;
popular news story in New Scientist, 2013: https://www.newscientist.com/article/dn24063-galactic-zoo-took-shape-near-the-dawn-of-the-universe/).
The above data again reveals in stark terms
that galaxies of all stellar ages are visible at all
distances back within the visible horizon of the
Universe—just what we would expect of an indefinitely old
and vast Universe, such as predicted by the steady state,
plasma, or perhaps non-singular oscillatory types of cosmos
models.
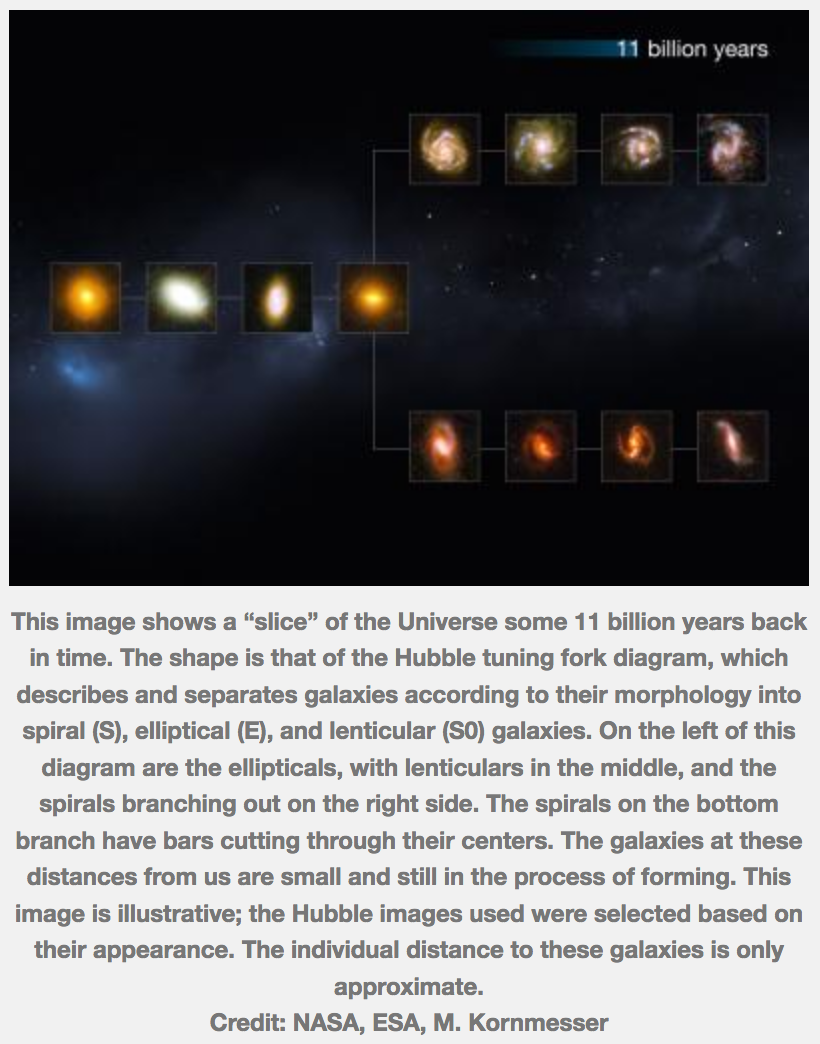
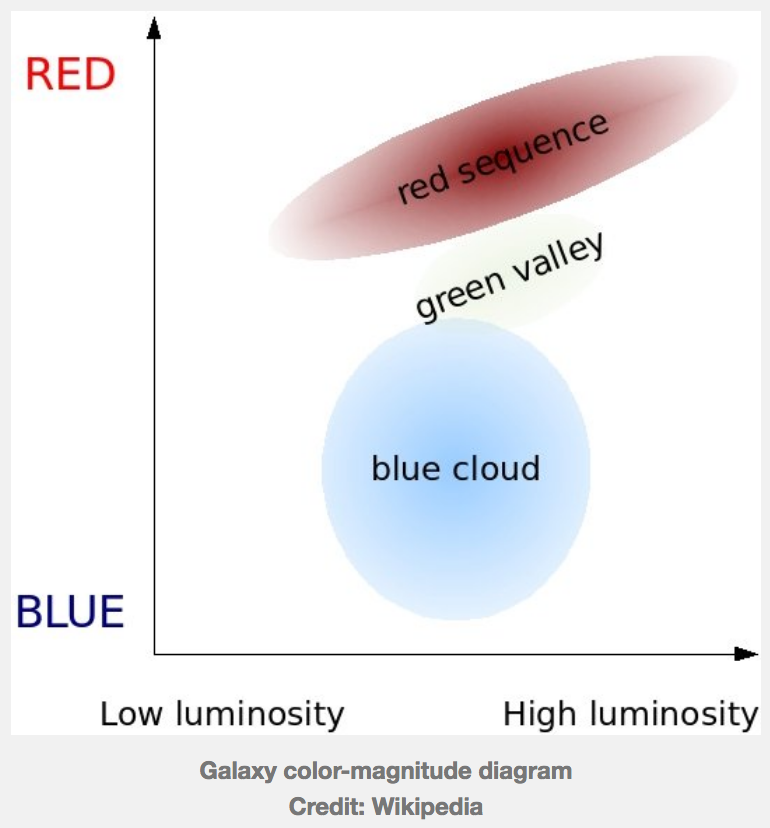
Unexpectedly, from the standpoint
of the HBBC paradigm, essentially the same spread of younger
bluish and older reddish galaxies of differing morphologies
were found by Lee et al. (2013) by
z ~ 2. The implications for
competing cosmologies are evident (see link).
Again these data fit the Steady State type or plasma
cosmologies which predict such an ongoing diverse
distribution of galactic ages at vast distances in an
infinite, or indefinitely old Universe, as discussed
previously.
In
one of the deepest views prior to developments from the
JWST, galaxies of all different morphologies, various
stellar spectral ages, going back across billions of
light-years out to ~13.1 Gly have been assayed in the
Hubble Ultra Deep Field (Rafelski et al. 2015.
UVUDF: Ultraviolet through Near-Infrared catalog and
photometric redshifts of galaxies in the Hubble Ultra Deep
Field. AJ 150 (1), 31. https://iopscience.iop.org/article/10.1088/0004-6256/150/1/31).
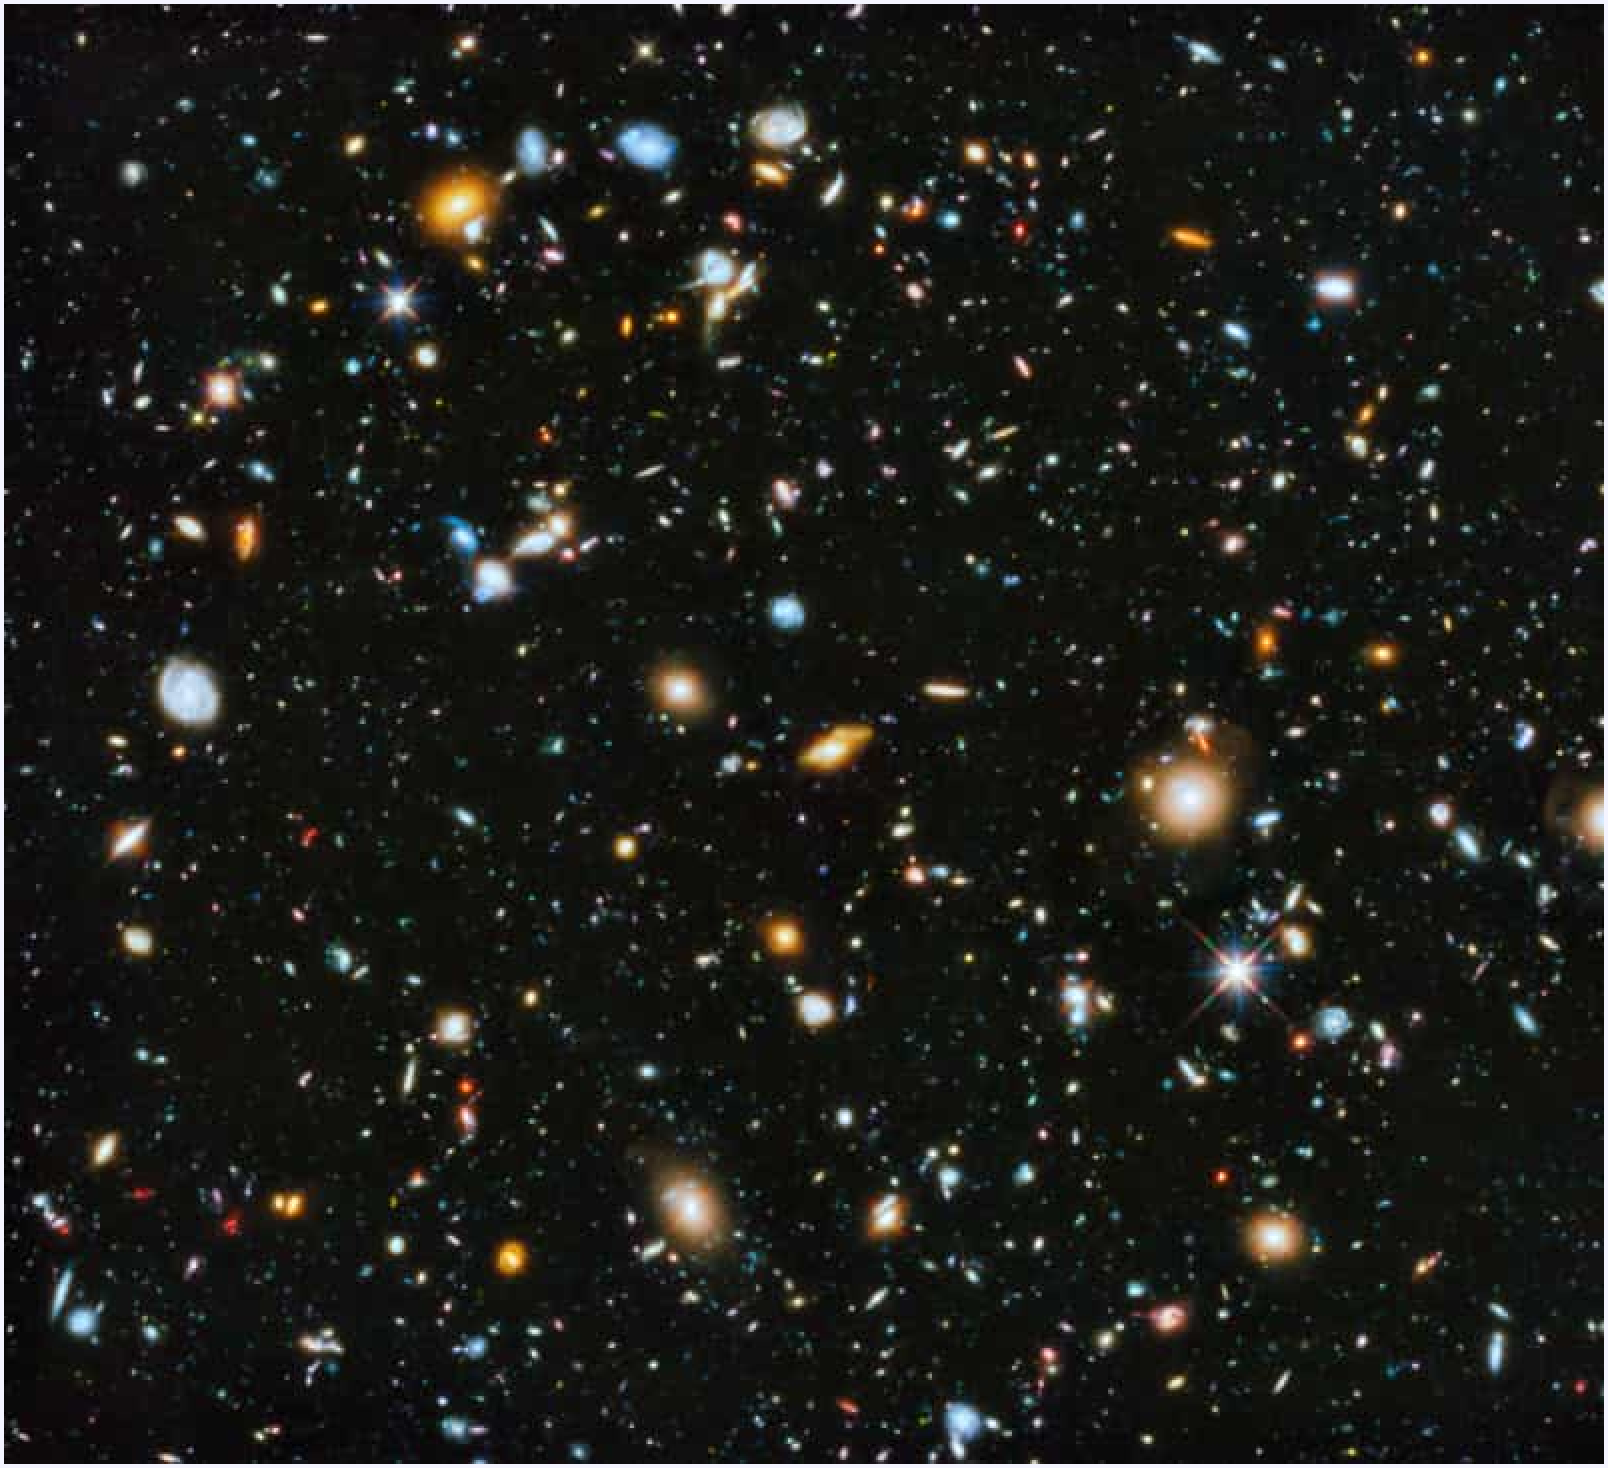
Excerpt of the Hubble
Ultra Deep Field view with estimated
redshift distances (Rafelski et al. 2015).
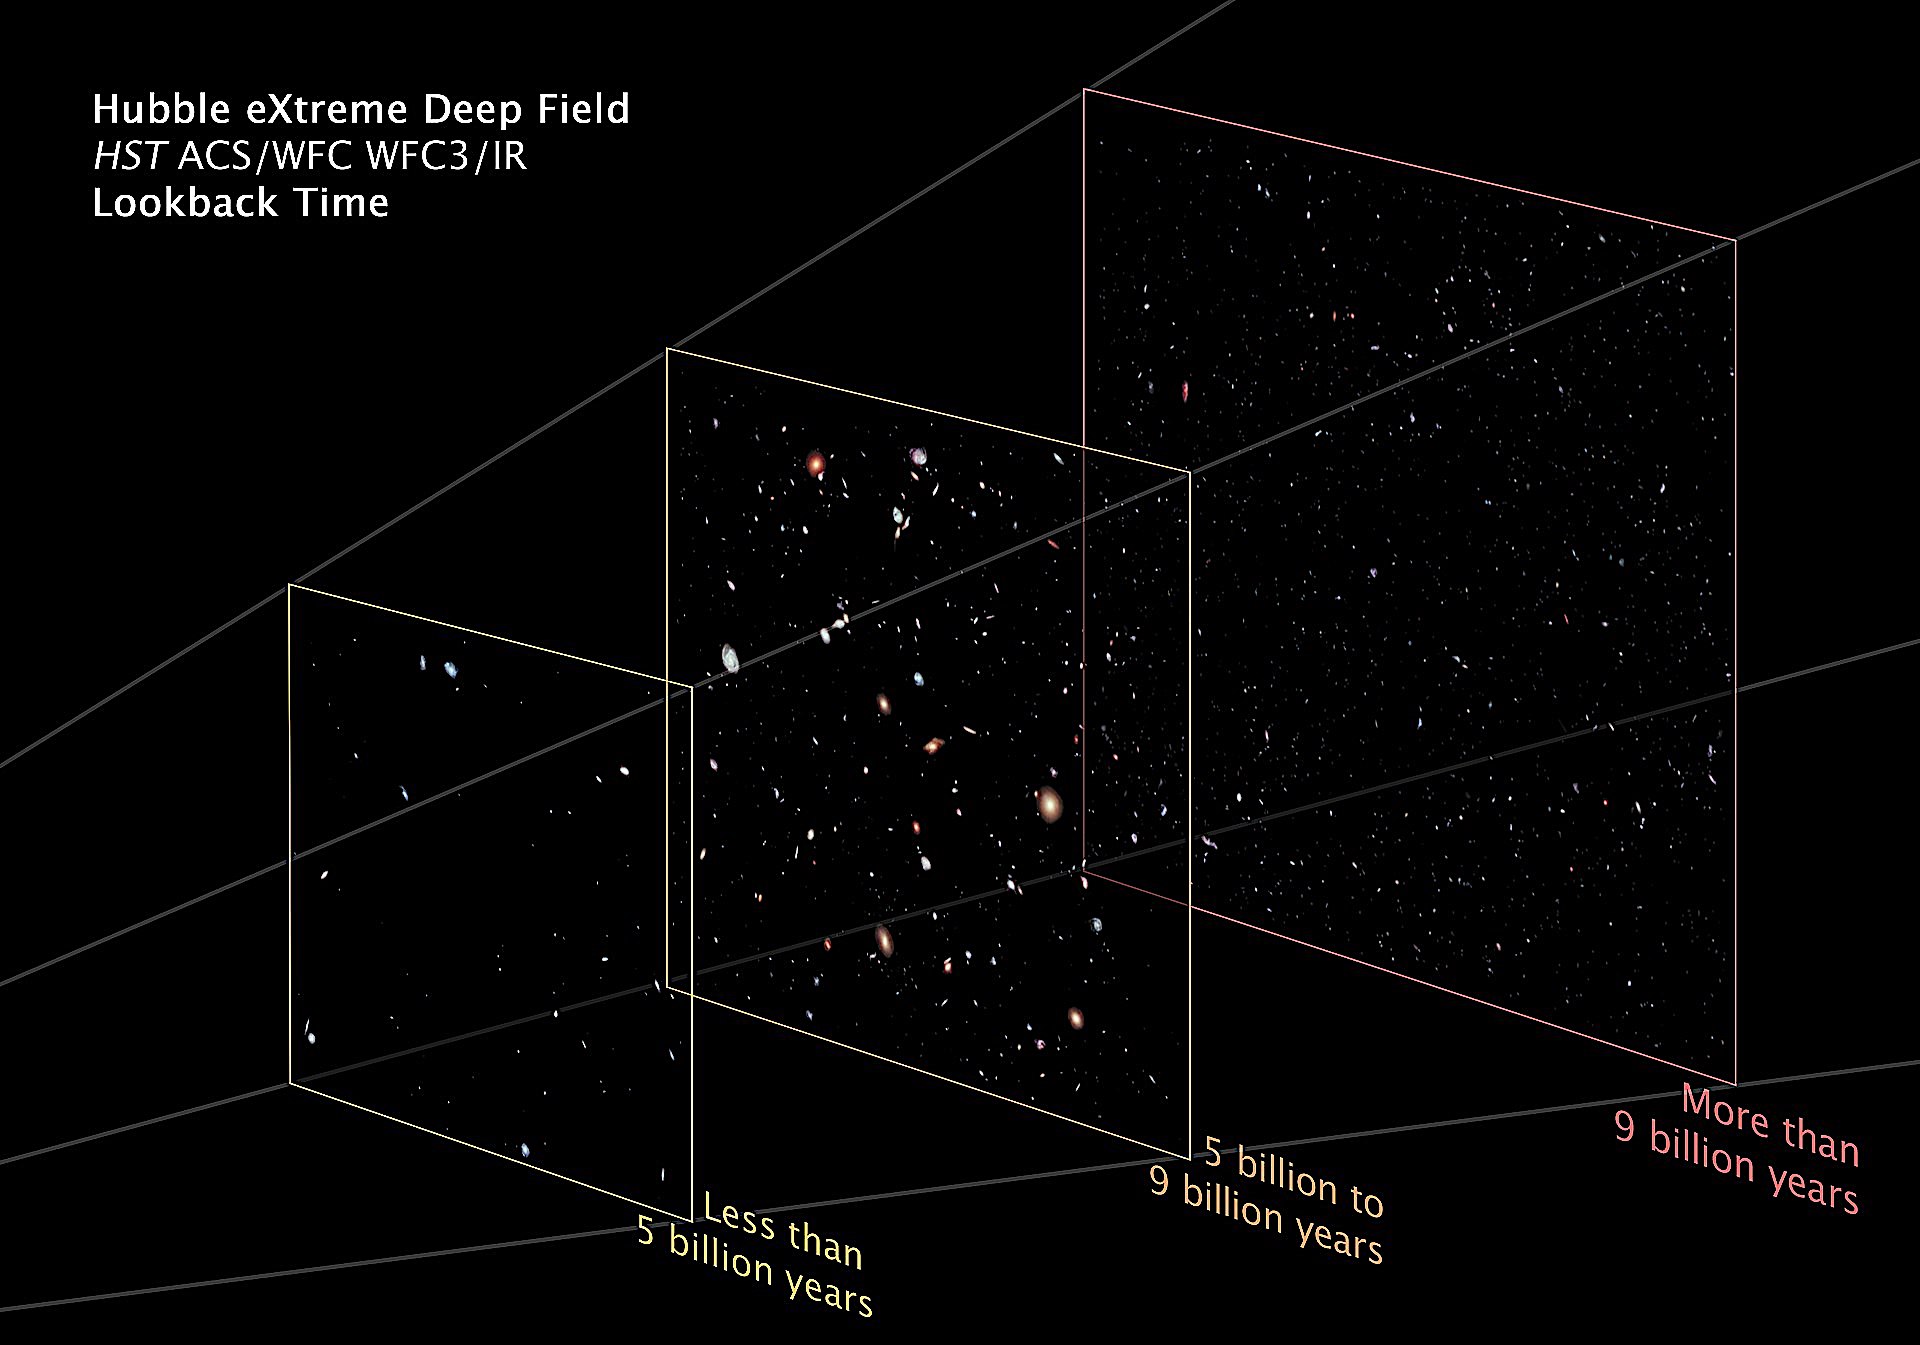
Look back time across billions of light
years (Ibid.).
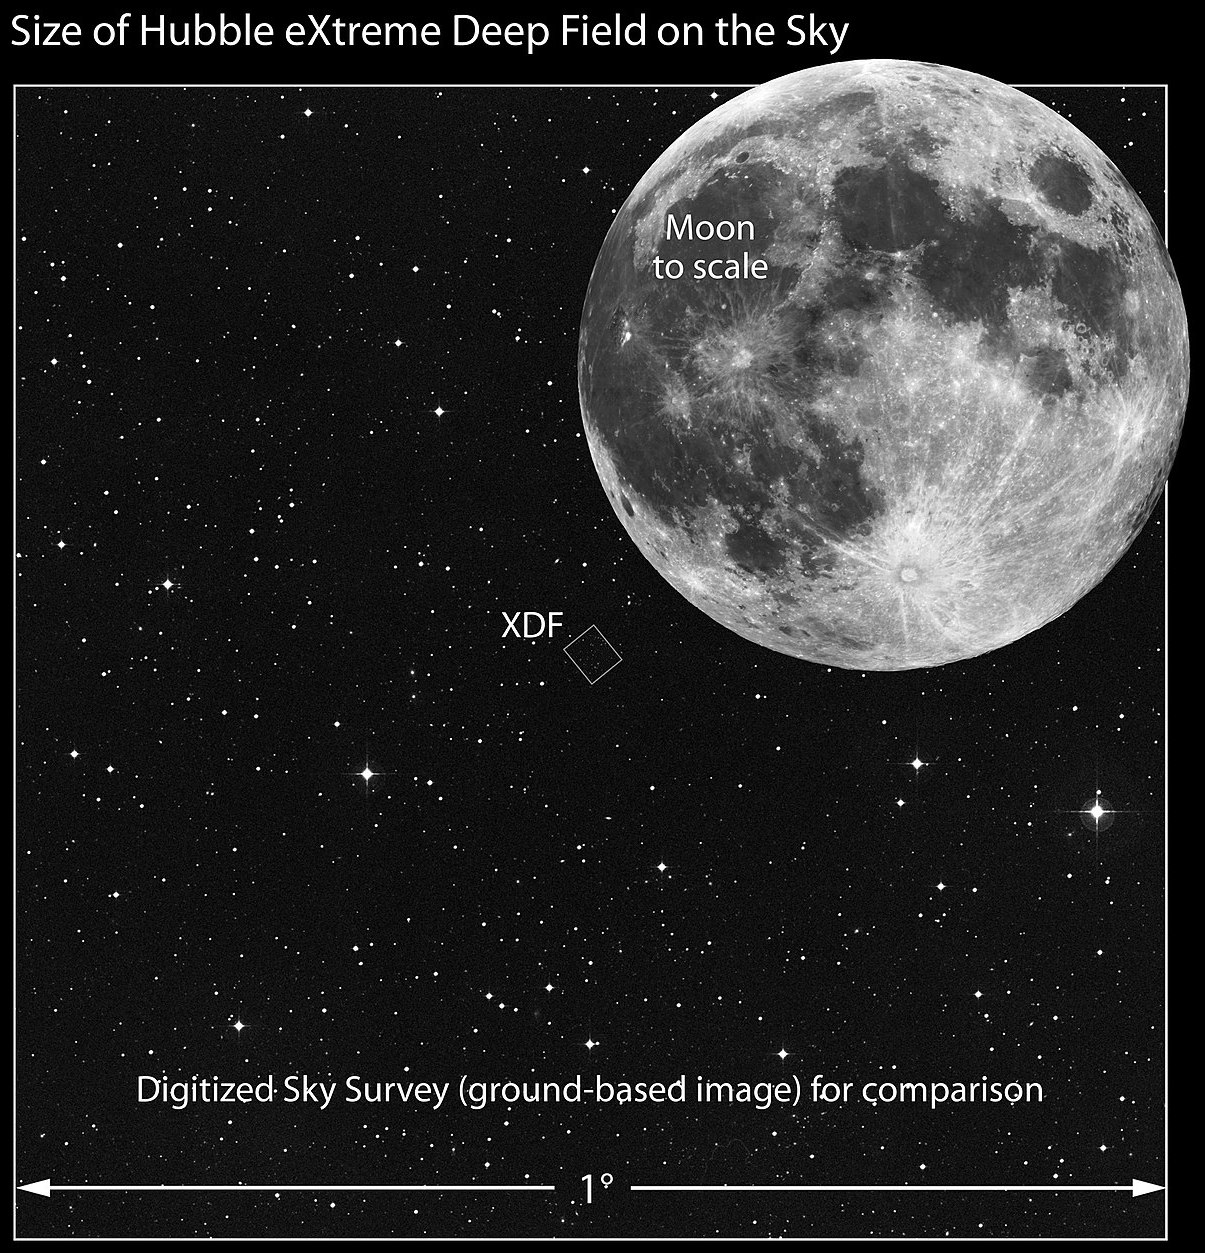
Angular scale of the HUDF within 1 degree
of the sky (Ibid.).
As seen near the
constellation Eridanus (the River), also featured
color-inverted from Johannes Bayer, Uranometria
(1661 edition).
Hubble Tuning Fork
morphology and anomalous, intrinsic redshifts. The
lowest redshift galaxies in a cluster tend to be those of
the 'normal' spiral, Sa and Sb, while the more elliptical
(E) and extreme open spirals (Sc, Sd) and barred spirals
(SBb, SBc) tend to have an excess redshift compared to the
average z of a given cluster of galaxies. It has been suggested that this
could this relate to a possible ejection cosmogony for
galactic clusters, such as pioneered by Viktor
Ambartsumian, and developed further by others? The
Hubble Tuning fork "intrinsic redshift" bias in galaxy
morphologies. There is long-emerging pattern of a non-Hubble
connection between galaxy morphology and excess redshift. We
introduce and discuss this briefly next.
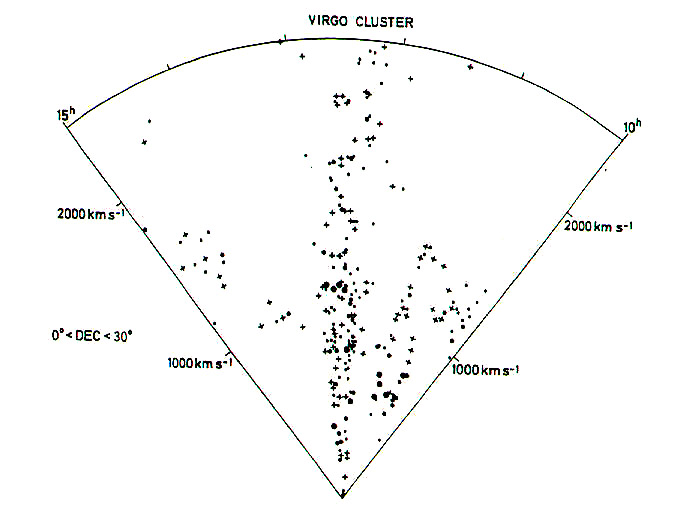
Pie diagram of redshift vs. sky angle for all galaxies listed
as Virgo Cluster members in Sandage & Tamman's Revised
Shapley Ames Catalog
(Image used by kind permission from Arp,
1998).
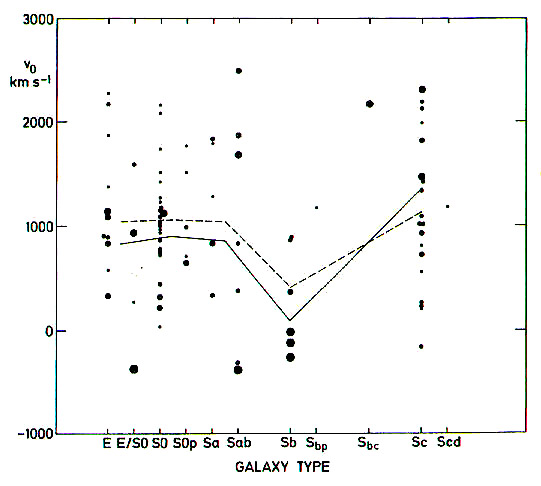
Virgo Cluster: Galaxy morphological type differences in
redshift (Image used by kind permission from Arp, 1998).
Virgo Cluster.
Armenian astronomer
Viktor Ambartsumian held that some galaxy clusters are not
gravitationally bound and stable, but rather are
disintegrating outward from ejection events.
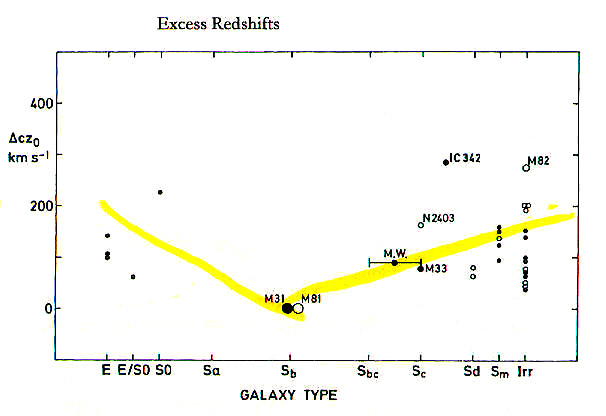
The Local Cluster of galaxies (Image used by kind permission
from Arp, 1998).
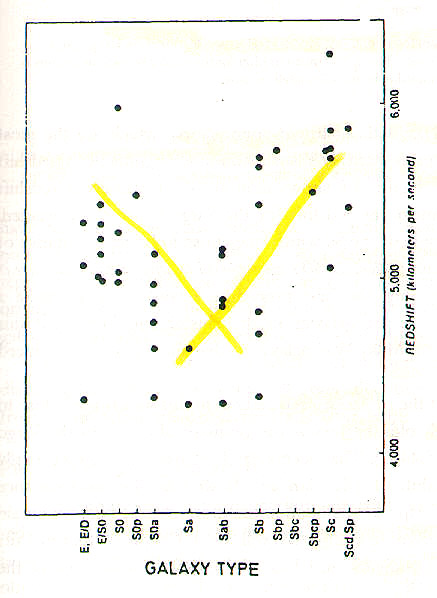
Abell Cluster 262: Galaxies brighter than 15th magnitude
(Image used by kind permission from Arp, 1998).
Also, clusters with galaxy distributions in different stages
of morphological development (i.e., different ages! Image used
by kind permission from Arp, 1998).
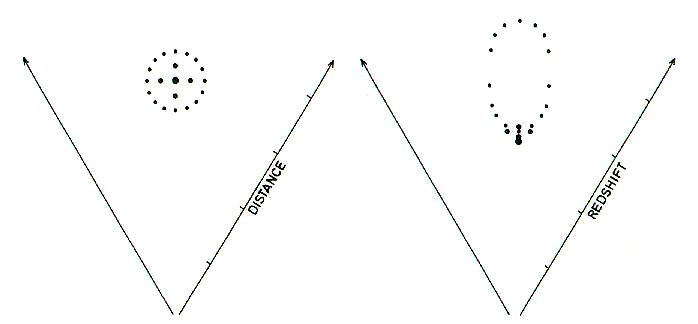
(Image used by kind permission from Arp, 1998).
What happens to a
spherical galaxy cluster with lowest redshifts toward the
center when z = distance is assumed. The question is,
Why is there an excess component to the smaller, more
energetic elliptical and barred spiral galaxies in the same
clusters? We will pursue more of the data illustrating this,
and attempt to have a better understanding to the question.
For now, we note more data showing that they're may well be
such an intrinsic redshift component, dependent on galactic
morphological type.
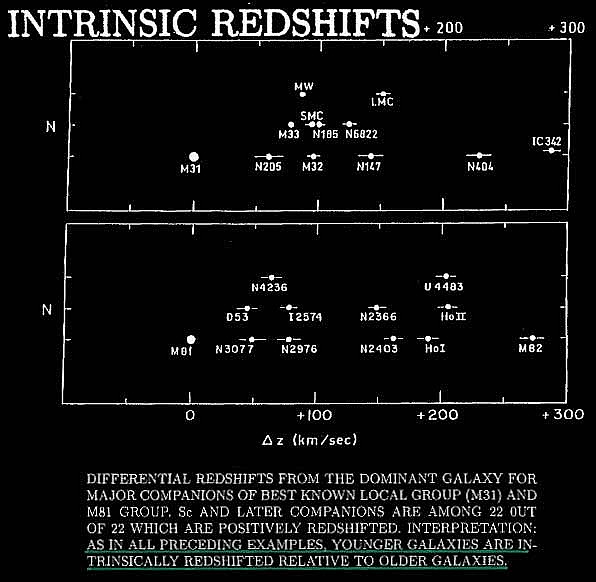
(www.haltonarp.org).
Dilation Redshift scatter (Joseph, 2010b).
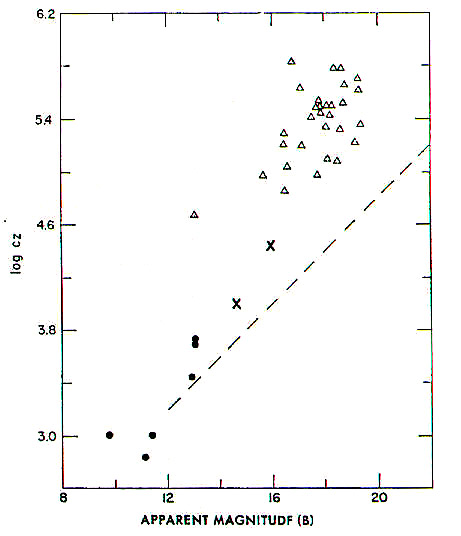
Excess redshifts found in active nuclei Seyfert galaxies
represented by triangles.
(Image used by kind permission from Arp, 1998).
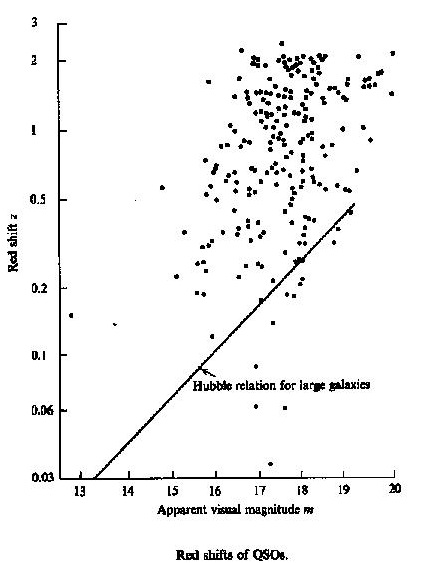
Excess QSO redshifts (Joseph, 2010b).
In 2003, D. G.
Russell released a paper, Intrinsic redshifts in normal spiral
galaxies. https://arxiv.org/abs/astro-ph/0310284,
a paper which was released in updated form: (2004 arXiv: https://arxiv.org/abs/astro-ph/0408348),
and published in 2005: Evidence for
intrinsic redshifts in normal spiral galaxies. Astrophys
Space Sci 298, 577. https://doi.org/10.1007/s10509-005-2317-x.
Russell summarized data showing that even ordinary spiral
galaxies have some currently unexplained excess redshift
component, above the Hubble constant redshift-distance
relation expectations. In his 2003
manuscript, Russell had diagrams to show this,
including some intrinsic additional redshift data seemingly
dependent in part on morphology: https://arxiv.org/ftp/astro-ph/papers/0310/0310284.pdf.
We turn now to these data as encapsulated by reference to
his 2004 tables and figures. By way of introduction, Russell
follows up on the many published references to non-Hubble
relation / intrinsic and discordant redshifts between
apparently associated / ejected objects of different
redshifts (covered in introductory form in this chapter VI,
as well as in greater detail with other papers cited in
chapters VII, VIII,
IX, X,
and XII
in this history—some of these chapters published in draft
and others yet to be published).
Russell makes use of the Tully-Fisher Relation (TFR: Tully,
R. B. & Fisher, J. R. 1977. A new method of determining
distances to galaxies. A&A 54 (3),
661-673. https://articles.adsabs.harvard.edu/full/1977A%26A....54..661T;
cf. on TFR in 'dark matter' HBBC: Combs, F. 2009. COMMENTARY
ON: TULLY R. B. AND FISHER J. R., 1977, A&A, 54, 661:
From distances to galaxy evolution and the dark matter
problem. A&A 500 (1), 119-120. https://doi.org/10.1051/0004-6361/200912152)
as an independent distance check to be compared with his
working value of the Hubble constant as H0
= 72 km s−1
Mpc−1
. The TF relation (1977): "We propose that for spiral
galaxies there is a good correlation between the global
neutral hydrogen line [HI] profile widt, a
distance-independent observable, and the absolute magnitude
[M] (or diameter)." The hypothesis being tested by Russell
is what we have called the
Ambartsumian-Vorontsev-Vely'aminoff-Arp (AVVA) cosmogony,
which we discuss at length in several chapters:), a model of
galactic evolution: "...some quasars may be ejected from
active Seyfert galaxies as high redshift objects that evolve
to lower redshifts as they age." Russell explains, "In this
model the intrinsic redshift component is related to the age
of a galaxy such that younger galaxies have a larger
intrinsic redshift component than older galaxies," (cf. cit.
Narlikar, J. & Arp, H. 1993. Flat spacetime cosmology: A
unified framework for extragalactic redshifts. ApJ 405,
51. https://adsabs.harvard.edu/full/1993ApJ...405...51N)
while Bell (2002a; 2002b ) proposed an intrinsic redshift
component imposed on the Hubble relation.
Narlikar's theoretical
'aiding and abetting' of the AVVA cosmogony, to parody
Gamow's spousal poem on the Hoyle-Ryle controversy (see
forthcoming chapter III).
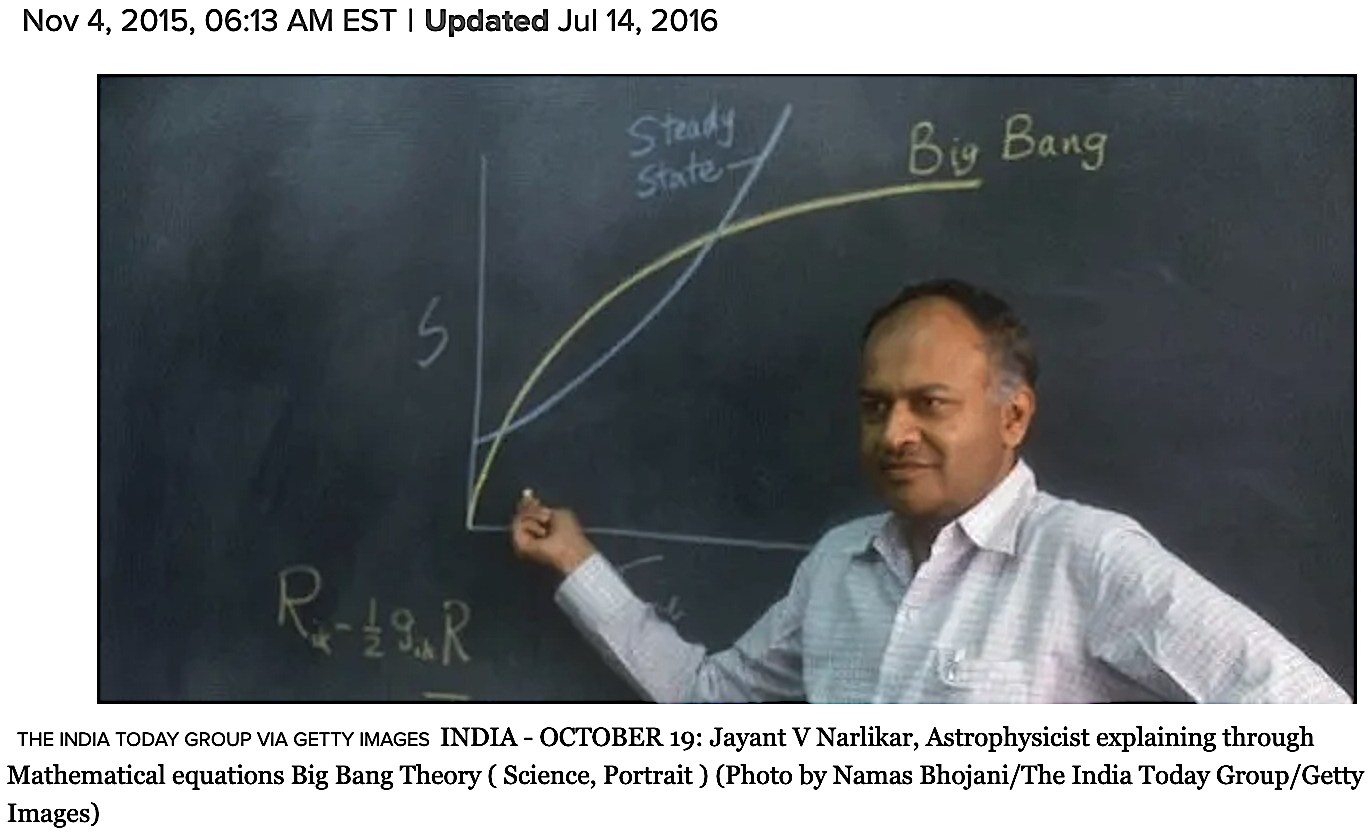
Prof. J. V. Narlikar wrote to
Indian president seeking 'reassuring action'
on growing intolerance (link).
In
summary, the Ambartsumian Vorontsev-Vel'yaminov Arp (AV-VA)
cosmogony: Involves the following elements:
- Compact
high z objects like QSOs / BSOs are
ejected from the cores of AGNs with
(Machian) high intrinsic redshifts
- As they
stream away from the semi-major axis of the
AGN, they gradually lose their high
intrinsic redshifts through Machian
interactions
- Steadily
until they fall back toward the parent
galaxy with redshifts only slightly elevated
above the & falling back toward
- the
ordinary Hubble flow based on H0
values.
Halton Arp has
called this 'an empirical cosmogony' because it
arises from direct anomalous observations, and
also seeks explanation within a variation of the
(Machian) Hoyle-Narlikar theory (1964ff, 1966,
&c.).
(Figures opposite used by kind
personal communication permission of the late
Halton Arp, but will be discussed in the context
of their original appearances in the peer-reviewed
references; cf. Arp, 1968 volume in the homepage Select
Bibliography).
|
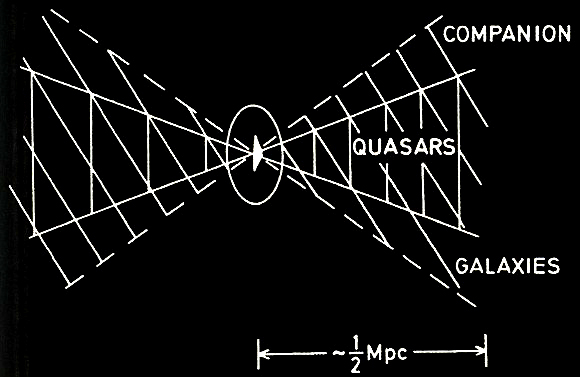
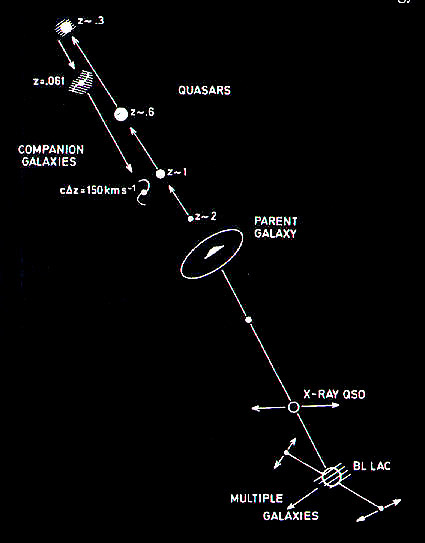 |
We will return to this AV-VA
cosmogony as a recurring test-case hypothesis in the
following chapters cited above. As Russell framed it, his
paper was meant to test: "If galaxies and quasars do contain
a component of intrinsic redshift then the implications for
cosmological models are significant. It is therefore
important to establish whether or not the redshift anomalies
are real by direct means." This is what Russell set about
doing, including going through 6 alternative hypotheses (Ibid.,
pp. 17-19). We'll show his data and let the reader explore
more, where the options were explored, including elimination
of the Malmquist bias, &c. (See Methods):
Russell (2004) data.
Russell (2004) Appendix figures.
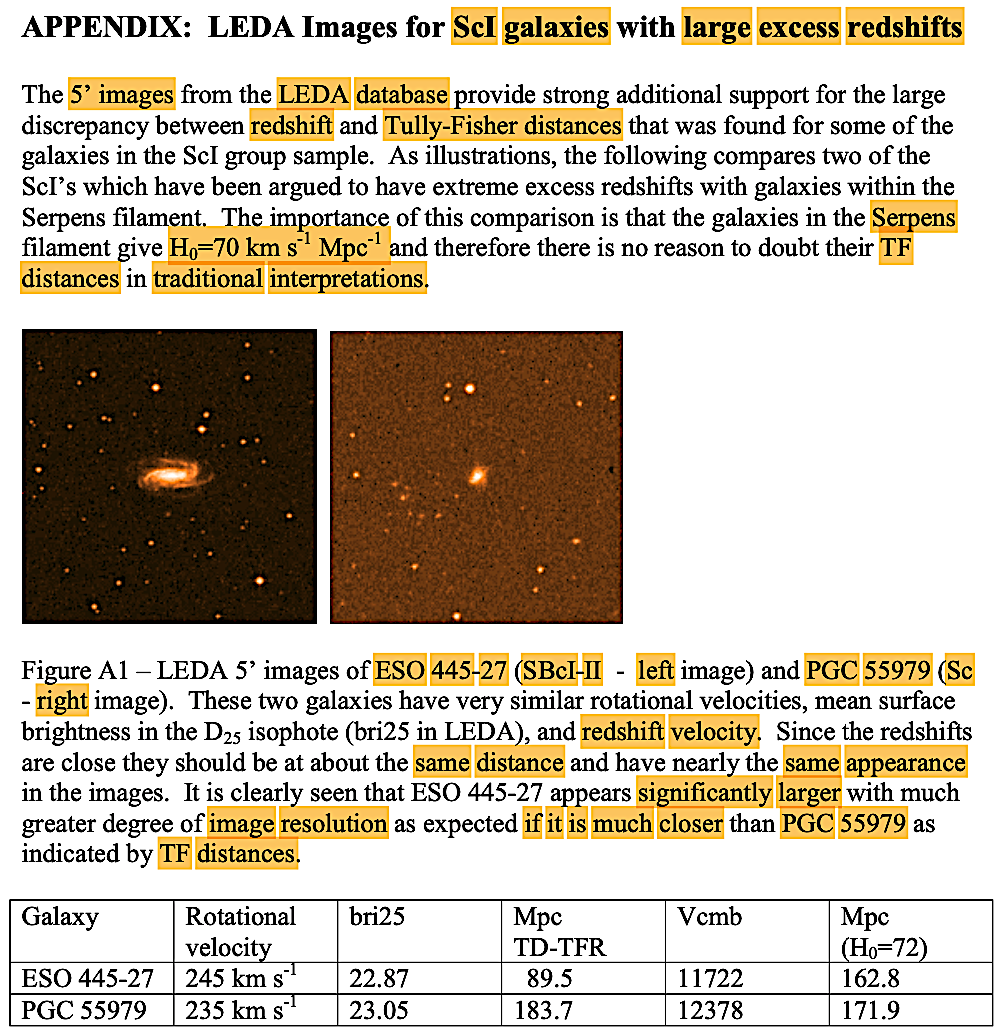
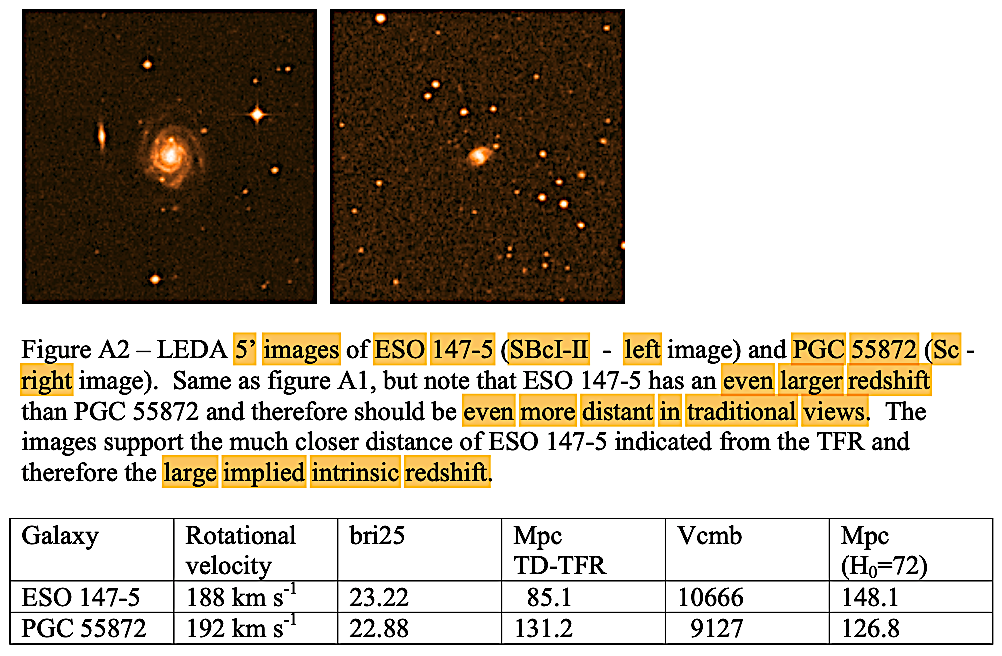
Russell (2004) concludes
conservatively the following: "The results of this study
support previous claims for large redshift anomalies in
normal spiral galaxies (Arp 1988, 1990, 1994; Russell 2002).
It was found that within large clusters there is a tendency
for late type Sbc/Sc spirals to have significantly larger
mean redshifts than early type Sa/Sb spirals.
Evidence for Intrinsic Redshifts in Normal Spiral
Galaxies
The most extreme case is the ScI’s in Virgo which have a
mean redshift ~1500 km s-1 greater than the mean
redshift of the large Sab/Sb spirals in Virgo. The excess of
Sbc/Sc spirals relative to Sab/Sb spirals in Pisces and
Serpens was +552 km s-1 and +1604 km s-1
respectively." Moreover, Russell continues, "It is not clear what
phenomenon can explain the redshift anomalies that the
empirical evidence of this study indicate exist. The
following possibilities are considered:" Although the
following are quite dated given the literature cited then,
they are worth repeating to illustrated the undone homework
which could be done with far superior data now, >2
decades hence. (The emphasis is Russell's).
- "(1) Morphological Density
Relation.
- (2) Value of the Hubble
Constant.
- (3) Large Scale Flows.
- (4) Gravitational
Redshifting.
- (5) Cepheid Calibration.
[Comment: Of course we now have JWST on top of HST
Cepheid calibration showing that JWST provides no relief
for the 'Hubble tension' from Cepheid variables].
- (6) Real Peculiar Motions.
Russell continues, "However, there is no precedent for
such large peculiar motions in galaxy clusters or field
galaxies. In addition, large peculiar motions cannot
explain the systematic excess redshift of the ScI group
galaxies as there should be large deficits of redshifts
for approaching galaxies." [Comment: If viriality
is violated as Ambartsumian first proposed in the 1950s,
then this is not a surprise. Perhaps a generalziation of
the 'law of conservation' of baryon number is required as
Ambartsumian proposed, and as the CSSC stated in another
context, mid-last century and afterwards with developments
in C-field cosmologies (CSSC and QSSC, &c.)].
Finding these wanting,
Russell (2004) states, "The large redshift anomalies
identified in this analysis are a challenge to explain in
standard views. Given that conventional explanations are
insufficient, there is reason for considering more exotic
alternative explanations." Perhaps modified
Newtonian gravitation or a model CGC (Bakhos, 2022) would
help? In his concluding paragraph, Russell states,
"The results of this analysis strongly suggest that large
redshift anomalies exist in normal galaxies which are most
likely non-doppler (intrinsic) in nature. While the exact
mechanism for intrinsic redshifts is necessarily speculative
at this time, the empirical evidence is consistent with the
intrinsic component of redshifts being in discrete amounts
and age related such that younger objects have a larger
component of intrinsic redshift than older objects at the
same distance" (Russell, 2004).
One can only wonder why these anomalous data from the early
part of this millennium were not and have not been taken
into proper account in the question of the 'Hubble tension'
discussed and reviewed in the literature since then and
cited in our next chapter VII, Unexpected galactic
redshifts?
Since 2017 in the SDSS data, we can differentiate two actual
types of Seyfert AGN galaxies morphologically (Seyfert 1s
are more likely in bulge-dominant galaxies and Seyfert 2s
are more likely in spirals) rather than in a simple
unification model of Seyferts (which held the differences to
be based on the orientation of the galaxy from which the
Seyfert AGN is viewed telescopically): Chen, Y. C. &
Hwang, C. Y. 2017. Morphology of Seyfert galaxies. arXiv
(v2): https://arxiv.org/abs/1707.08806.
Astrophys Space Sci 362, 230. https://doi.org/10.1007/s10509-017-3210-0.
Seyfert 1 galaxies are characterized by broader Balmer (Hβ)
emission lines (normally on a spectrum based on line
strength of Seyfert 1.2, 1.5, 1.8, and 1.9), whereas Seyfert
2 galaxies are characterized by a higher ratio of [OIII] / Hβ
≥ 3 in their spectra. Using a FracDev parameter in R
language to classify the morphologies, the authors found
that Seyfert 1 galaxies have more active AGNs than Seyfert 2
galaxies, and this is accompanied by a greater deviation or
divergence in FracDev morphologies from those of
normal galaxies in these figures, greater at lower than an
higher redshifts:
Empirical results of the Seyferts vs normal
galaxies based on FracDev morphology scores,
magnitudes, and averages in FracDev morphology scores
vs redshift.
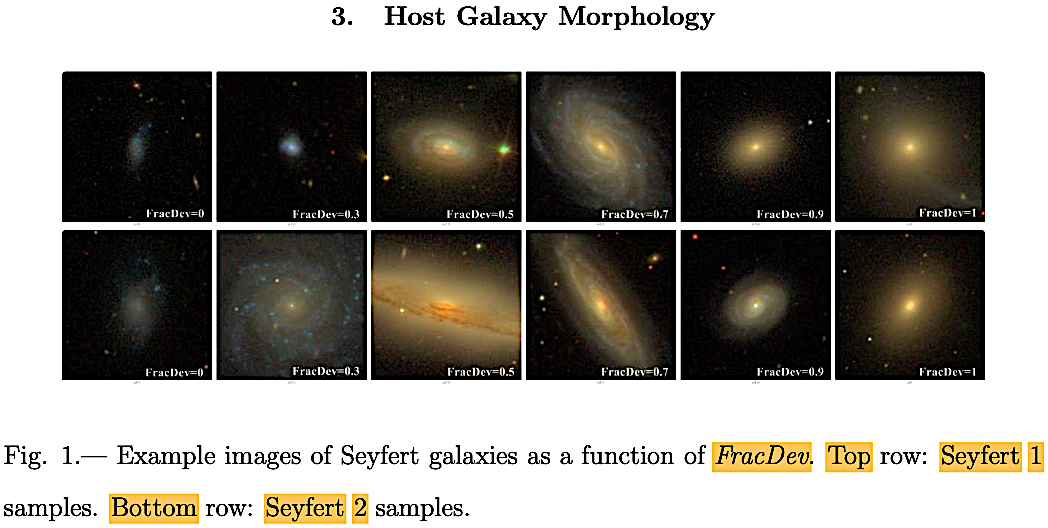
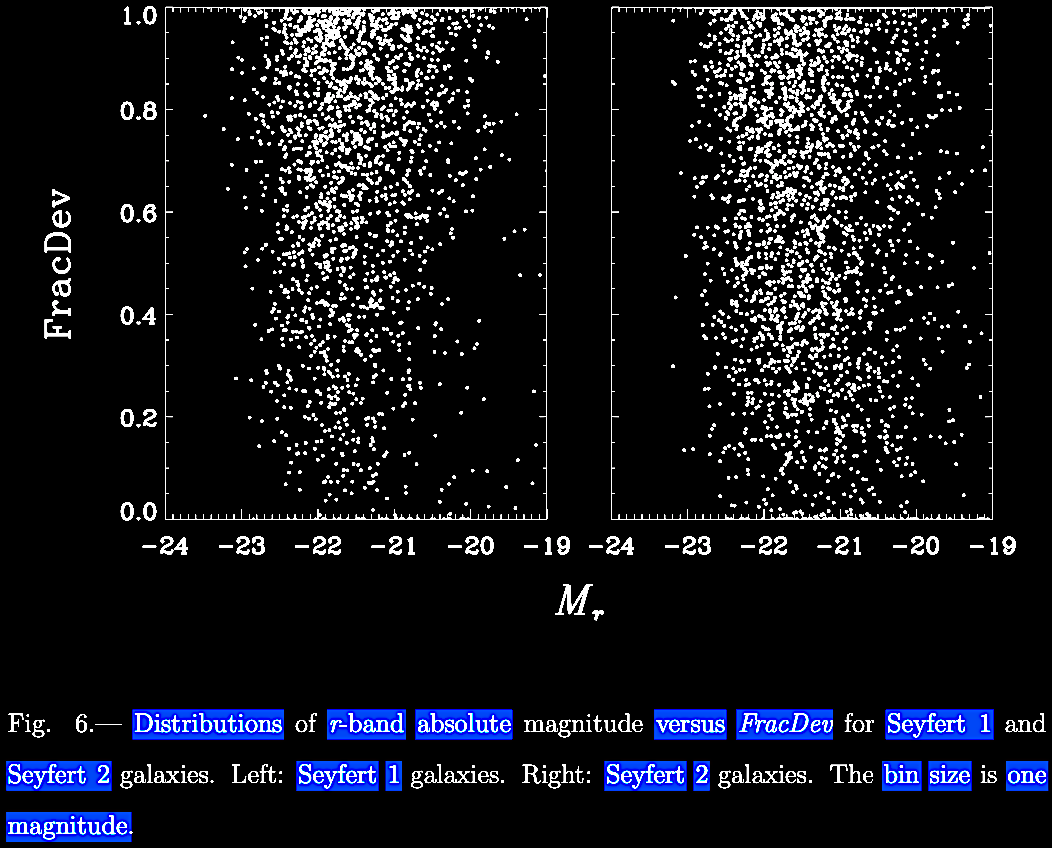
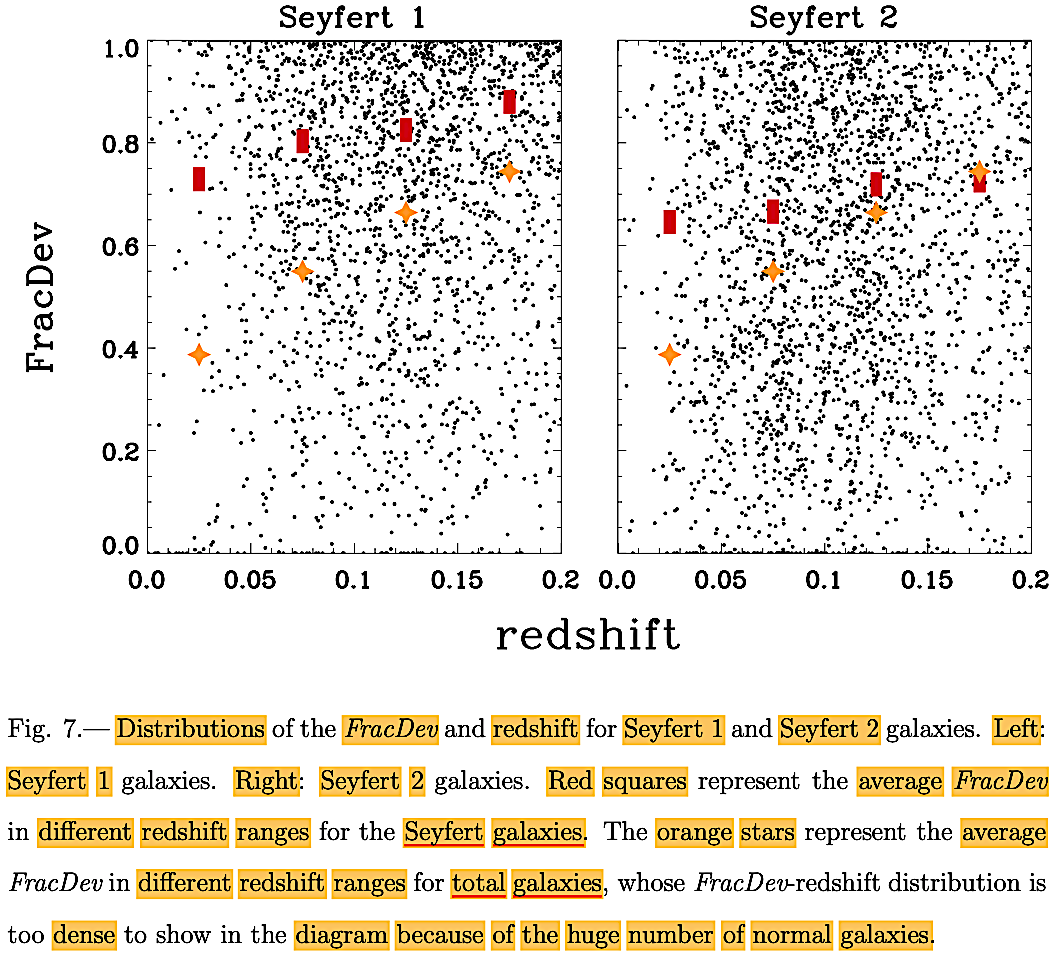
Chen & Hwang (2017) figures.
In brief, there is evidence of a galactic morphology /
age-dependent intrinsic (non-Hubble relation) component to
galactic redshifts, which doubtless contributes to the
'fingers of god' phenomenon, and it is related to the
proximity and apparent age of galaxies to apparent ejection
phenomena from AGNs. These data cannot be ignored. We don't
and we won't.
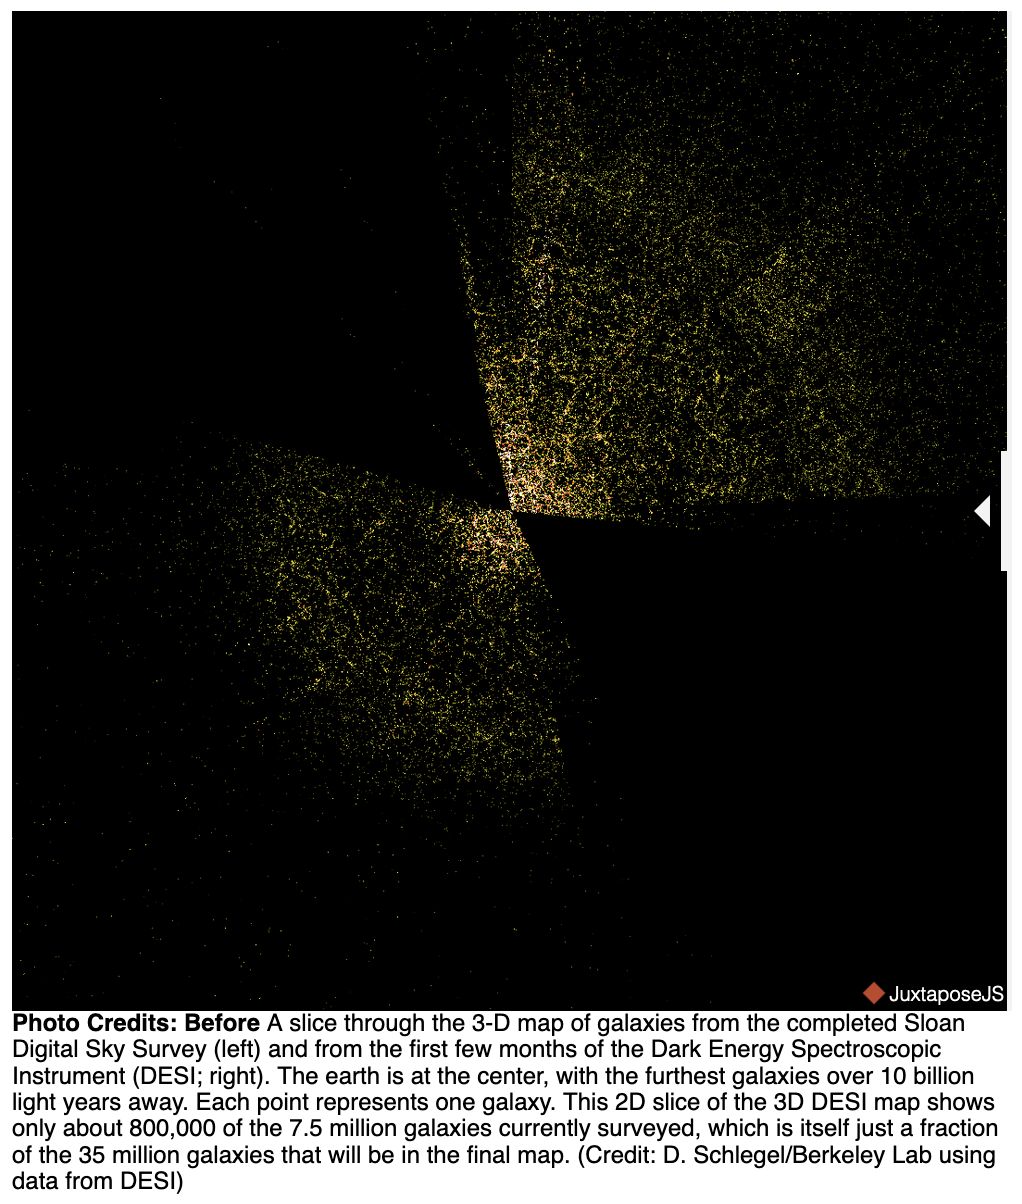
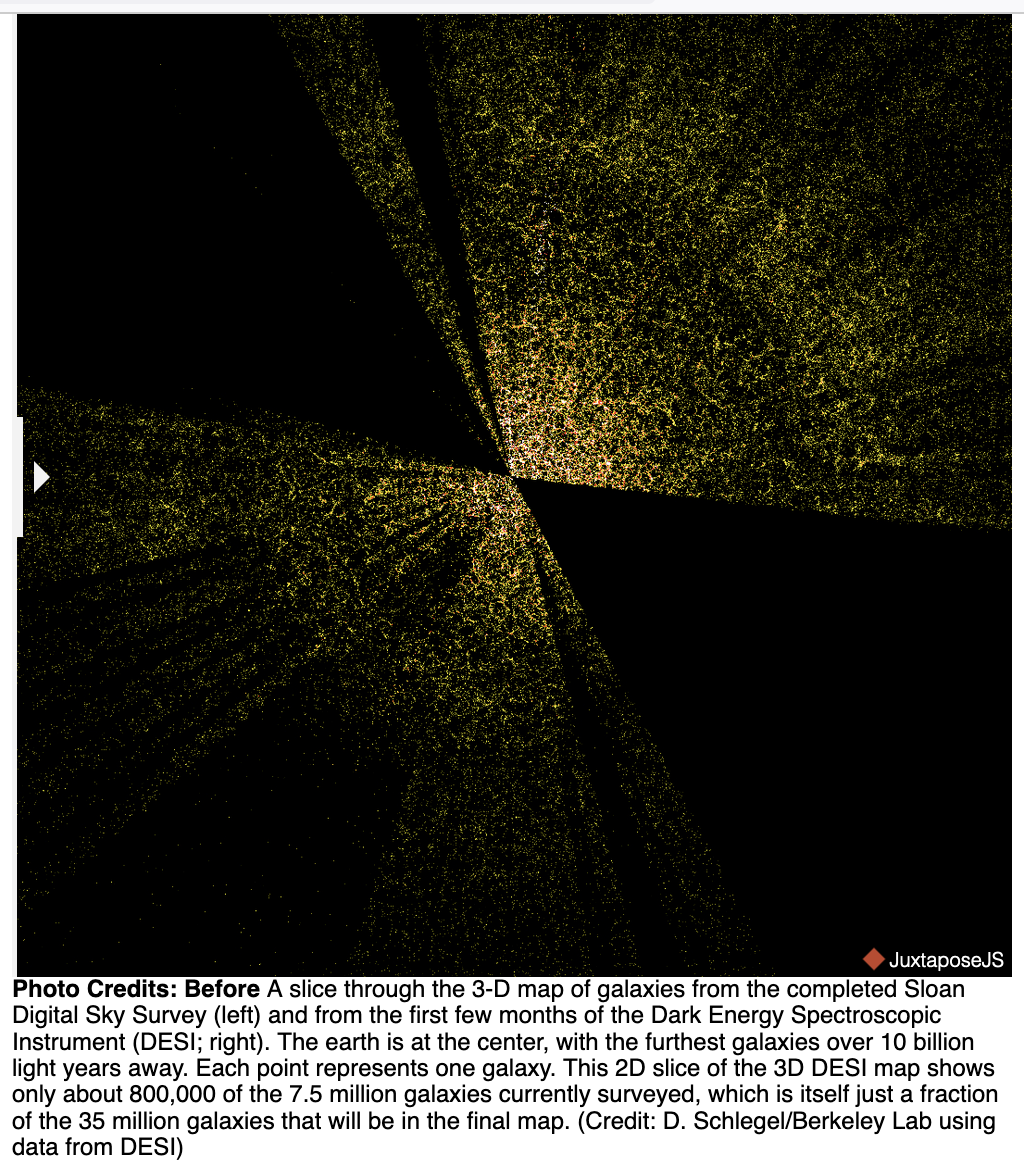
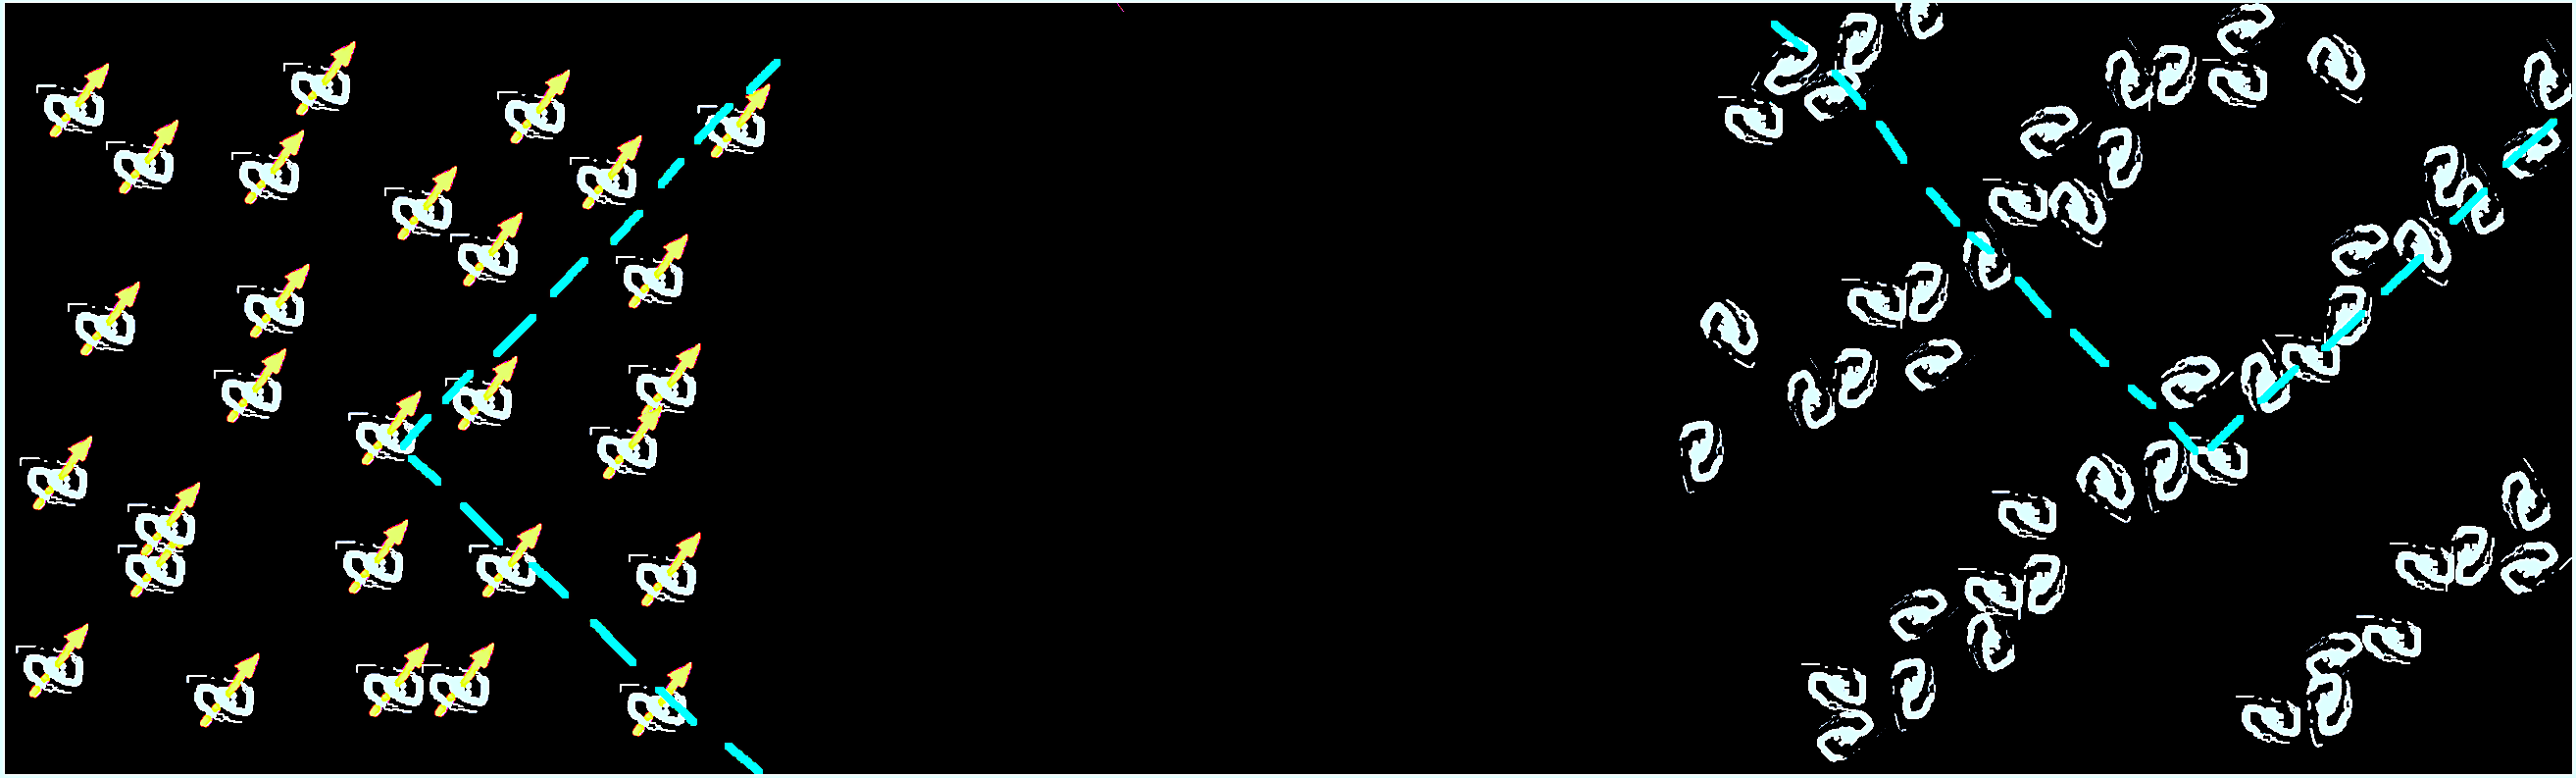
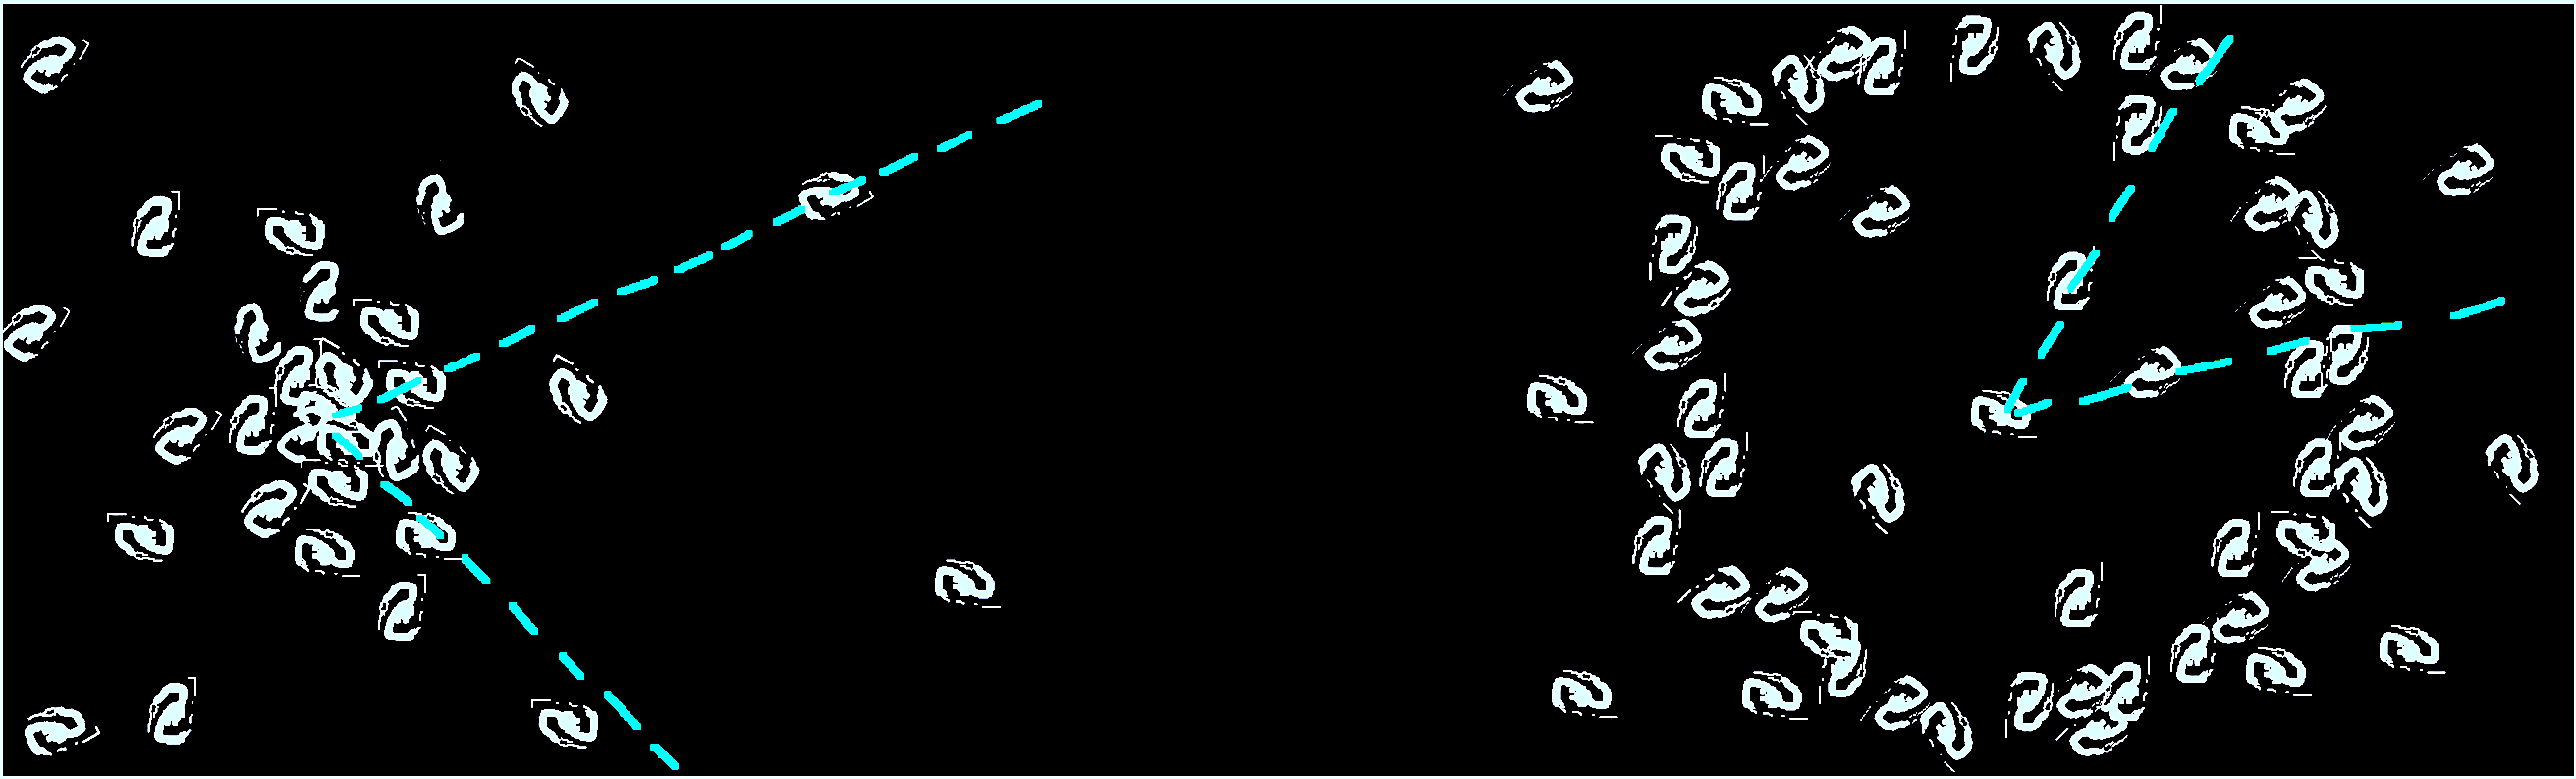
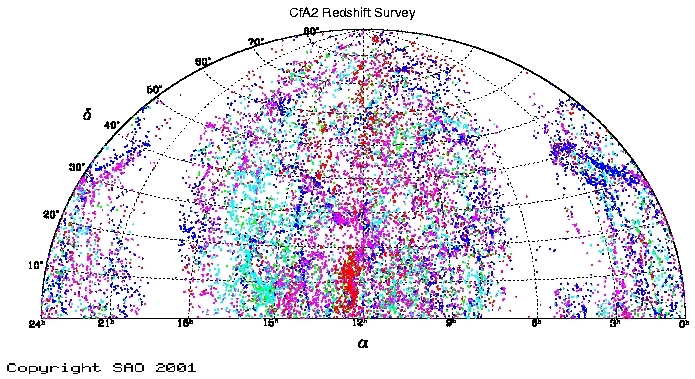
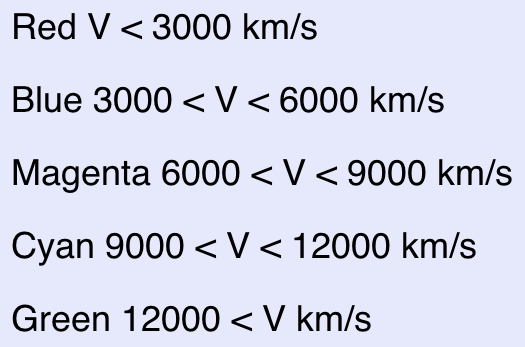
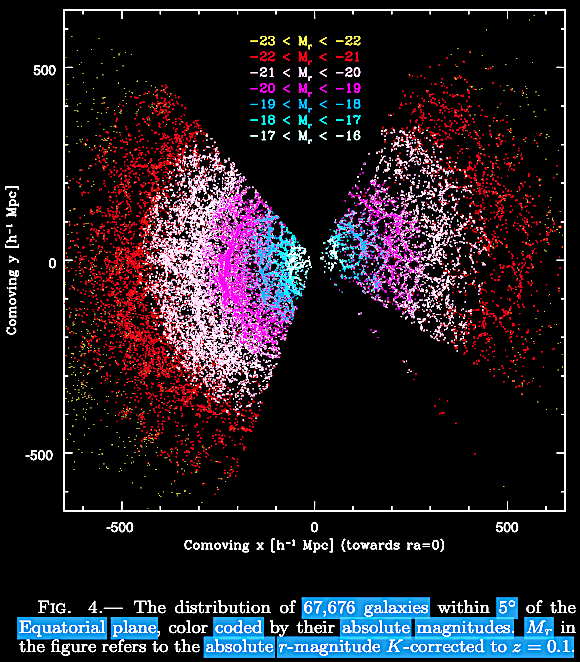
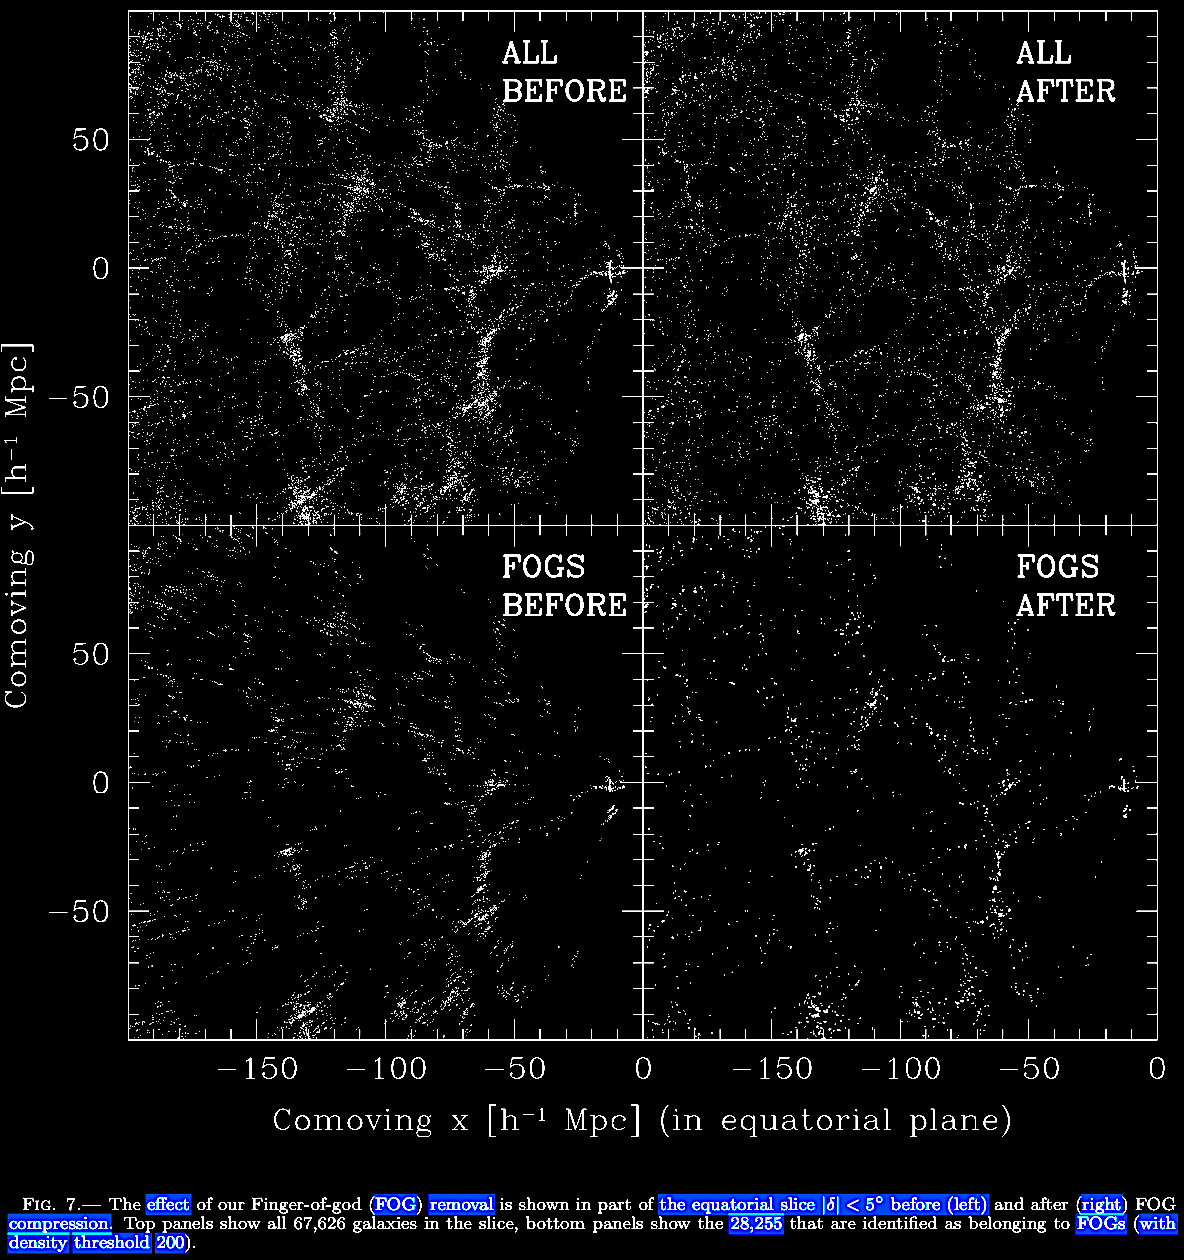
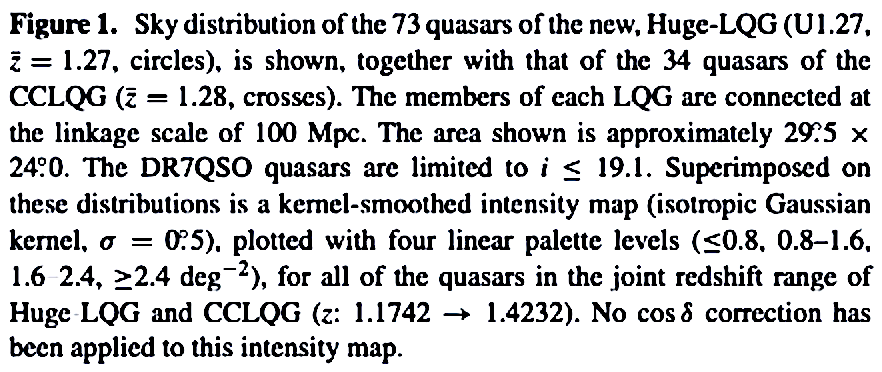
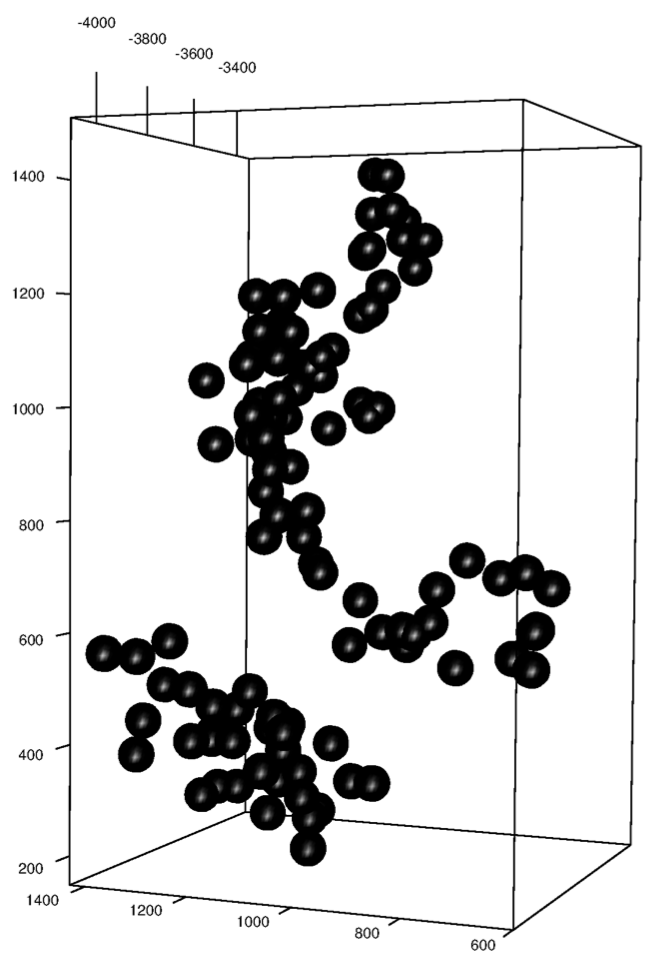
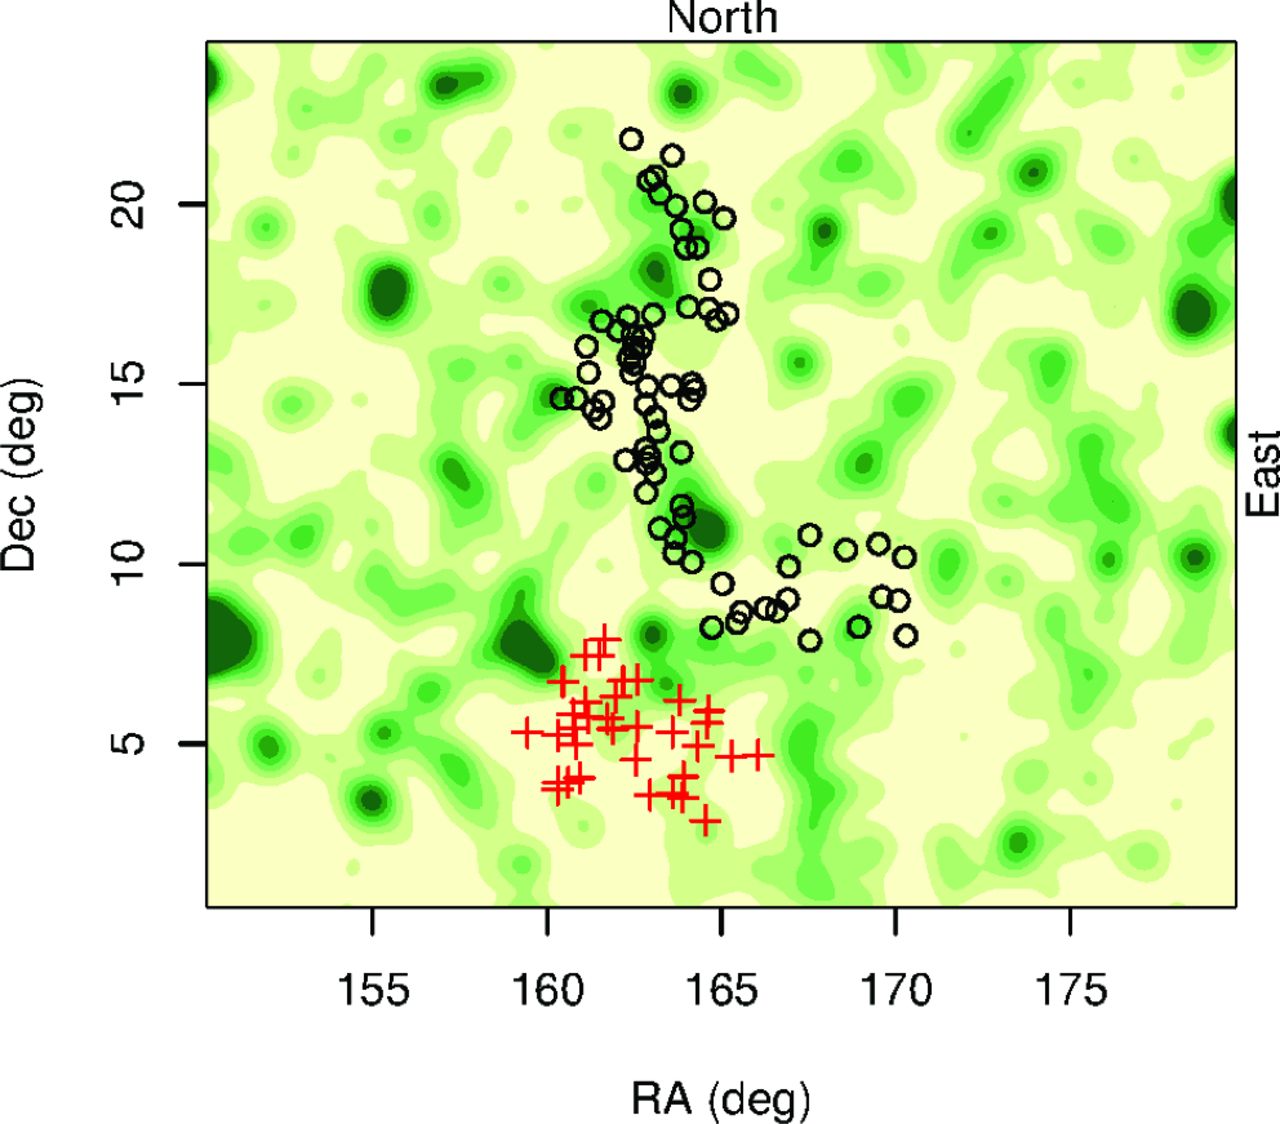
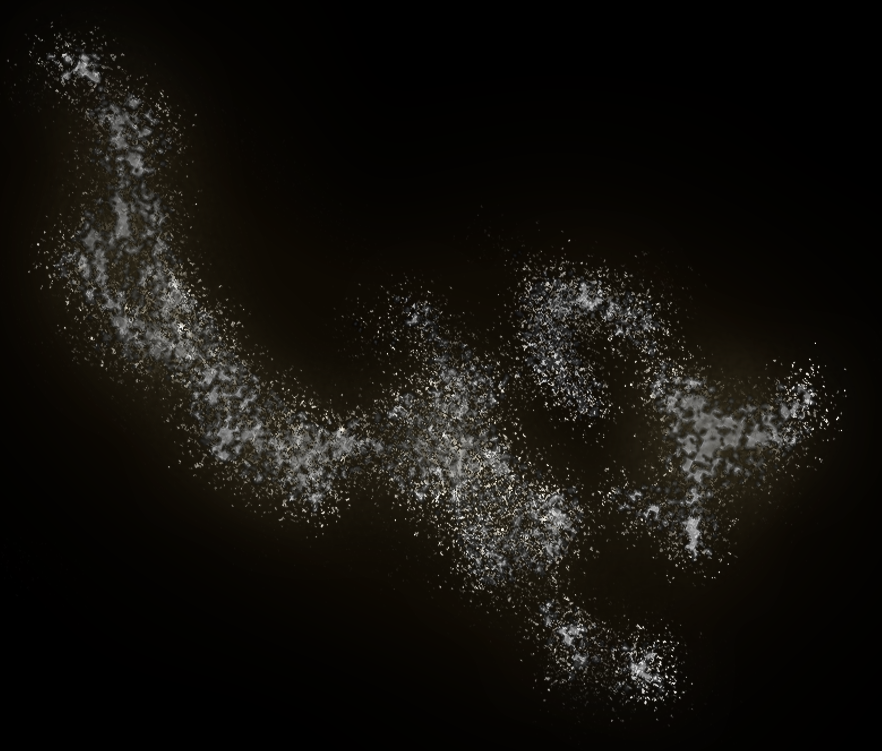
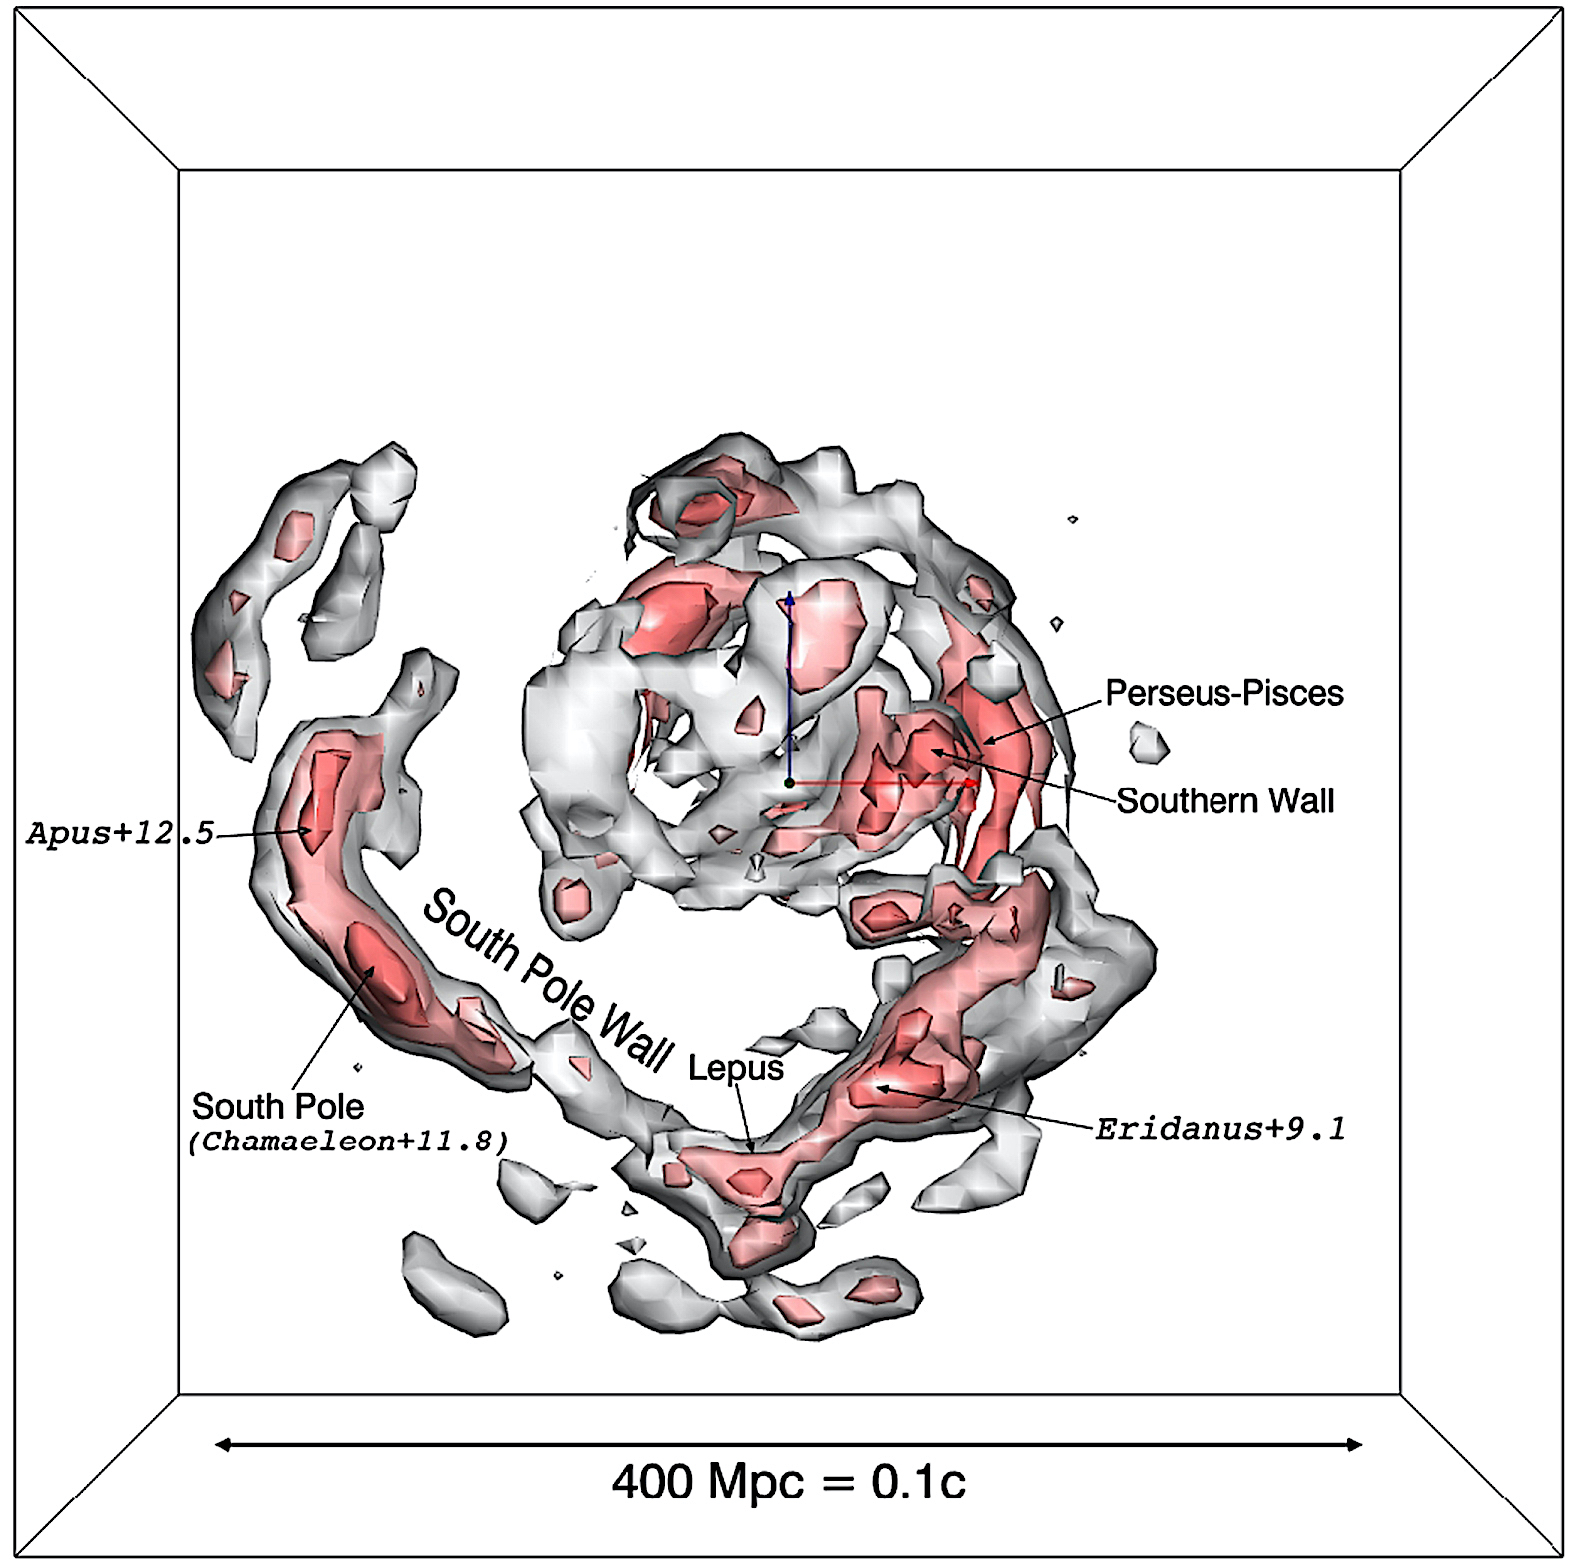

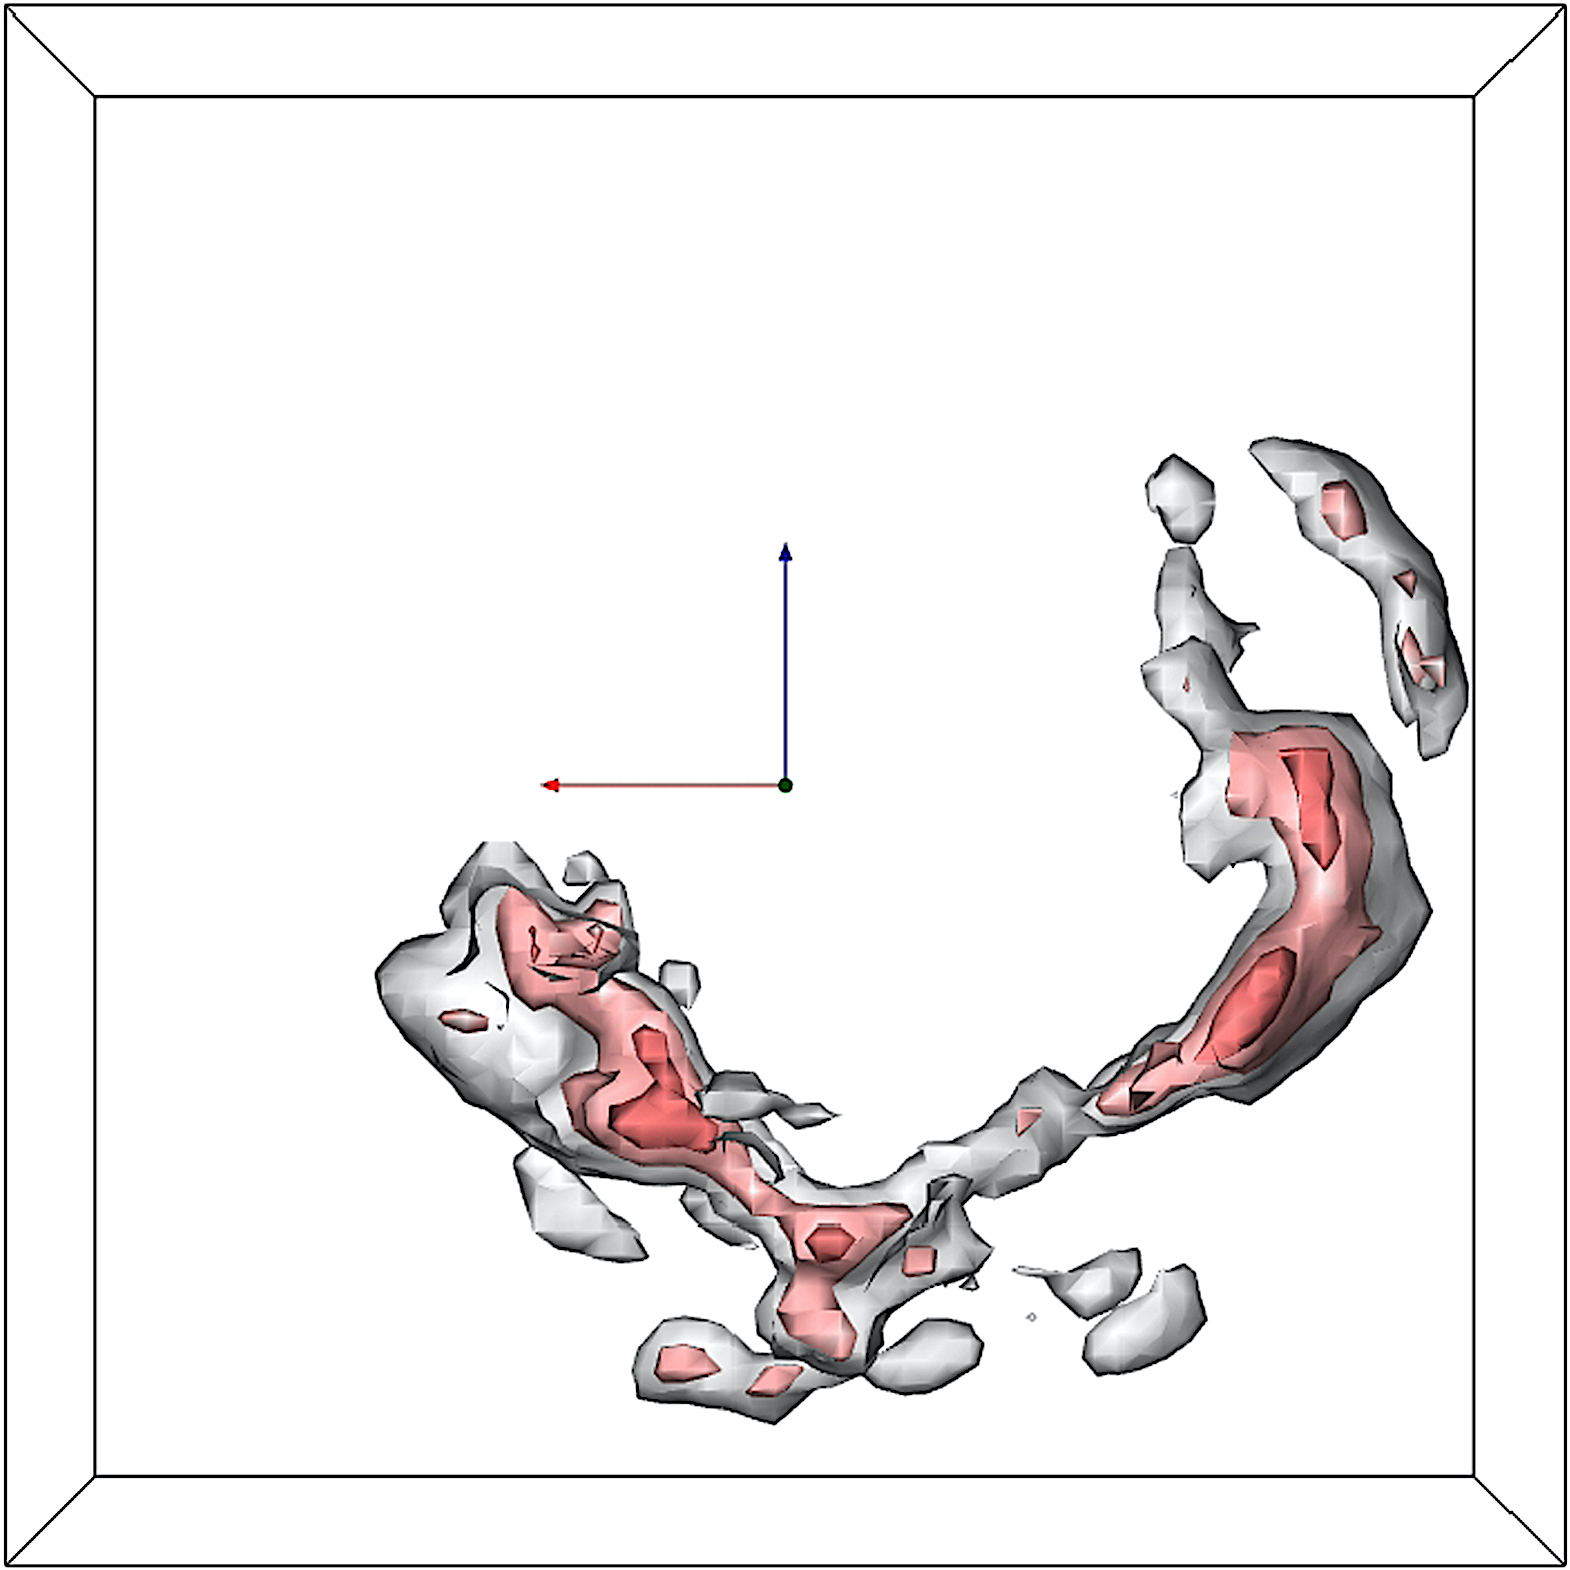

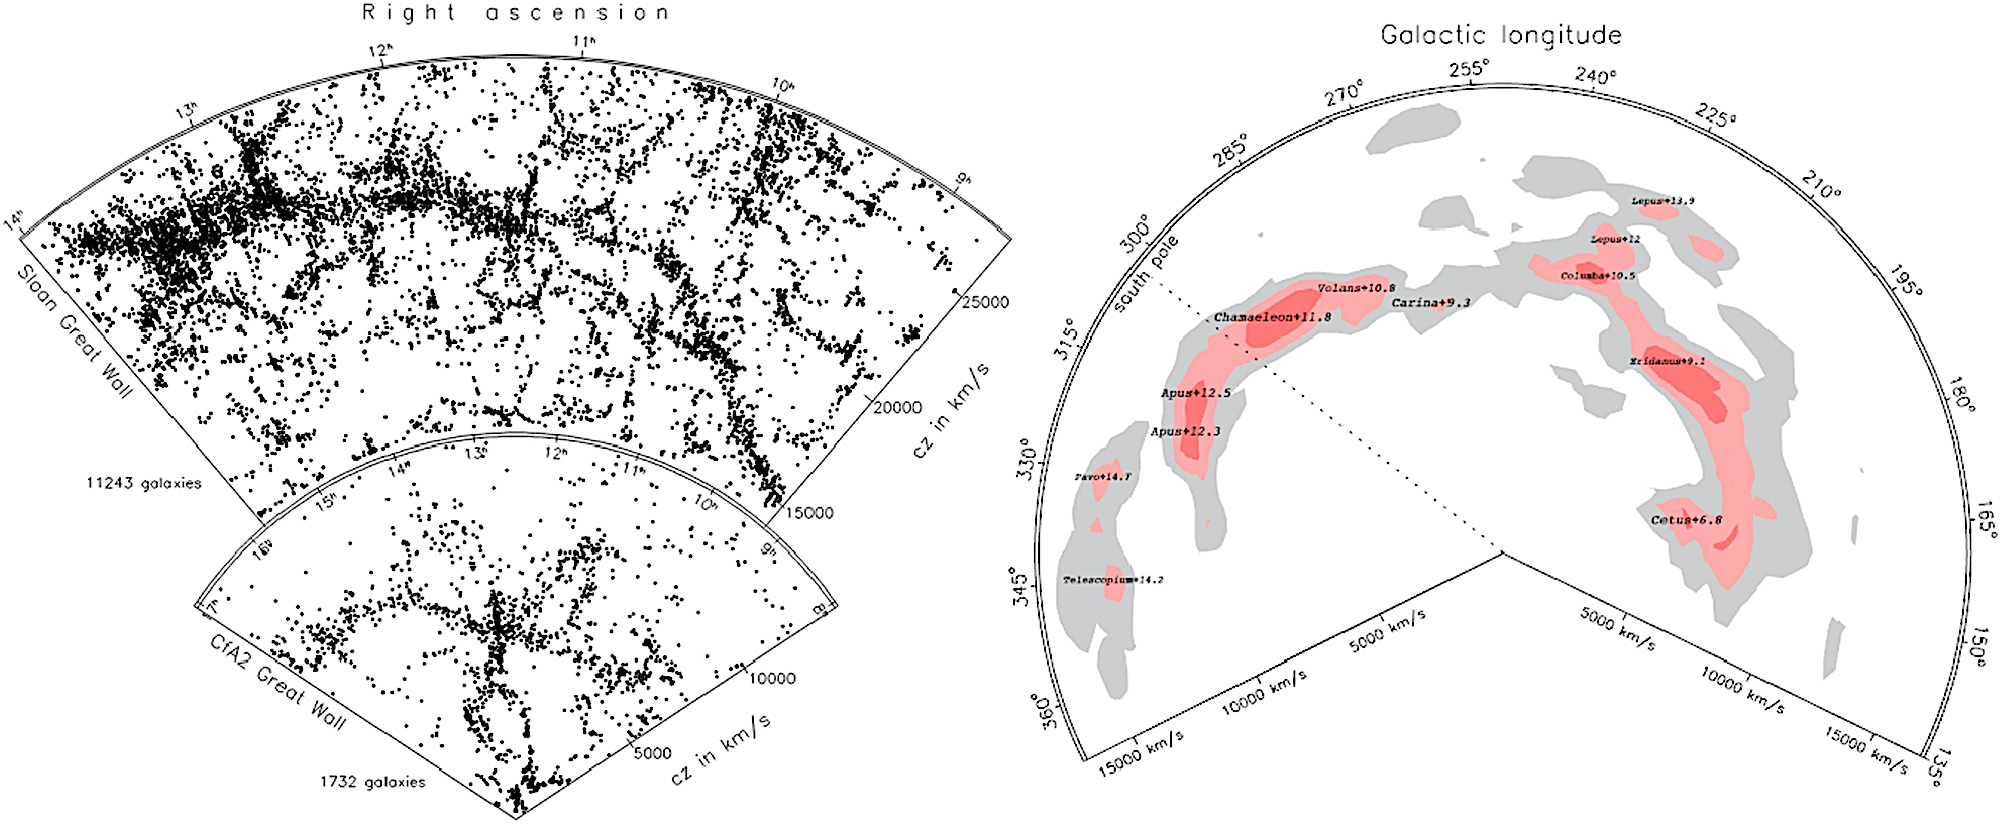

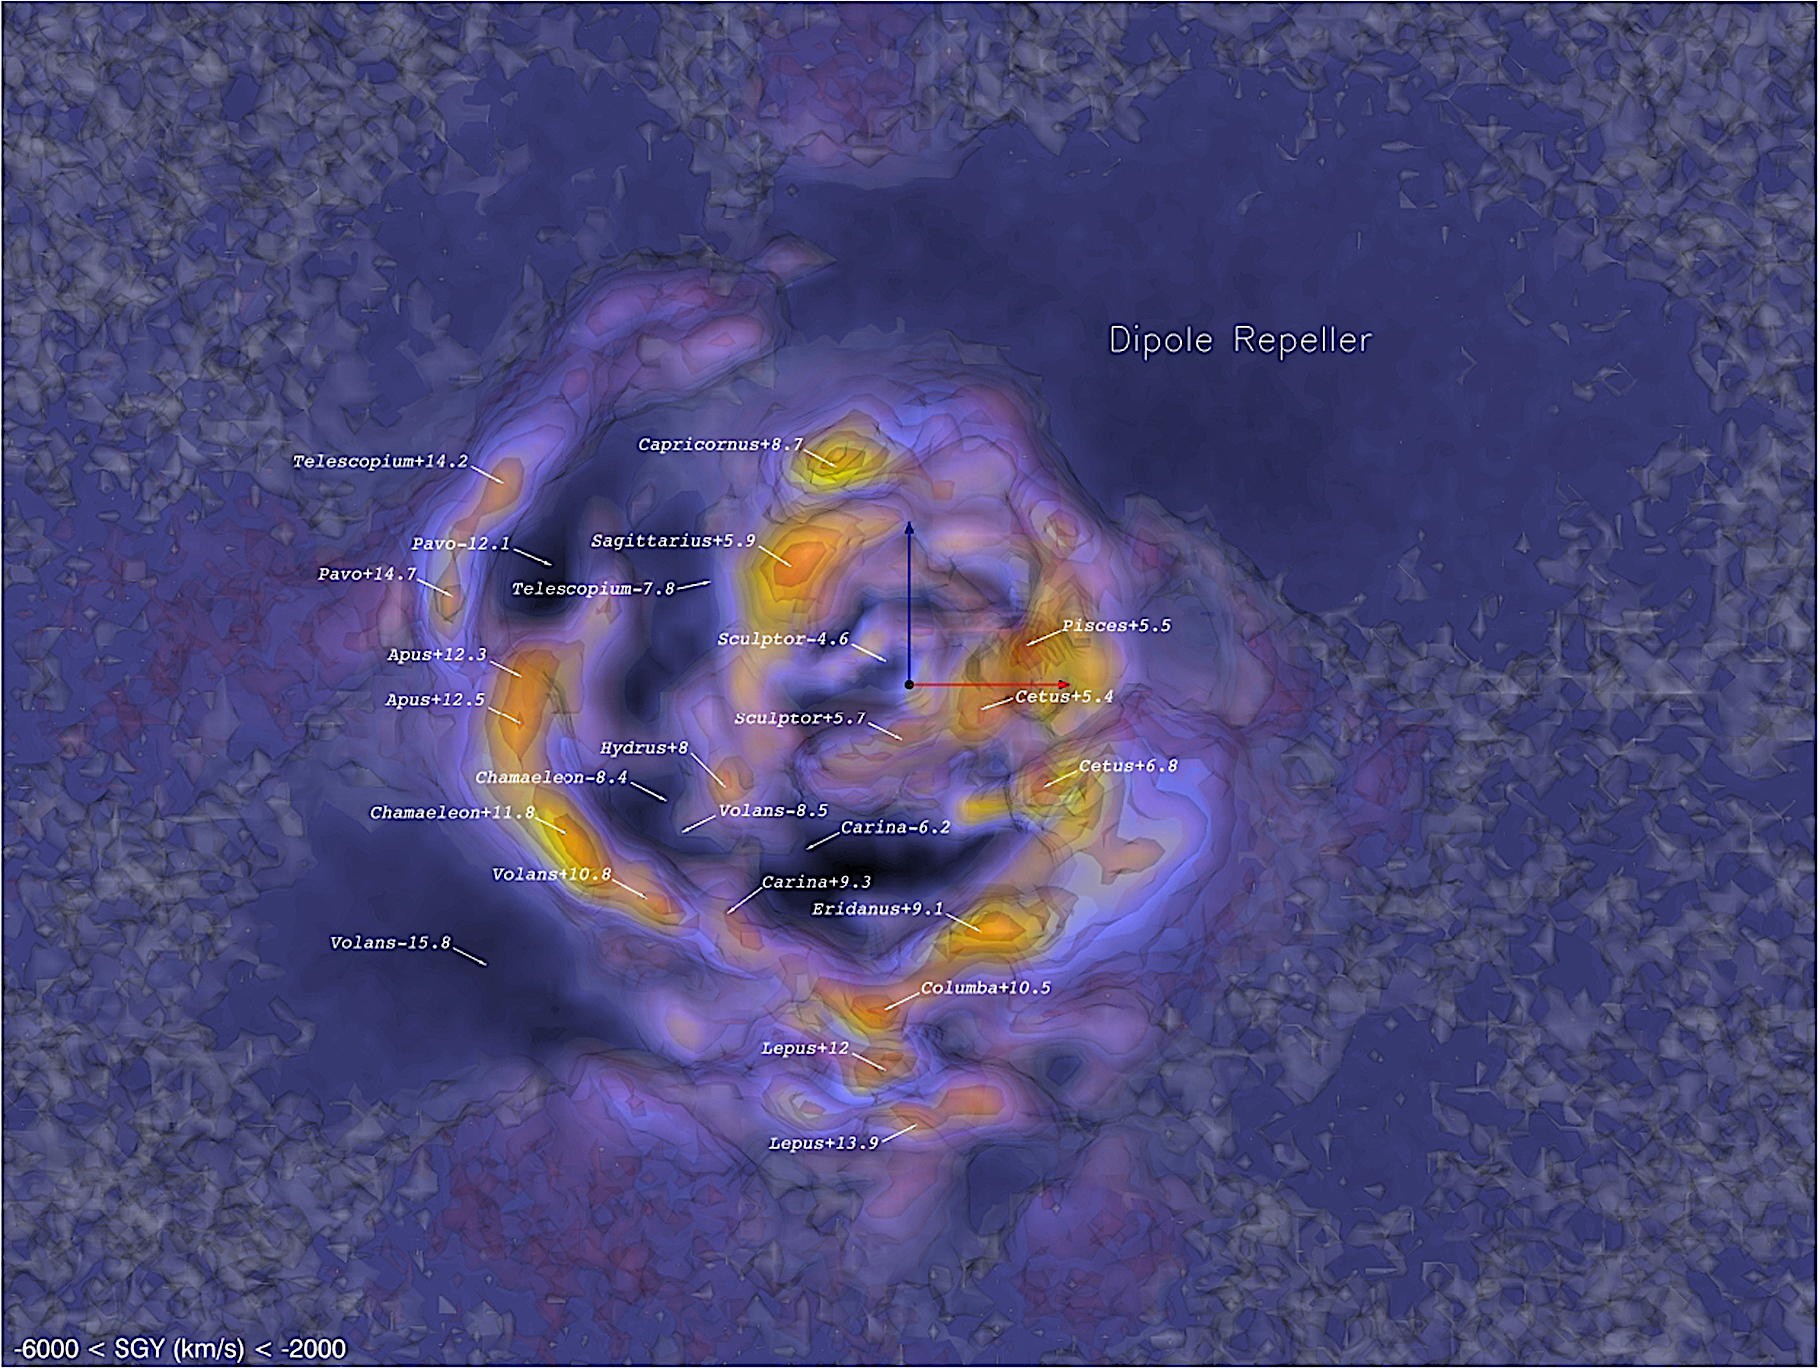

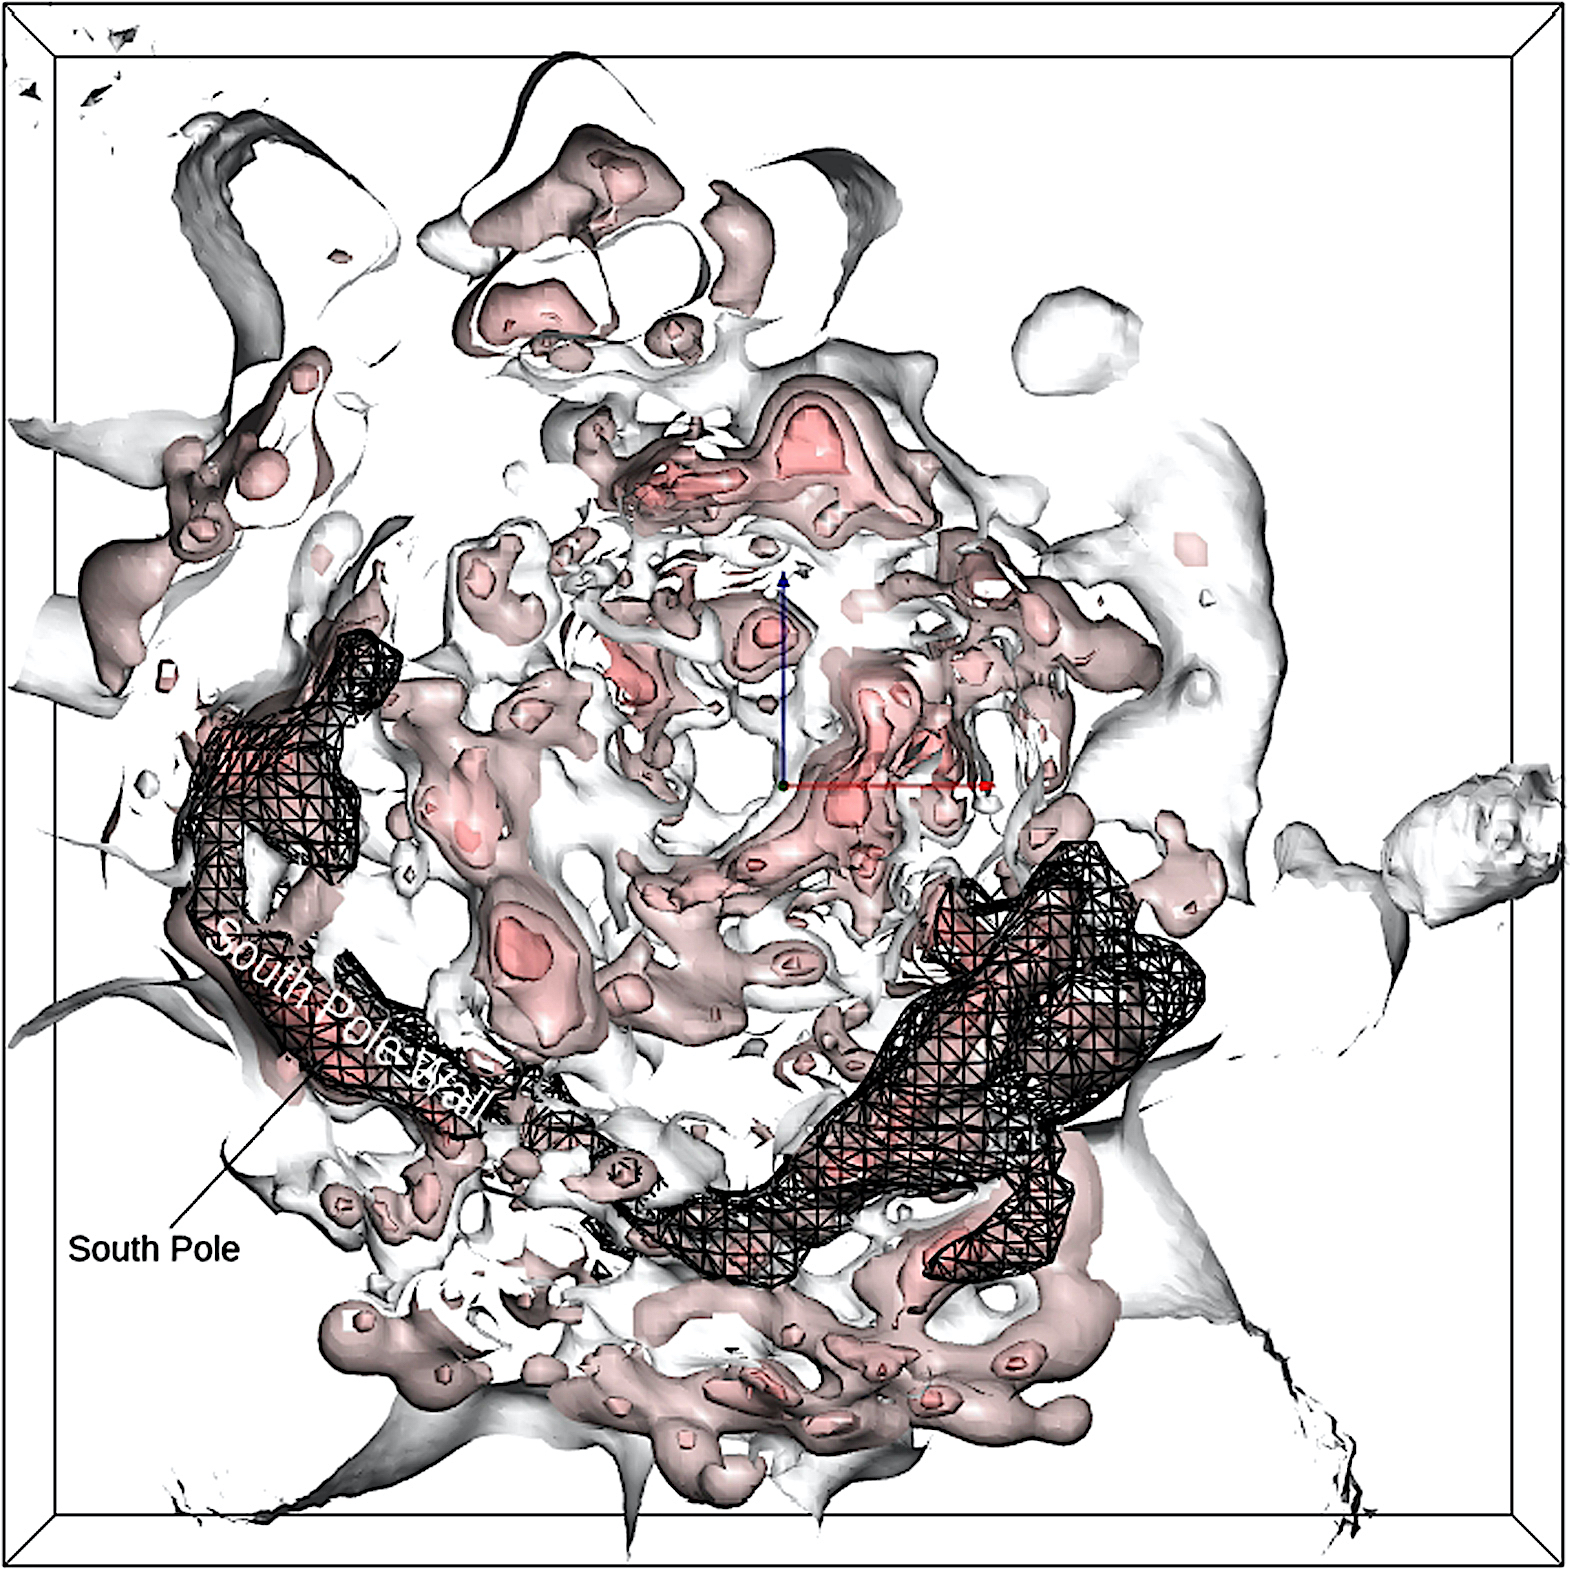

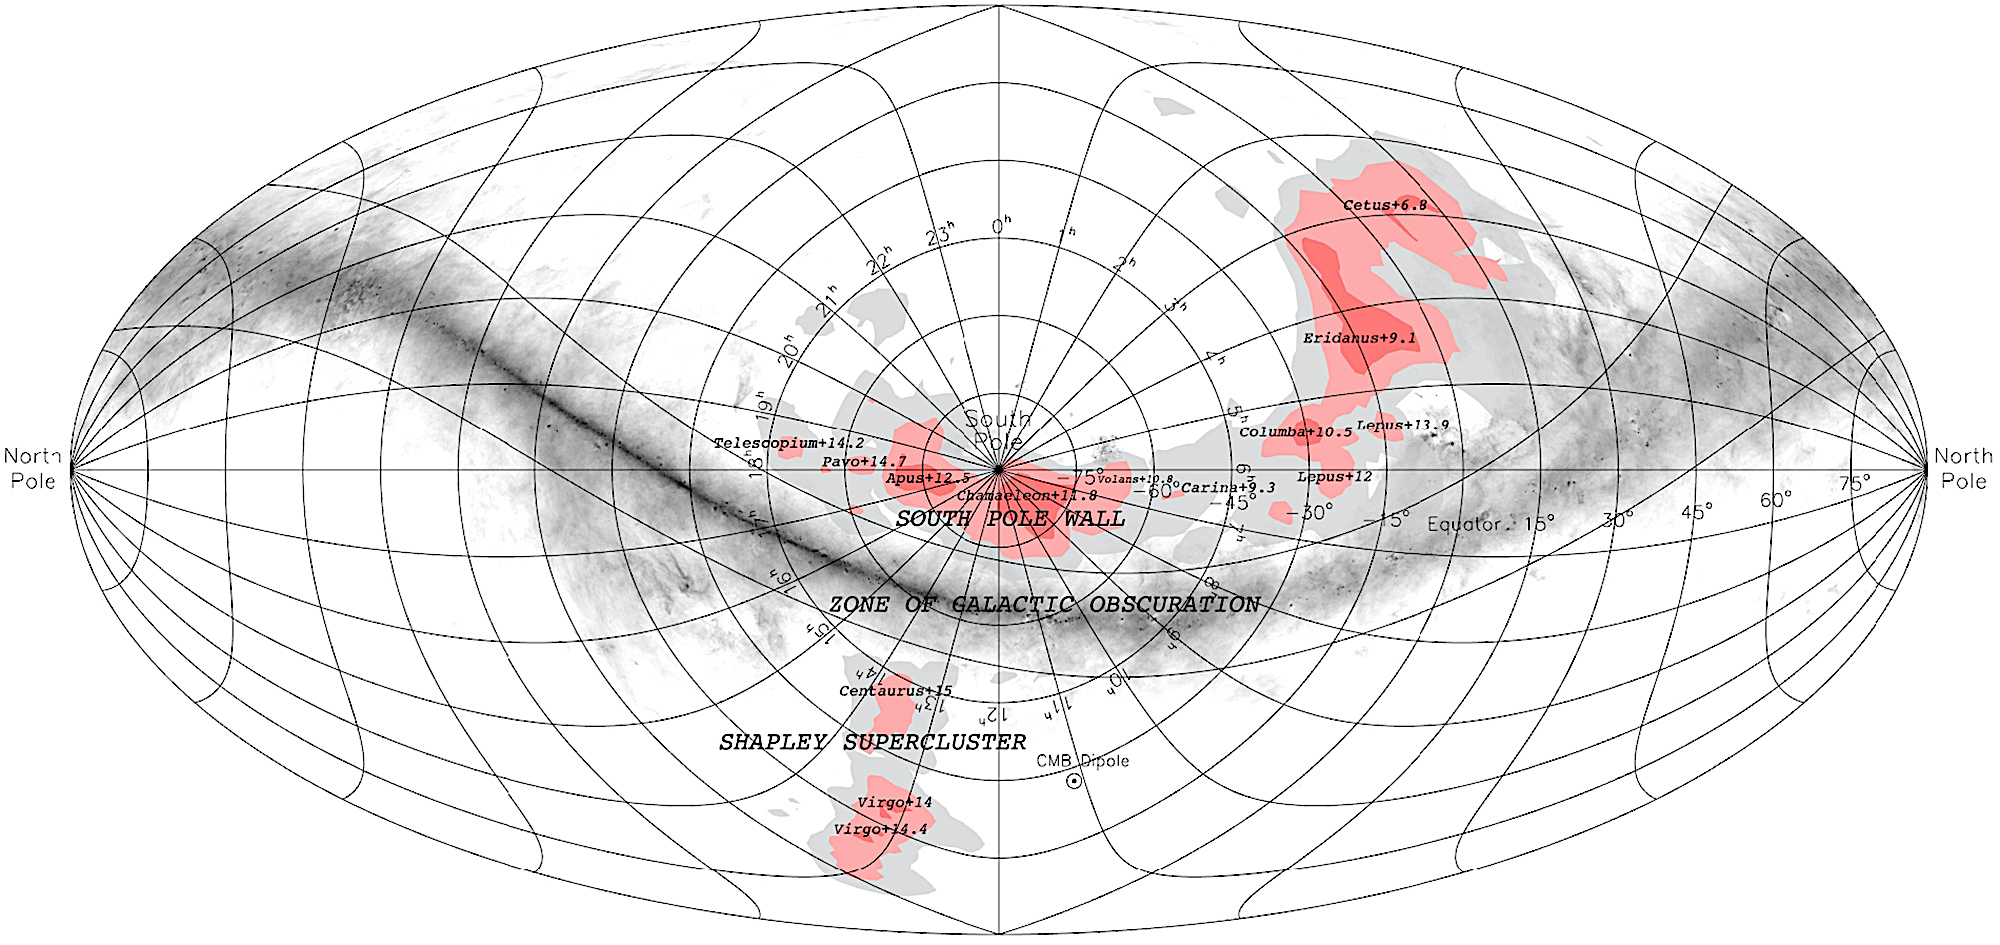

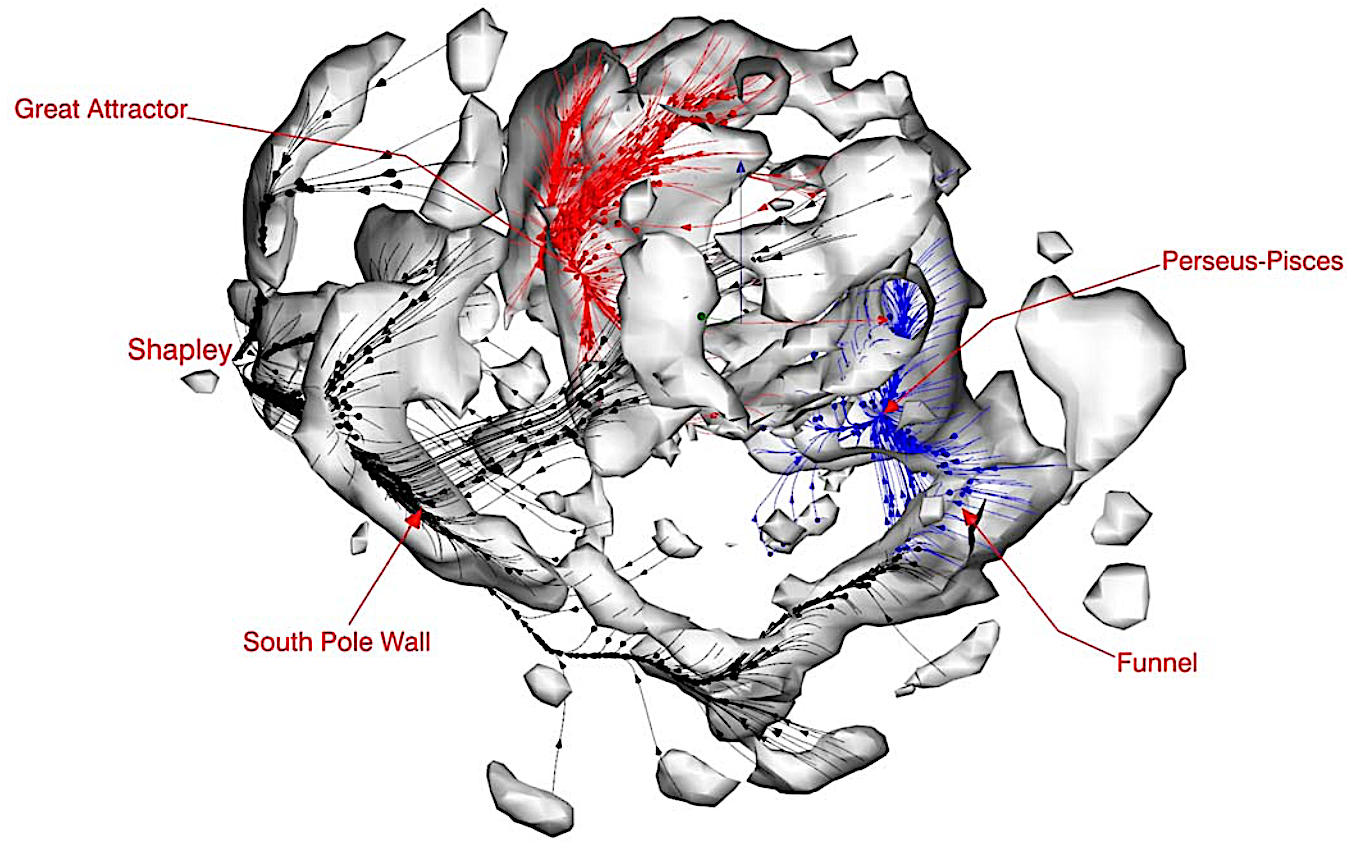

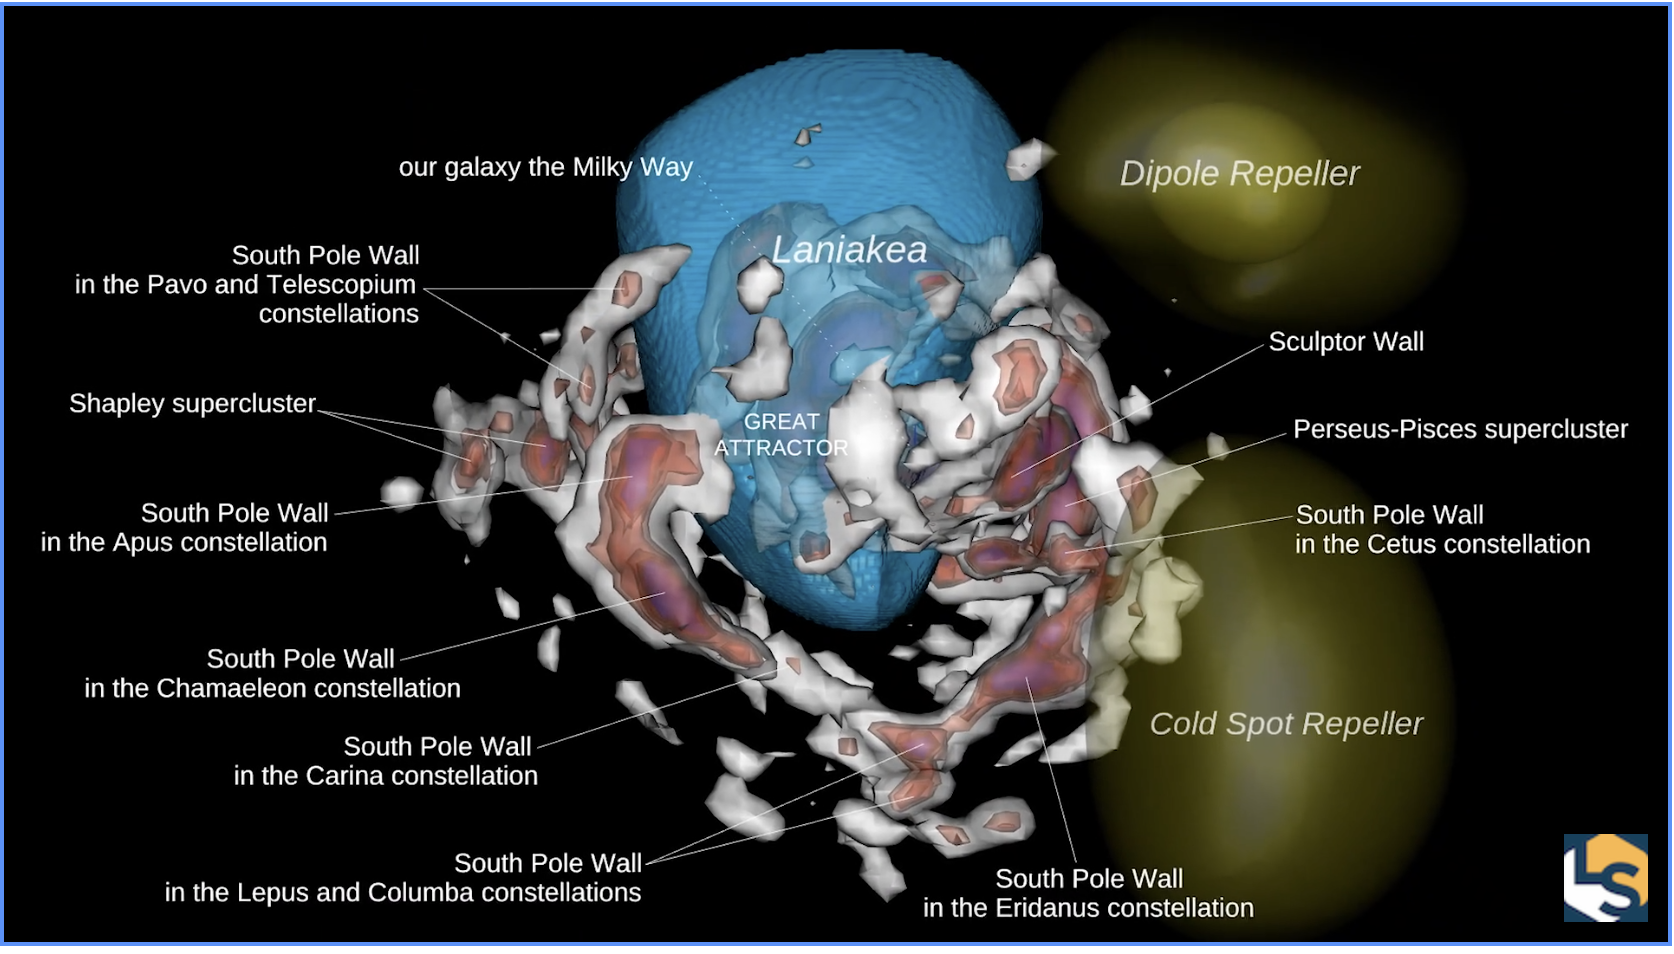
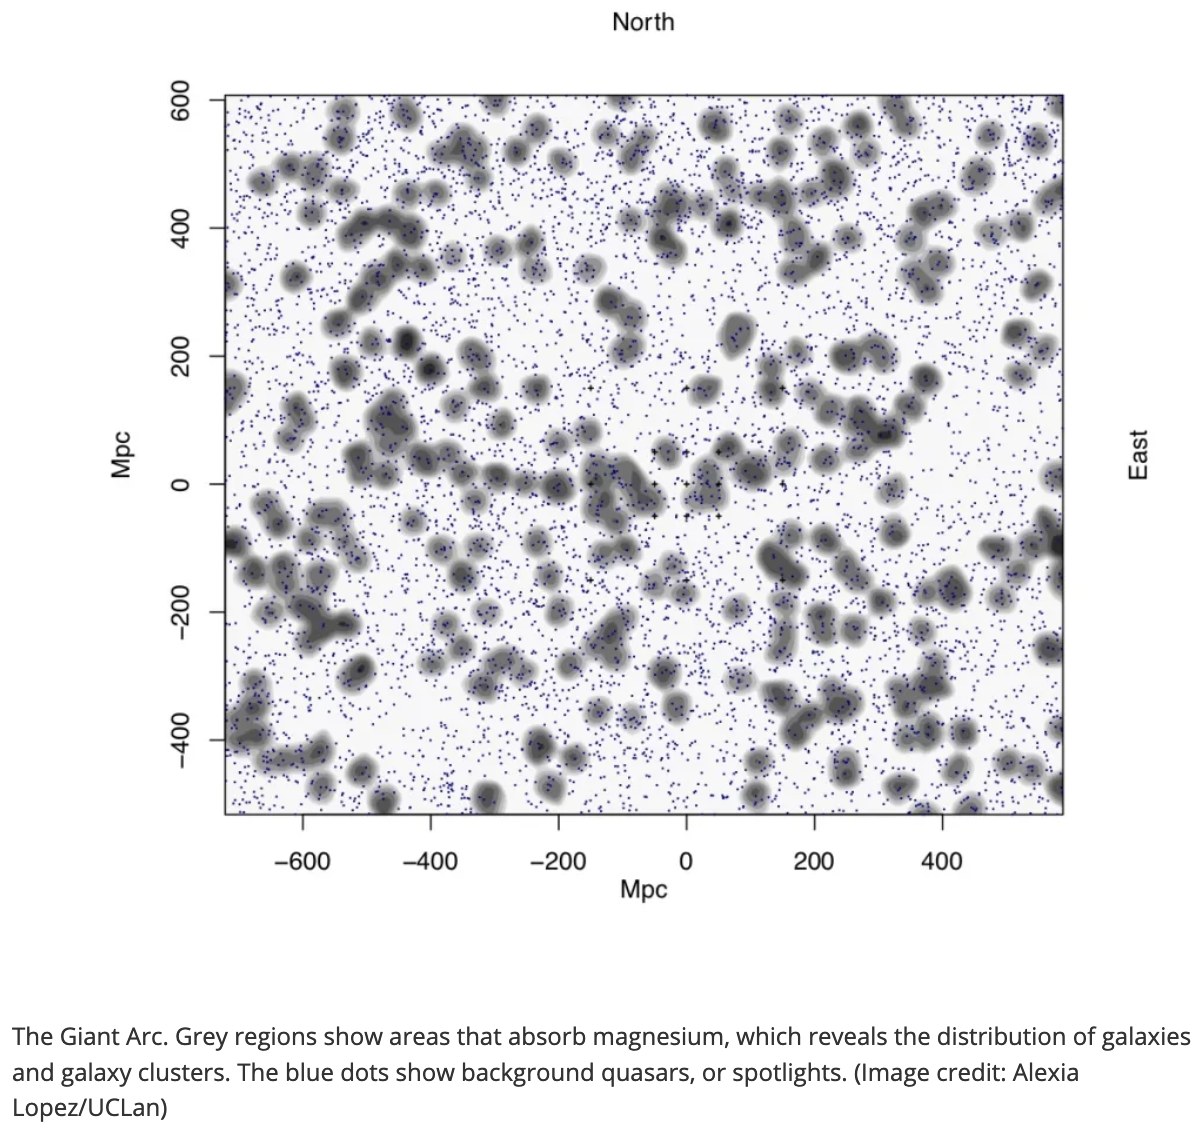
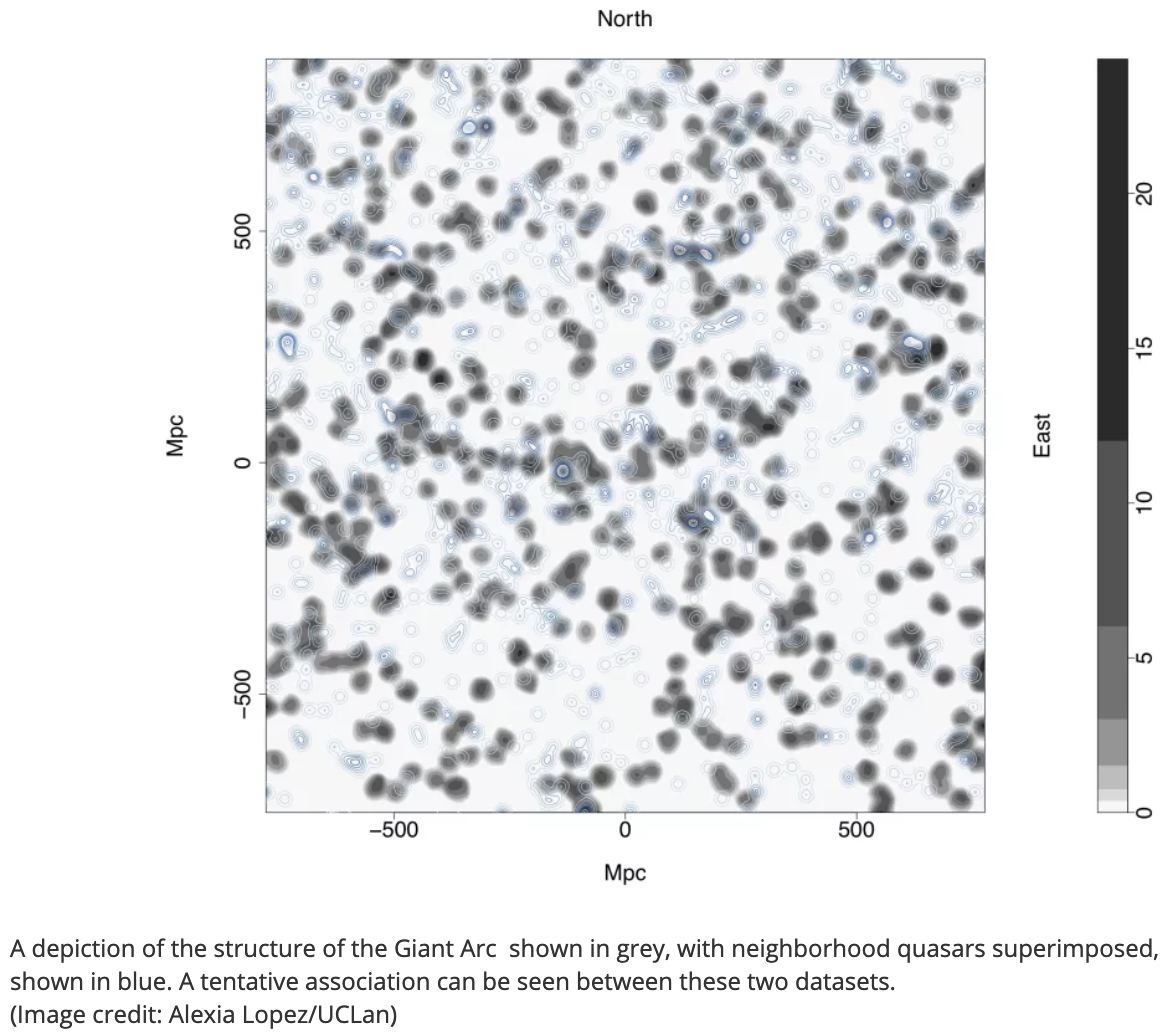
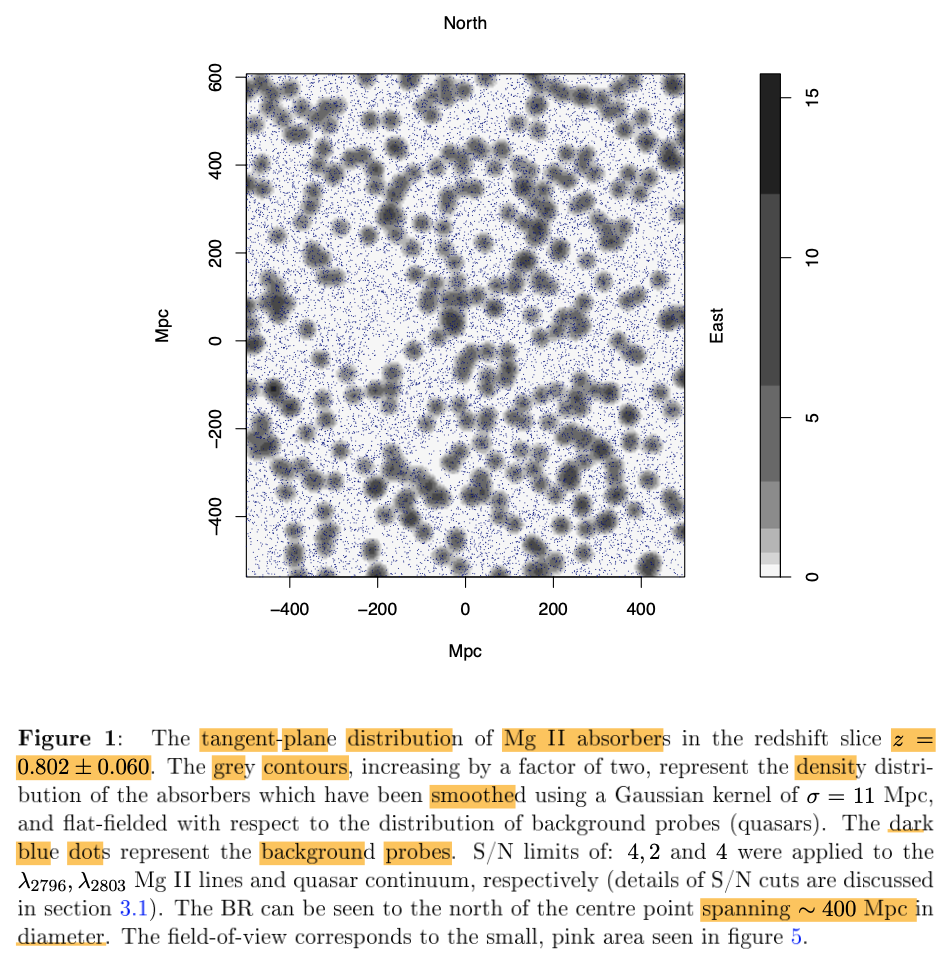
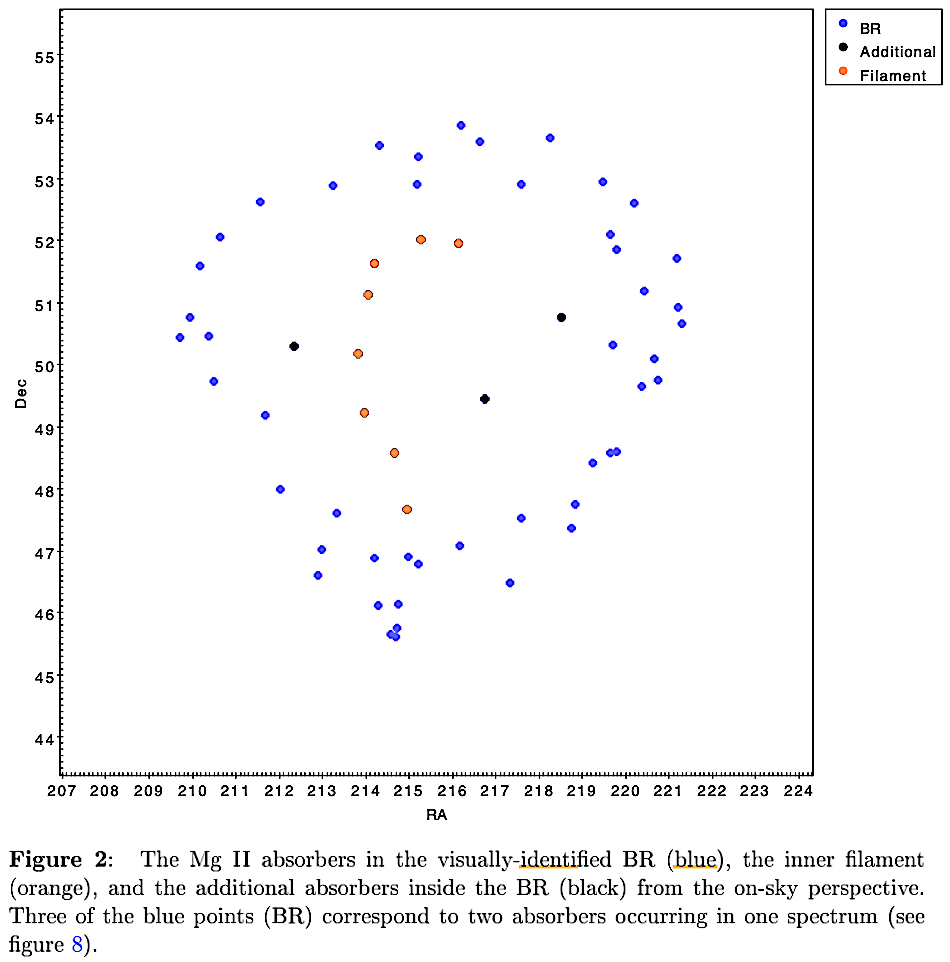
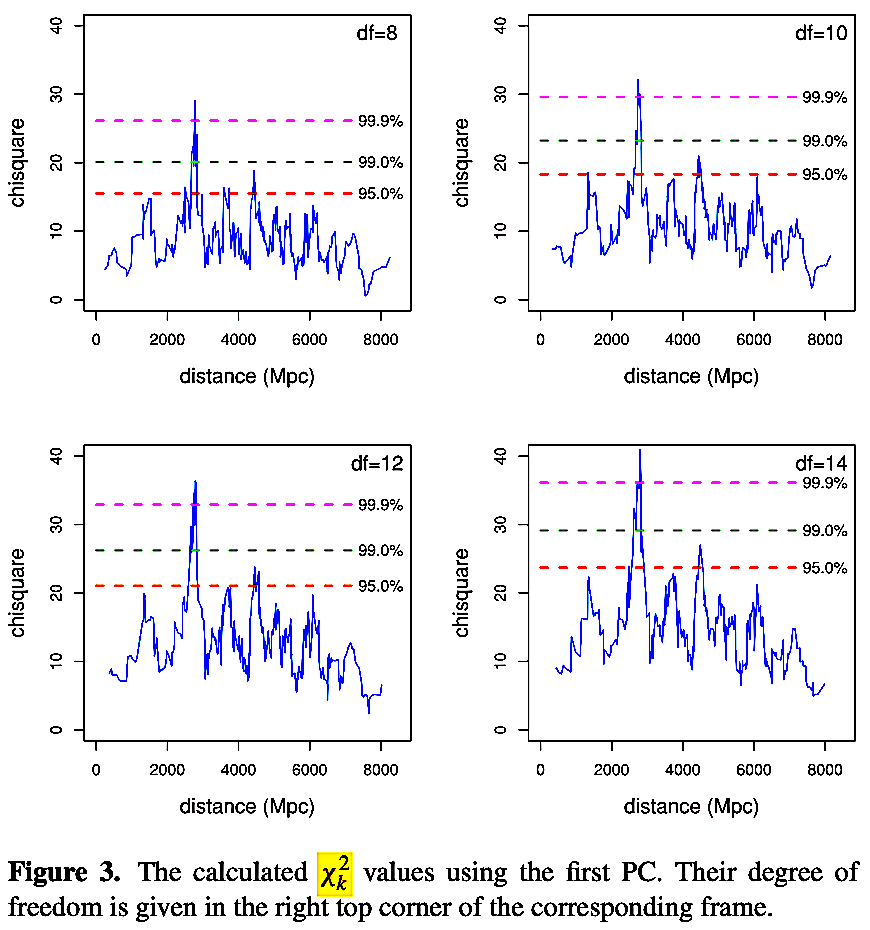
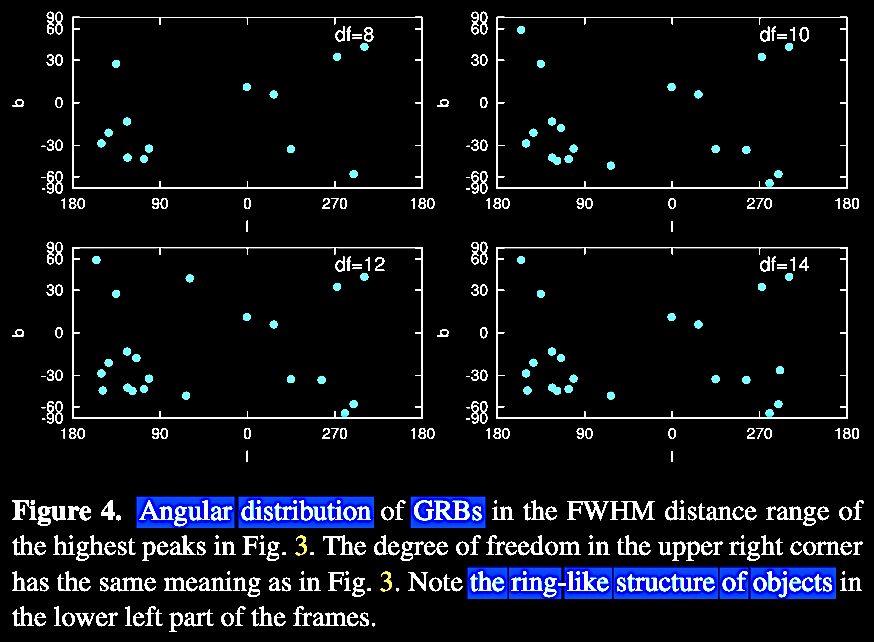
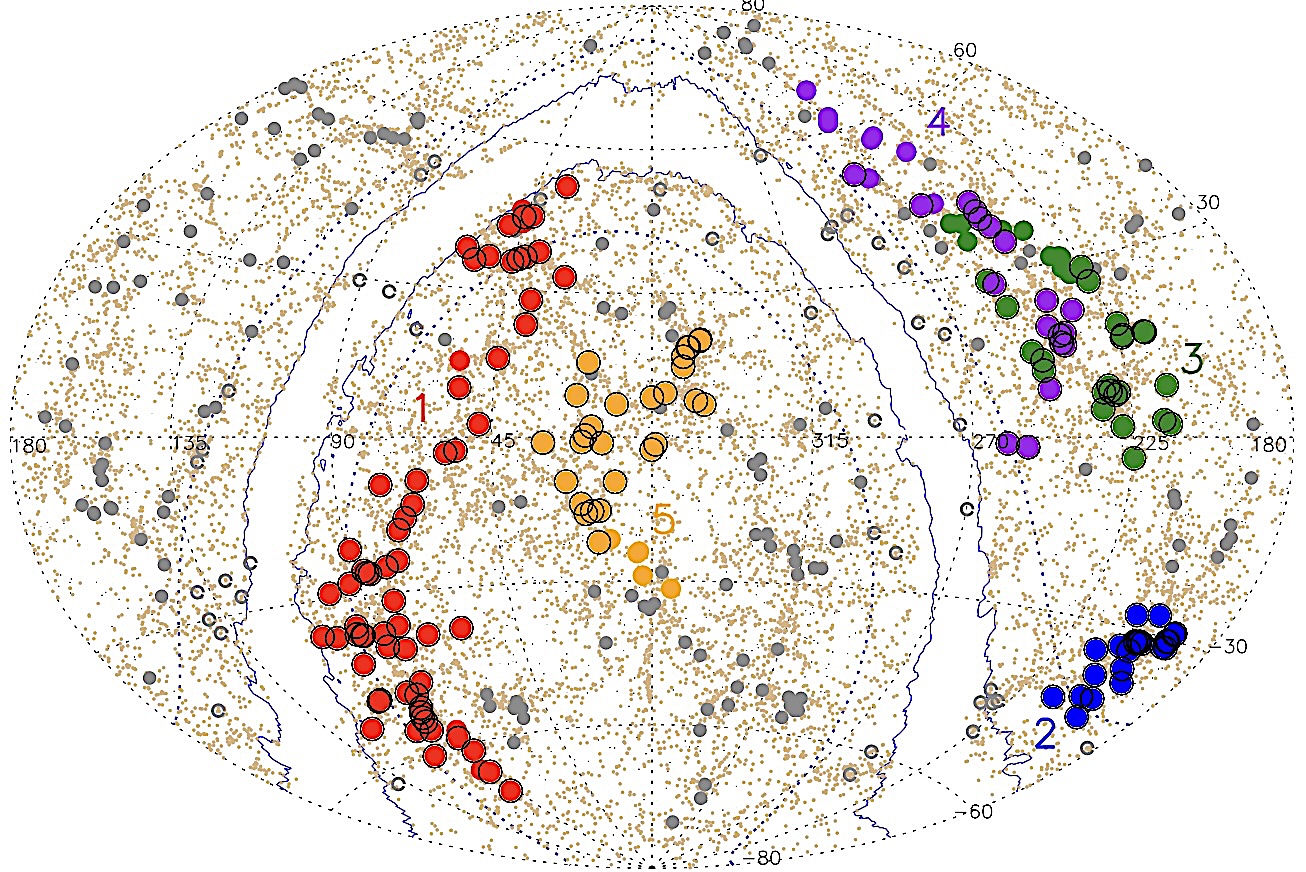
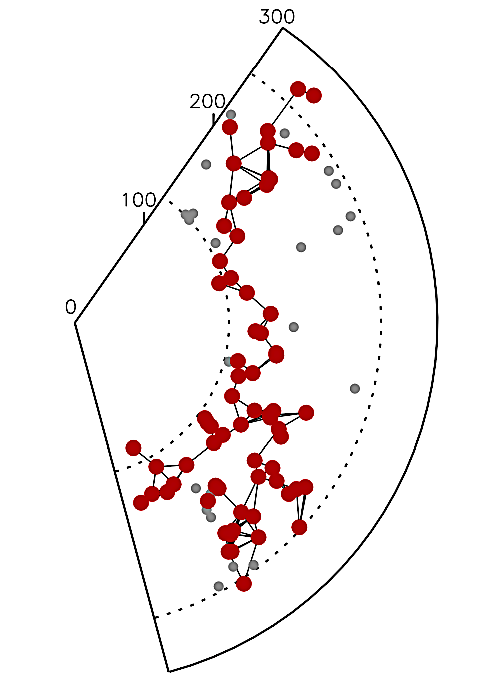
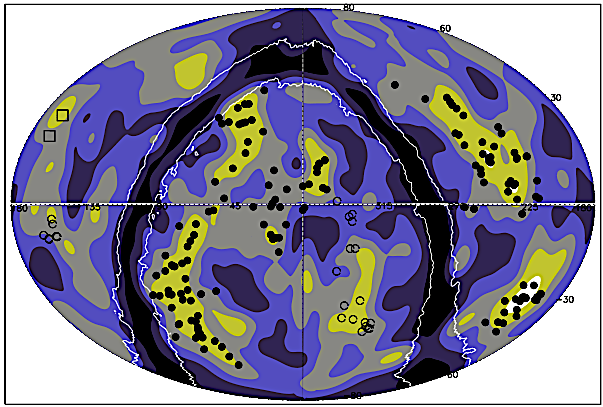
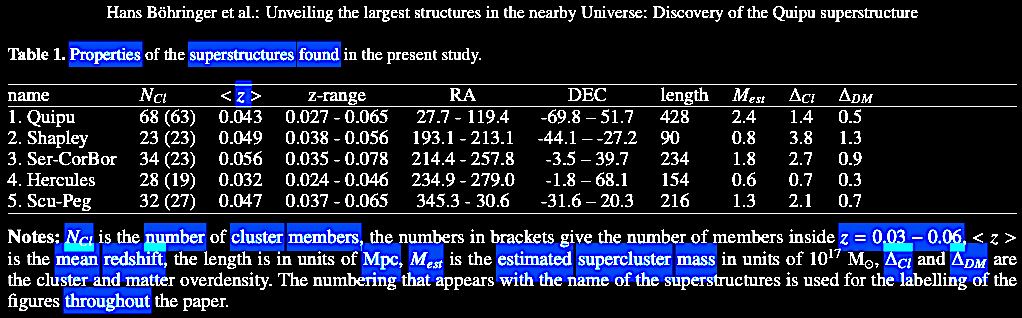
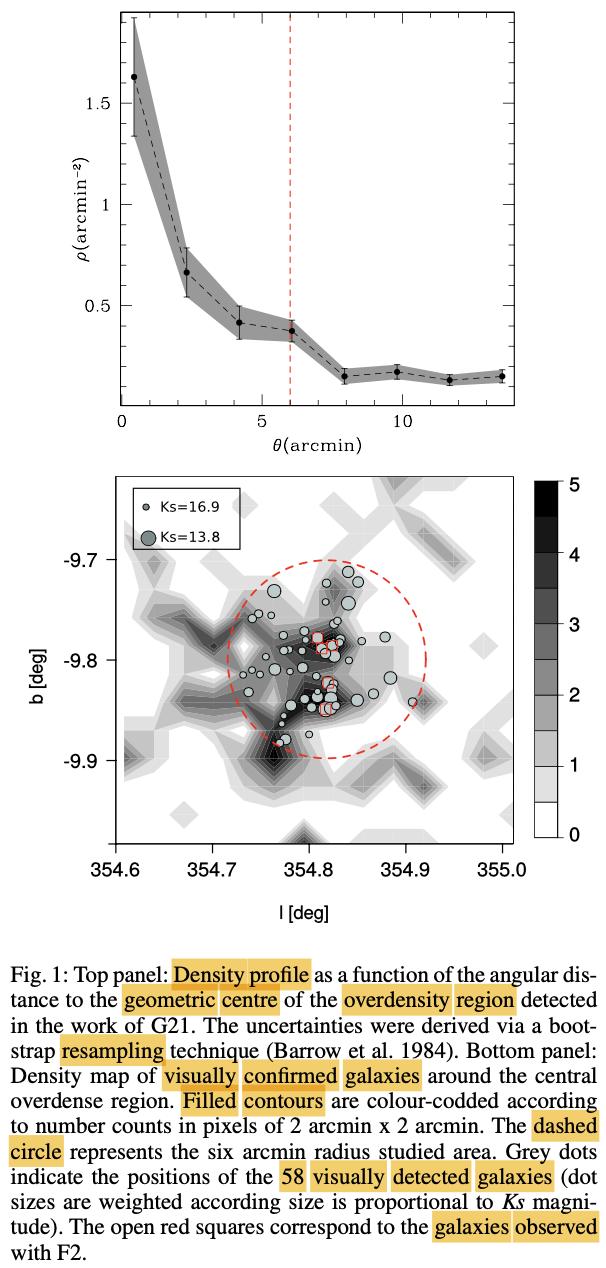

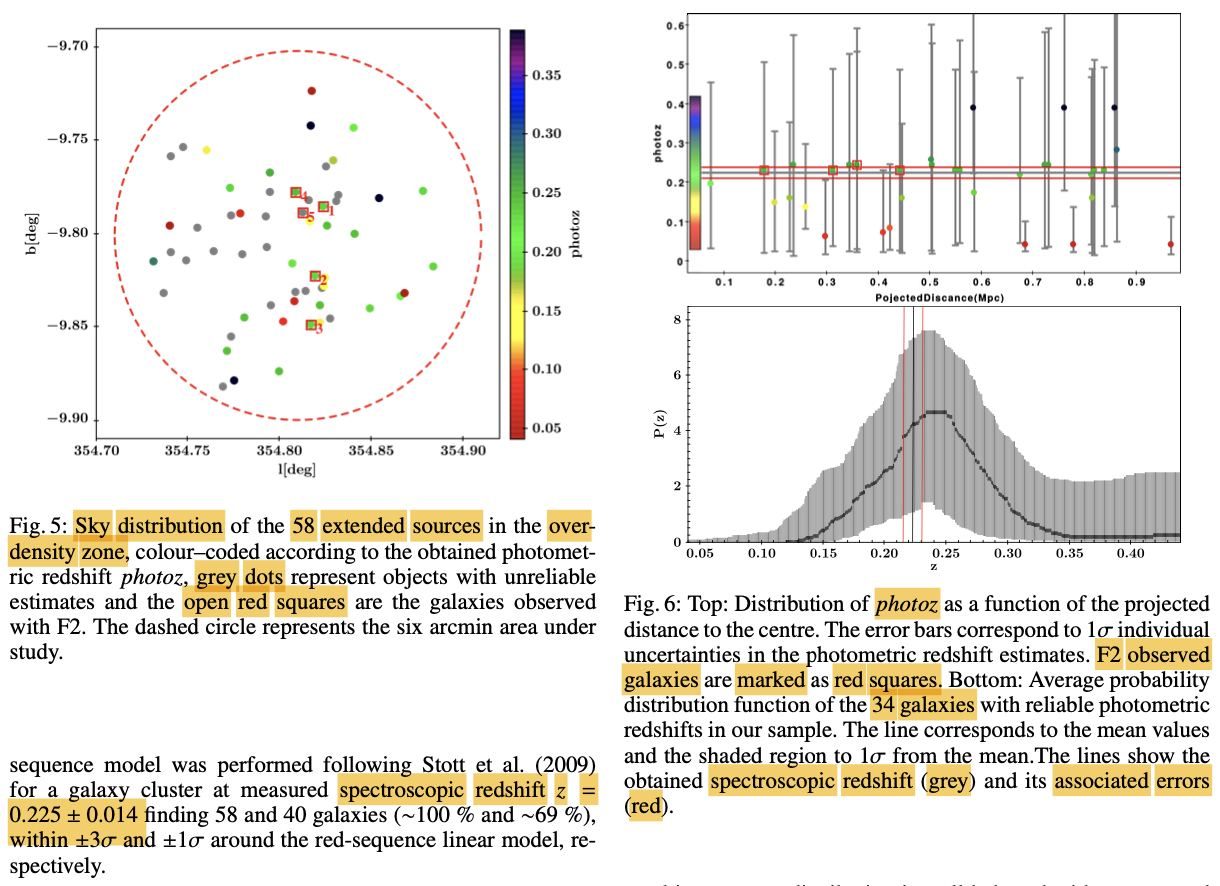
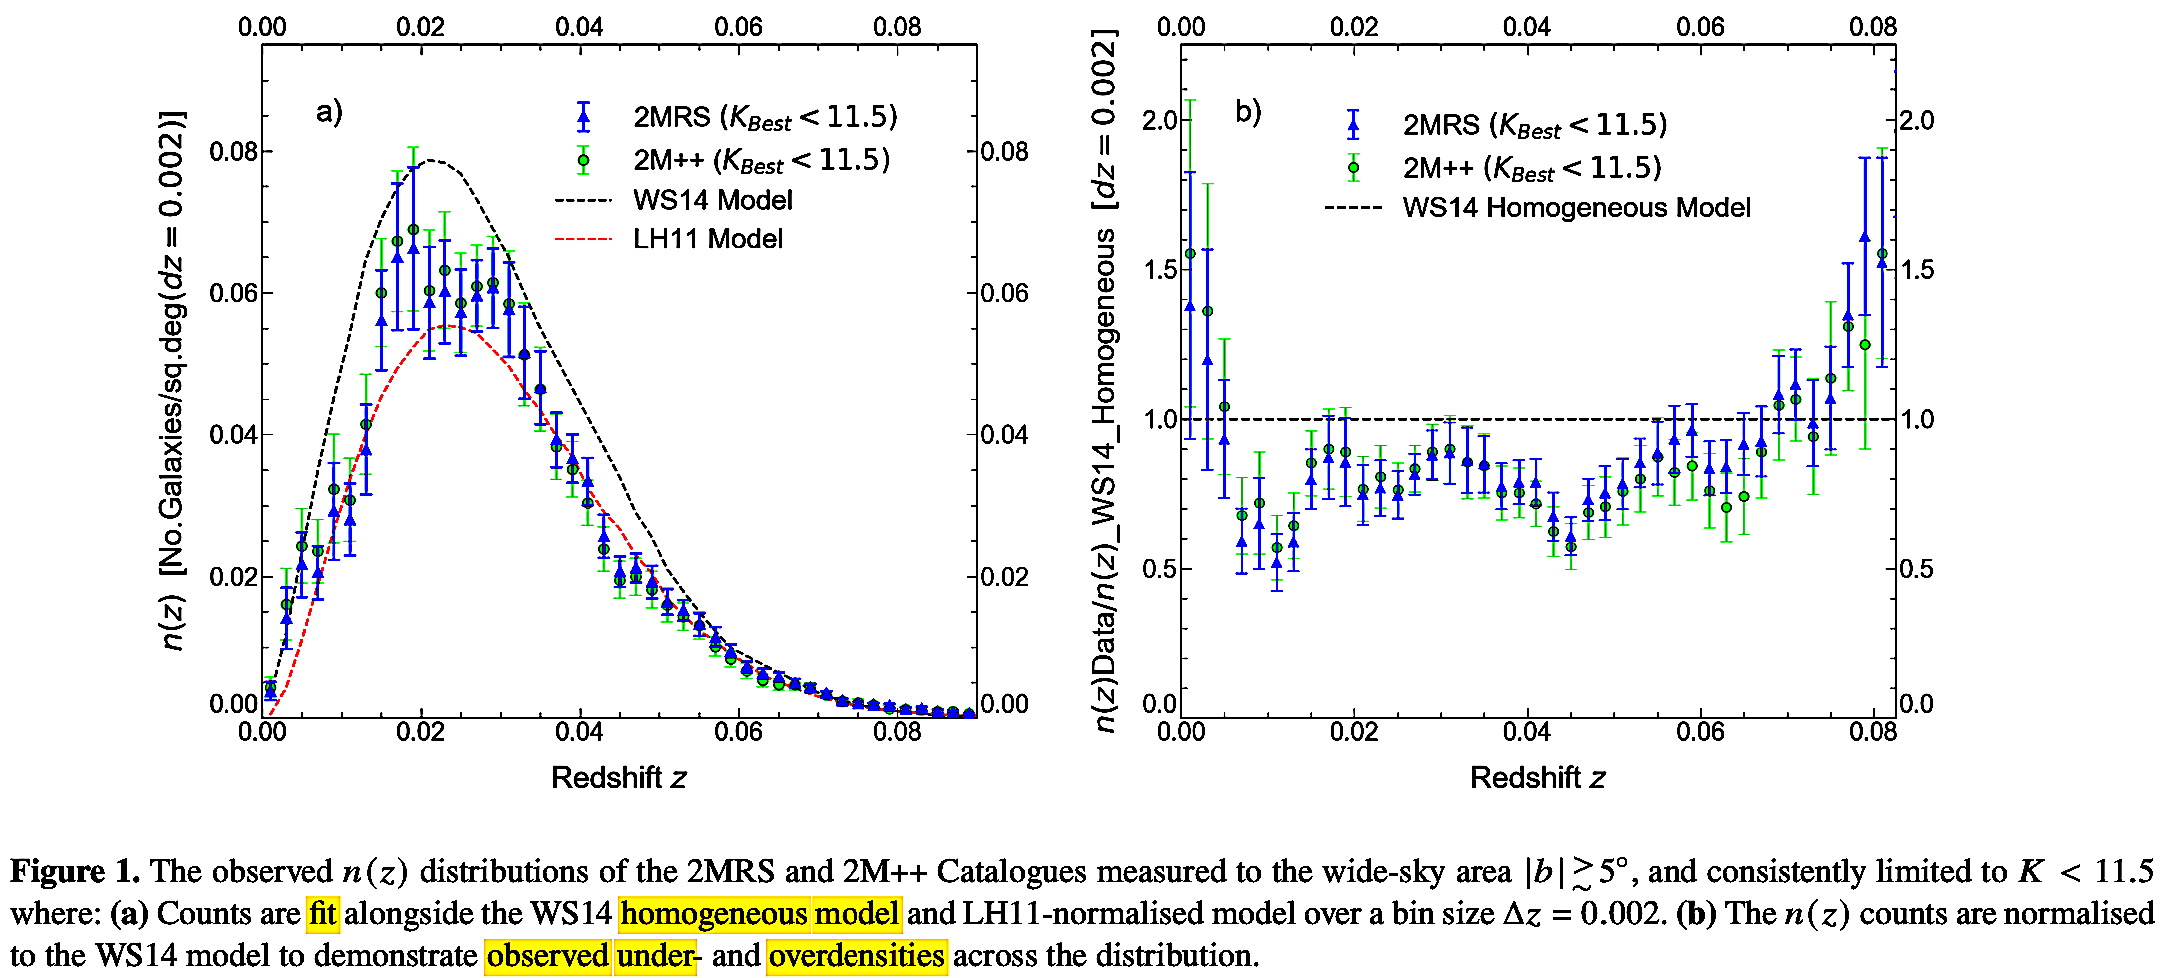
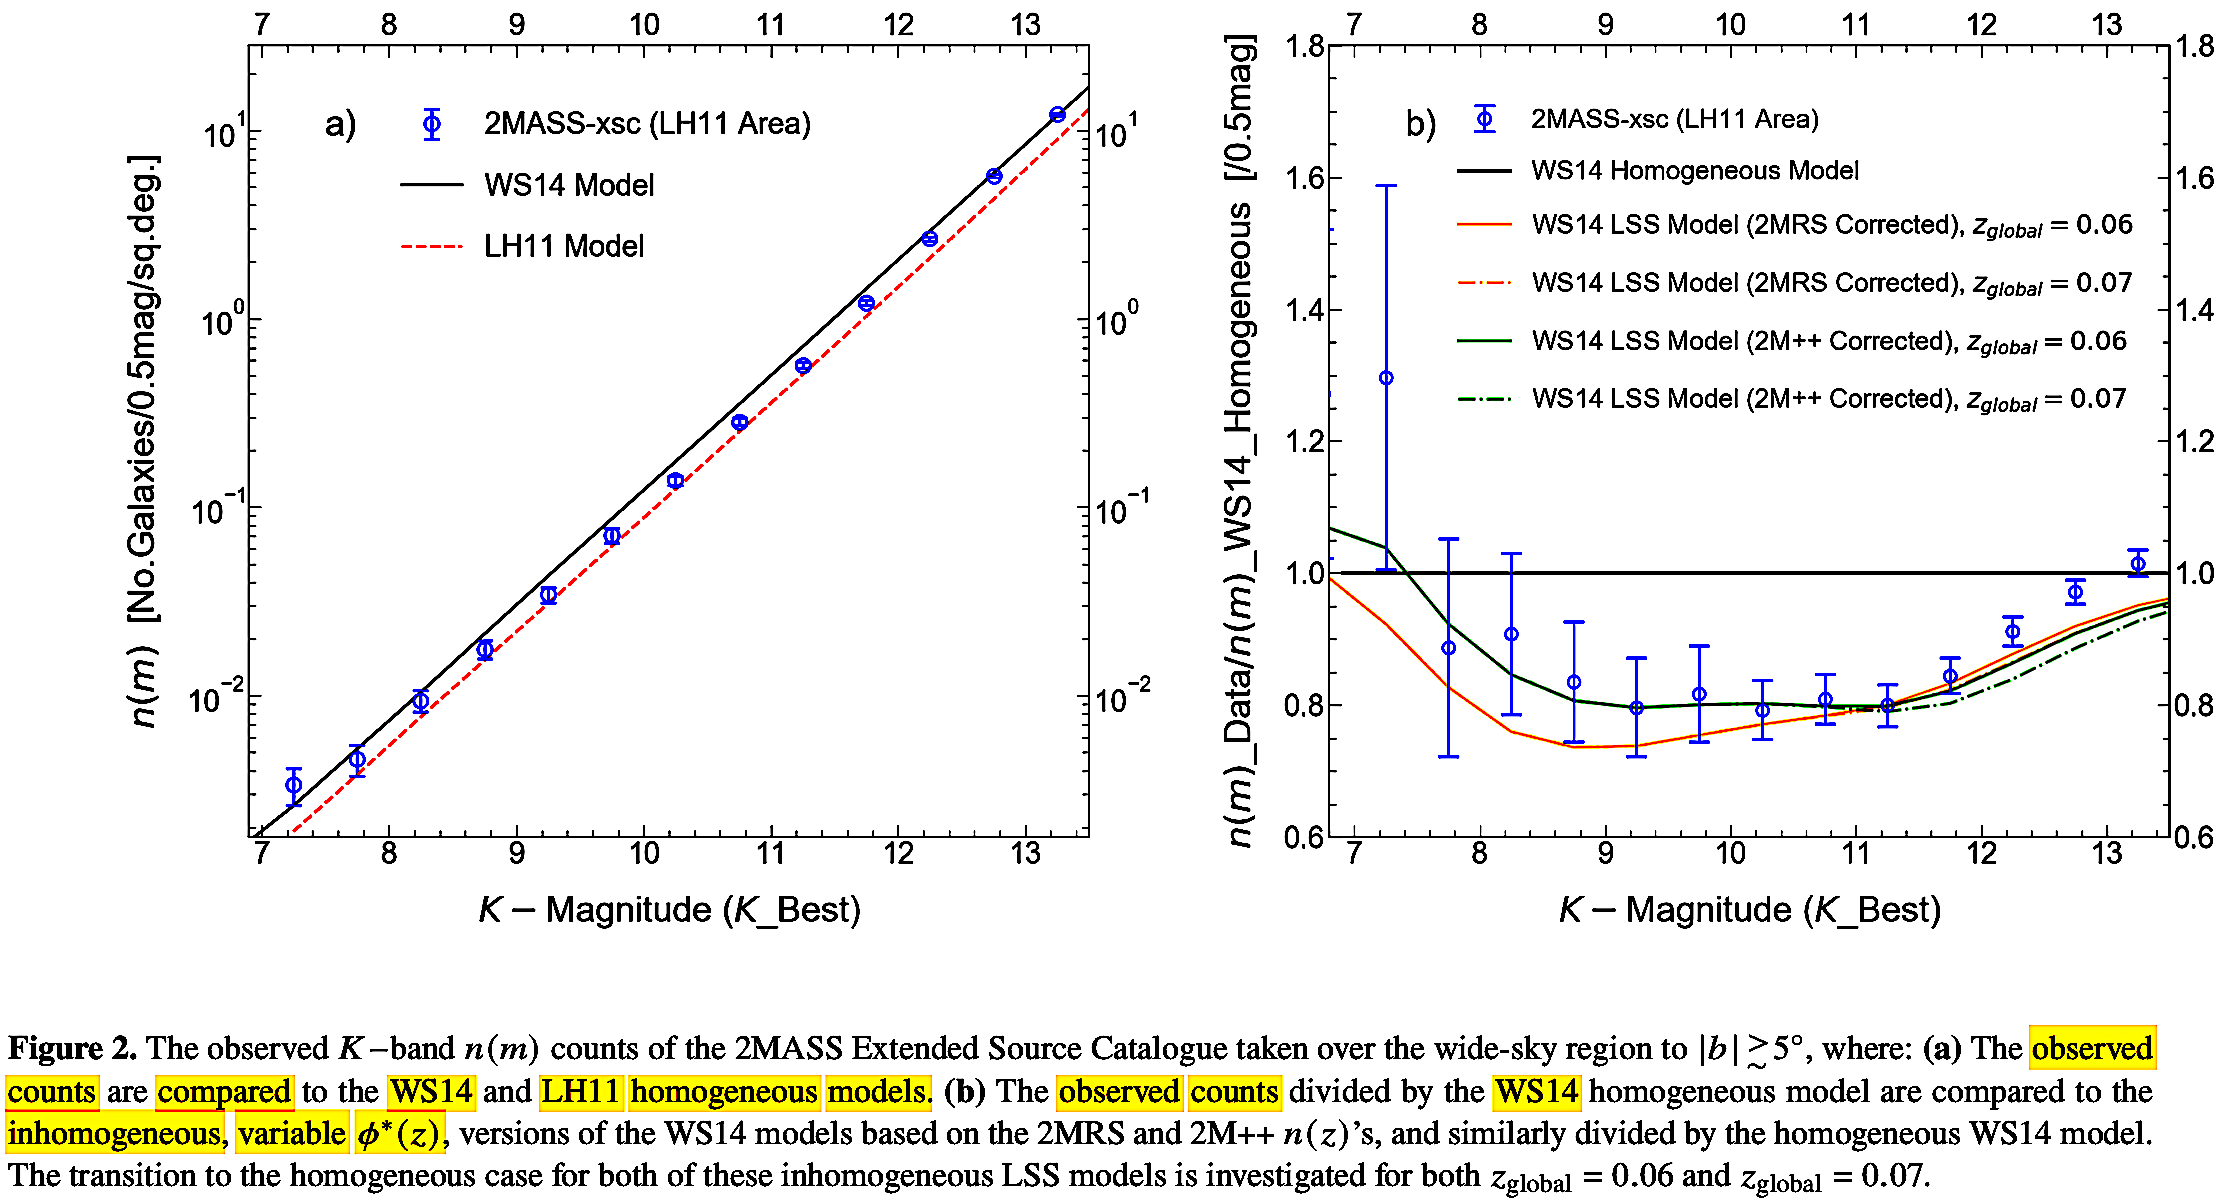
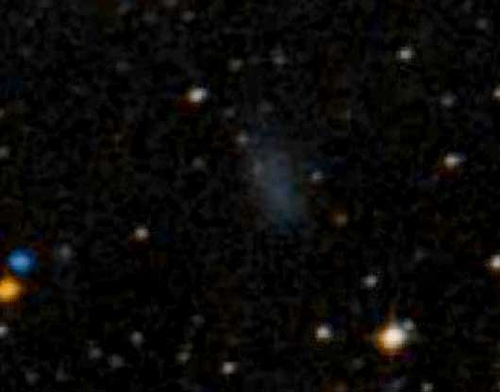
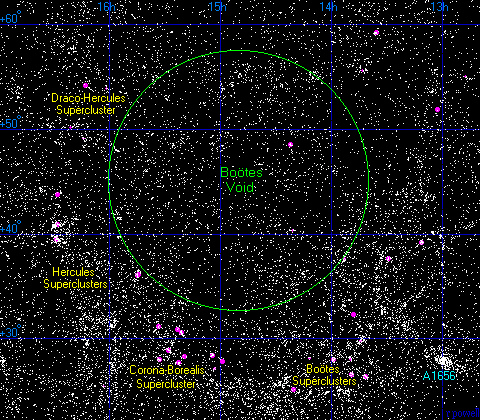
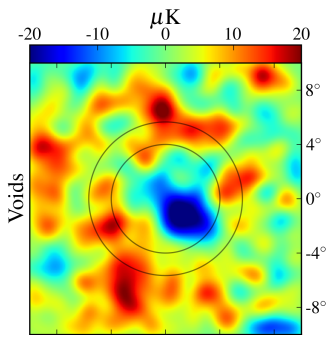
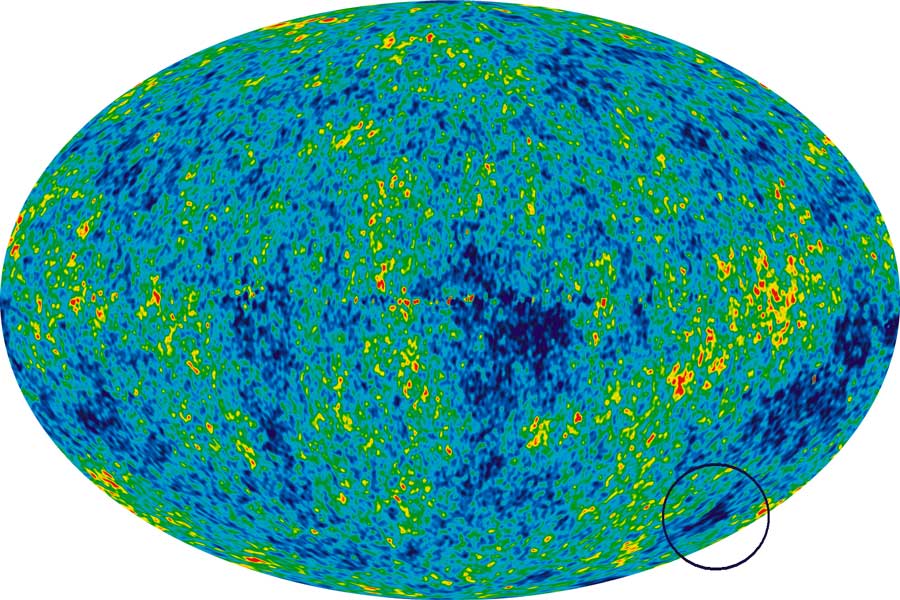
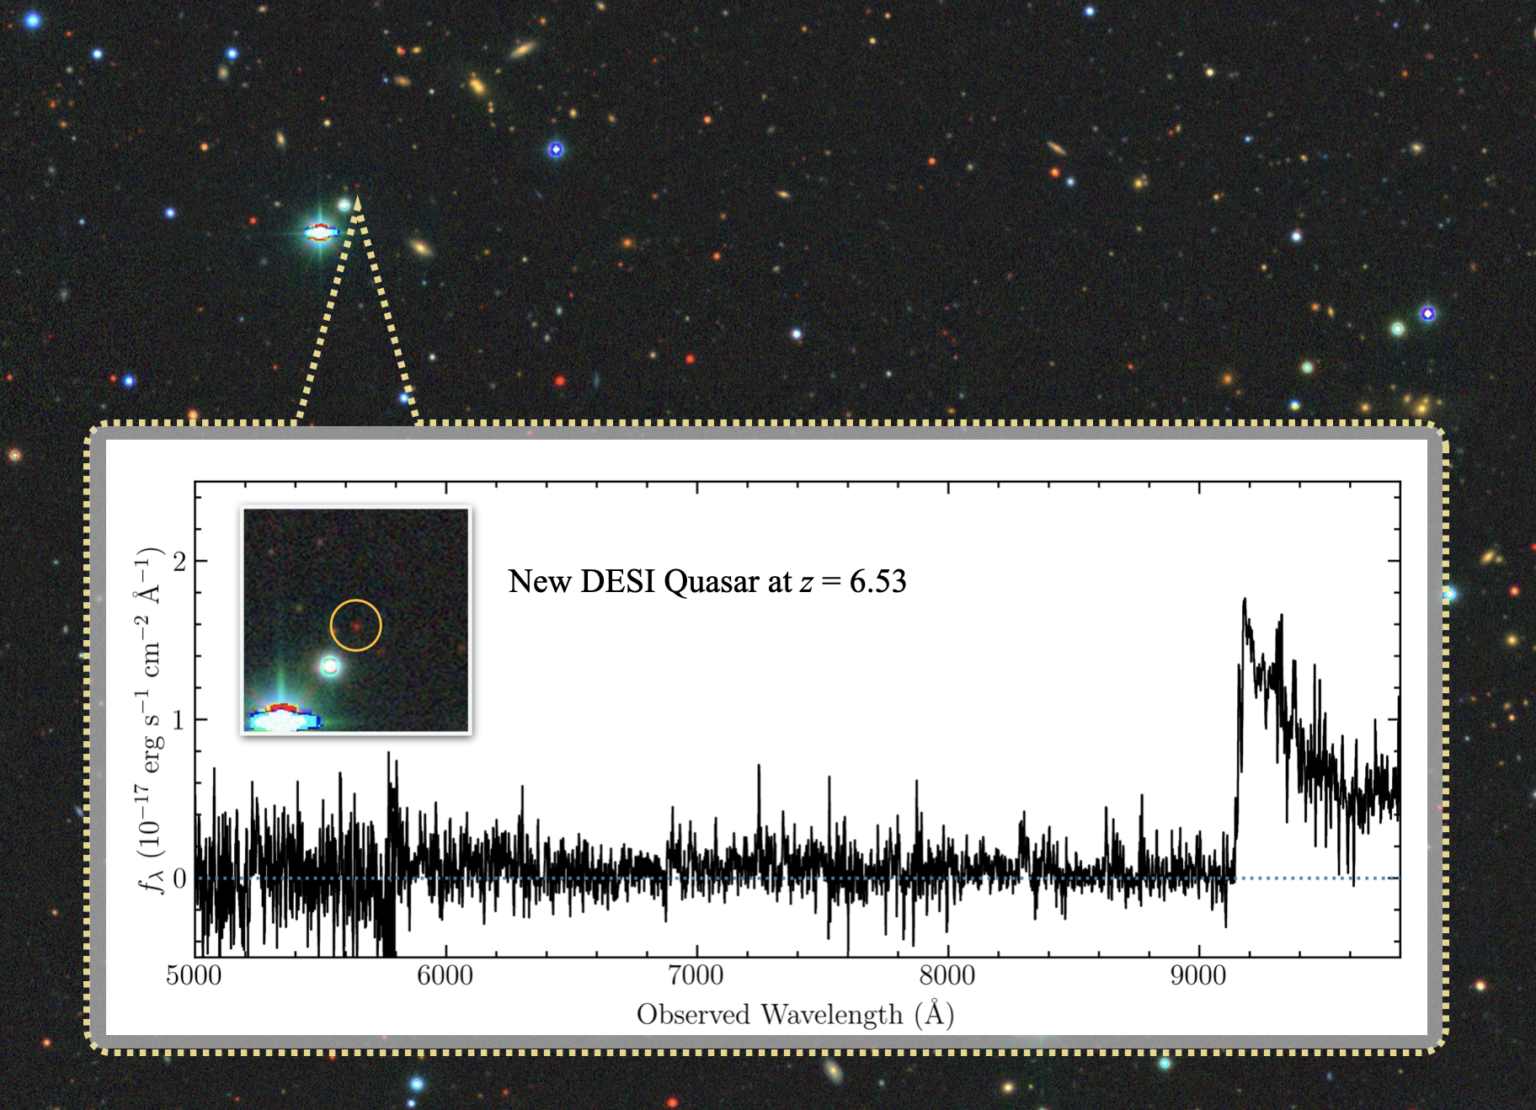
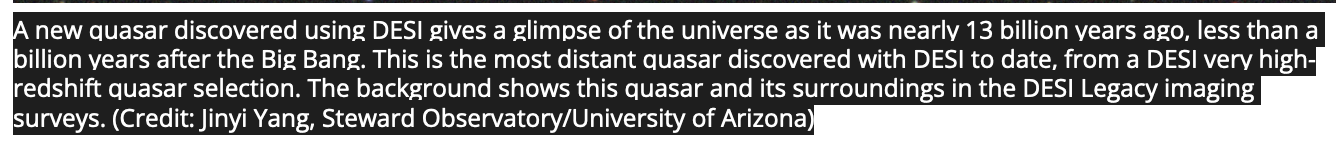
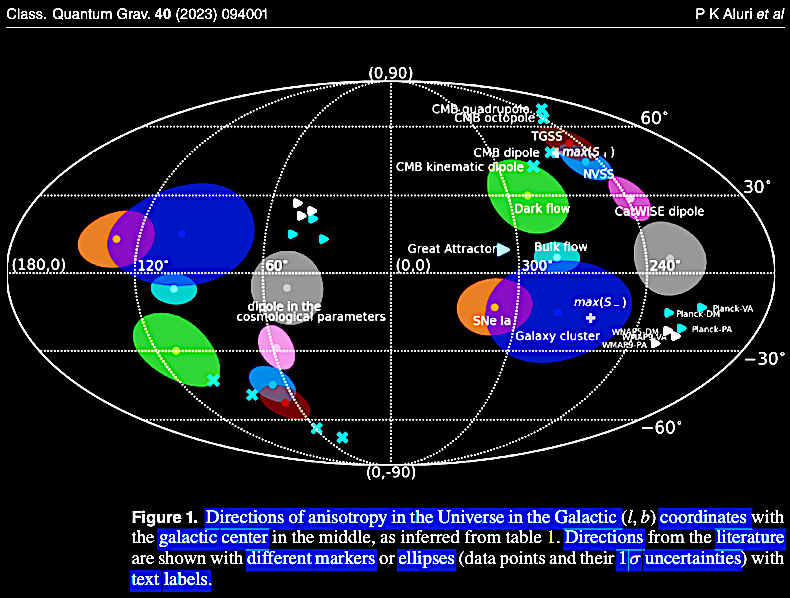
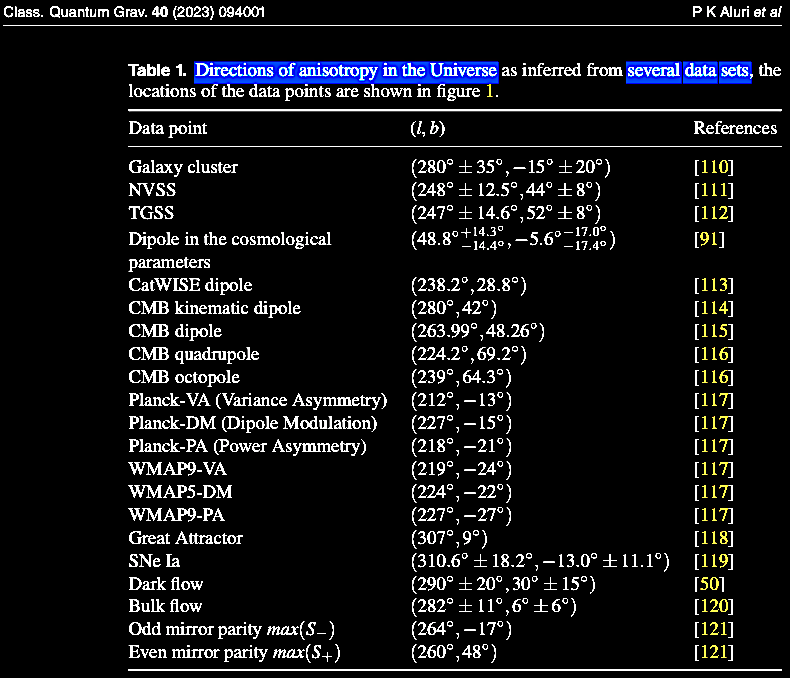

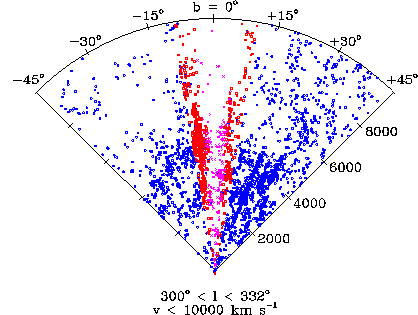

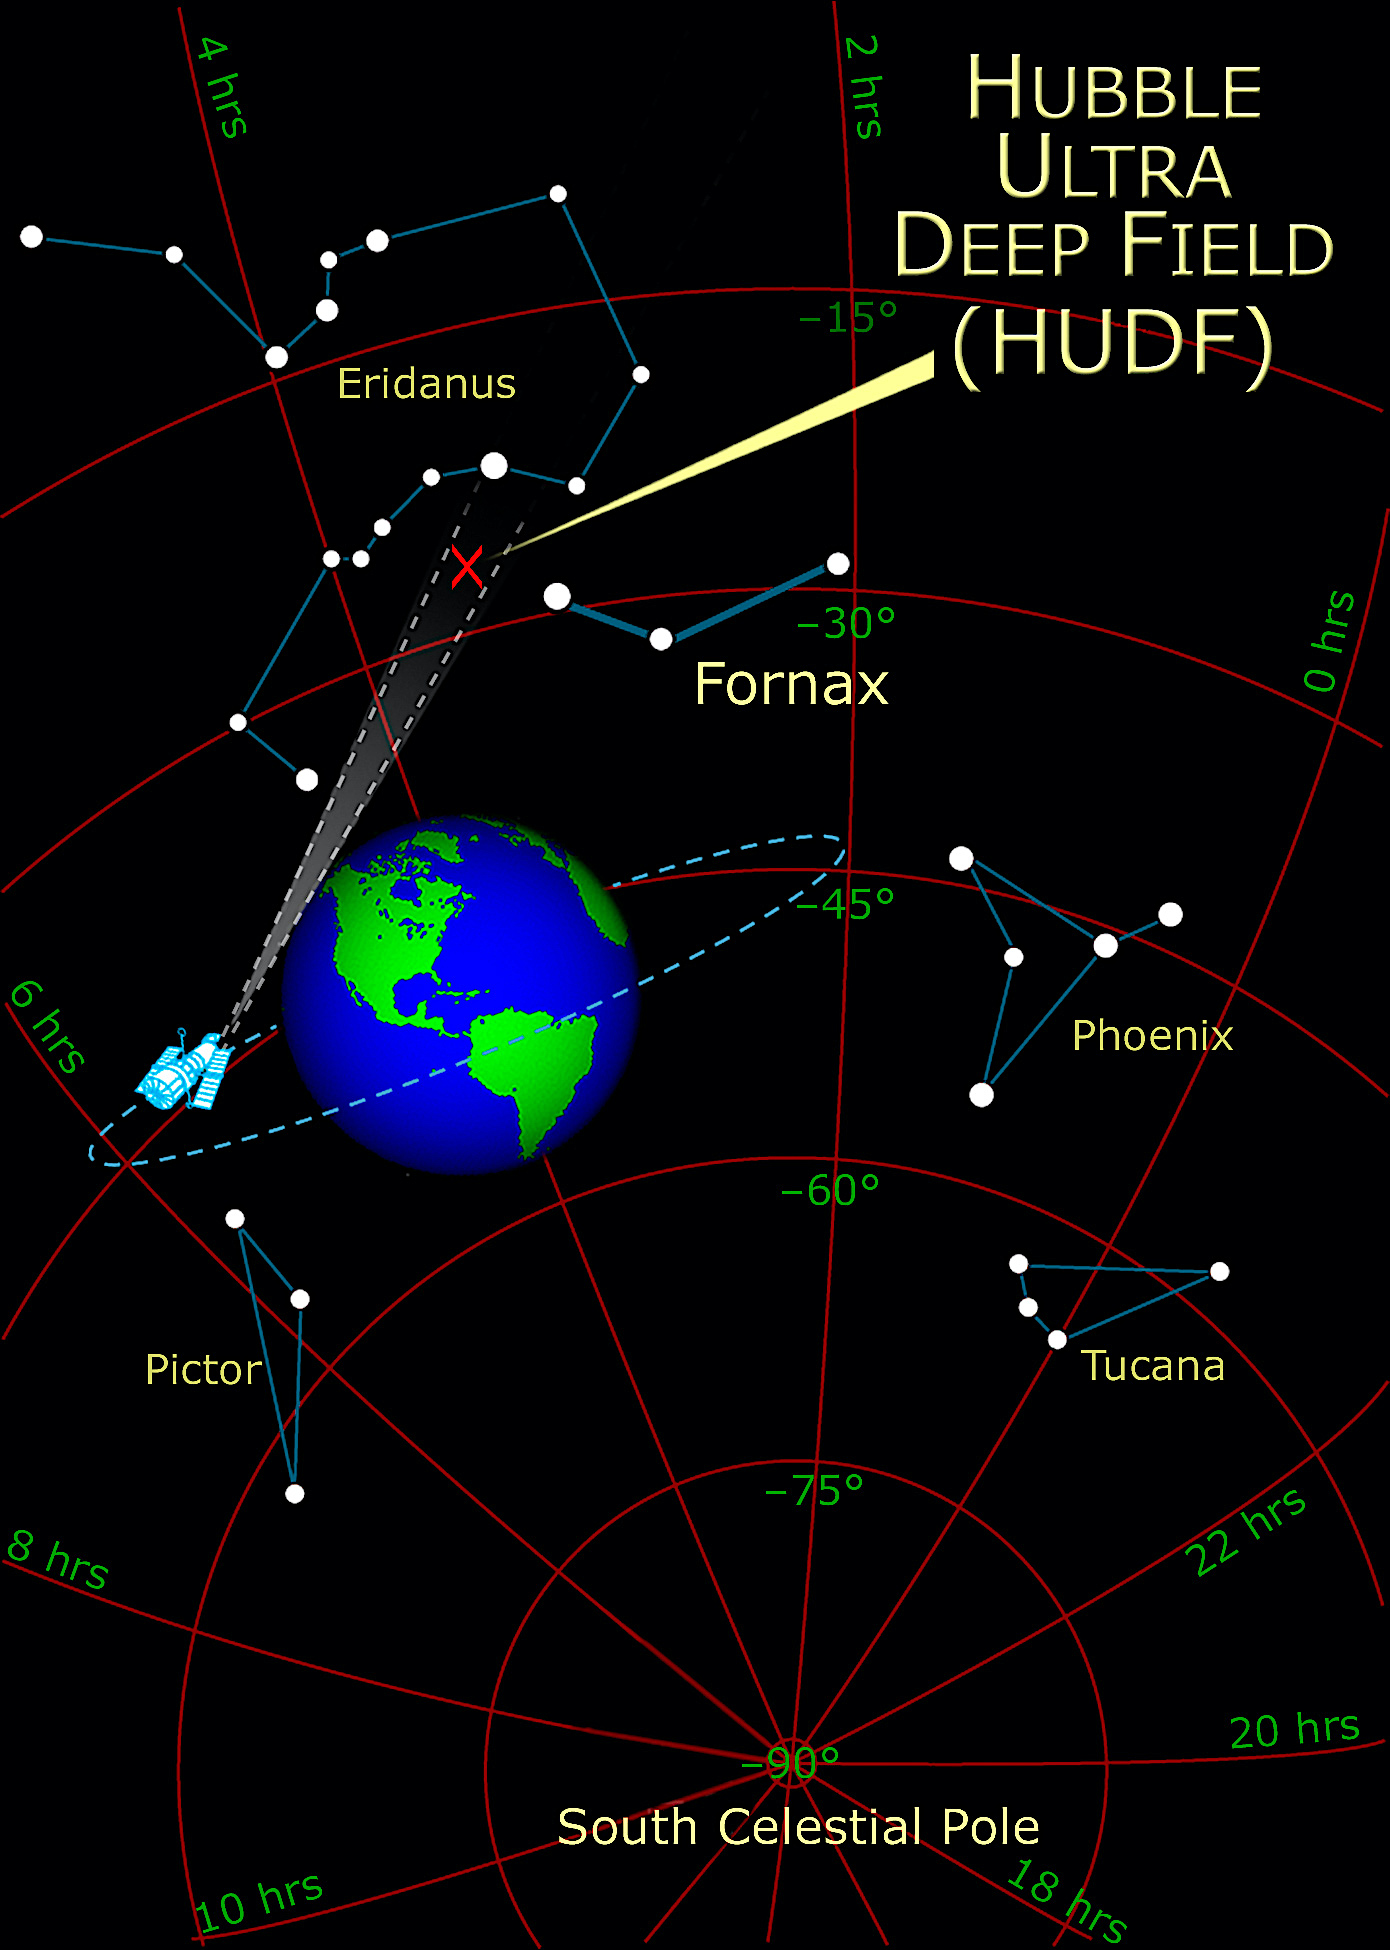
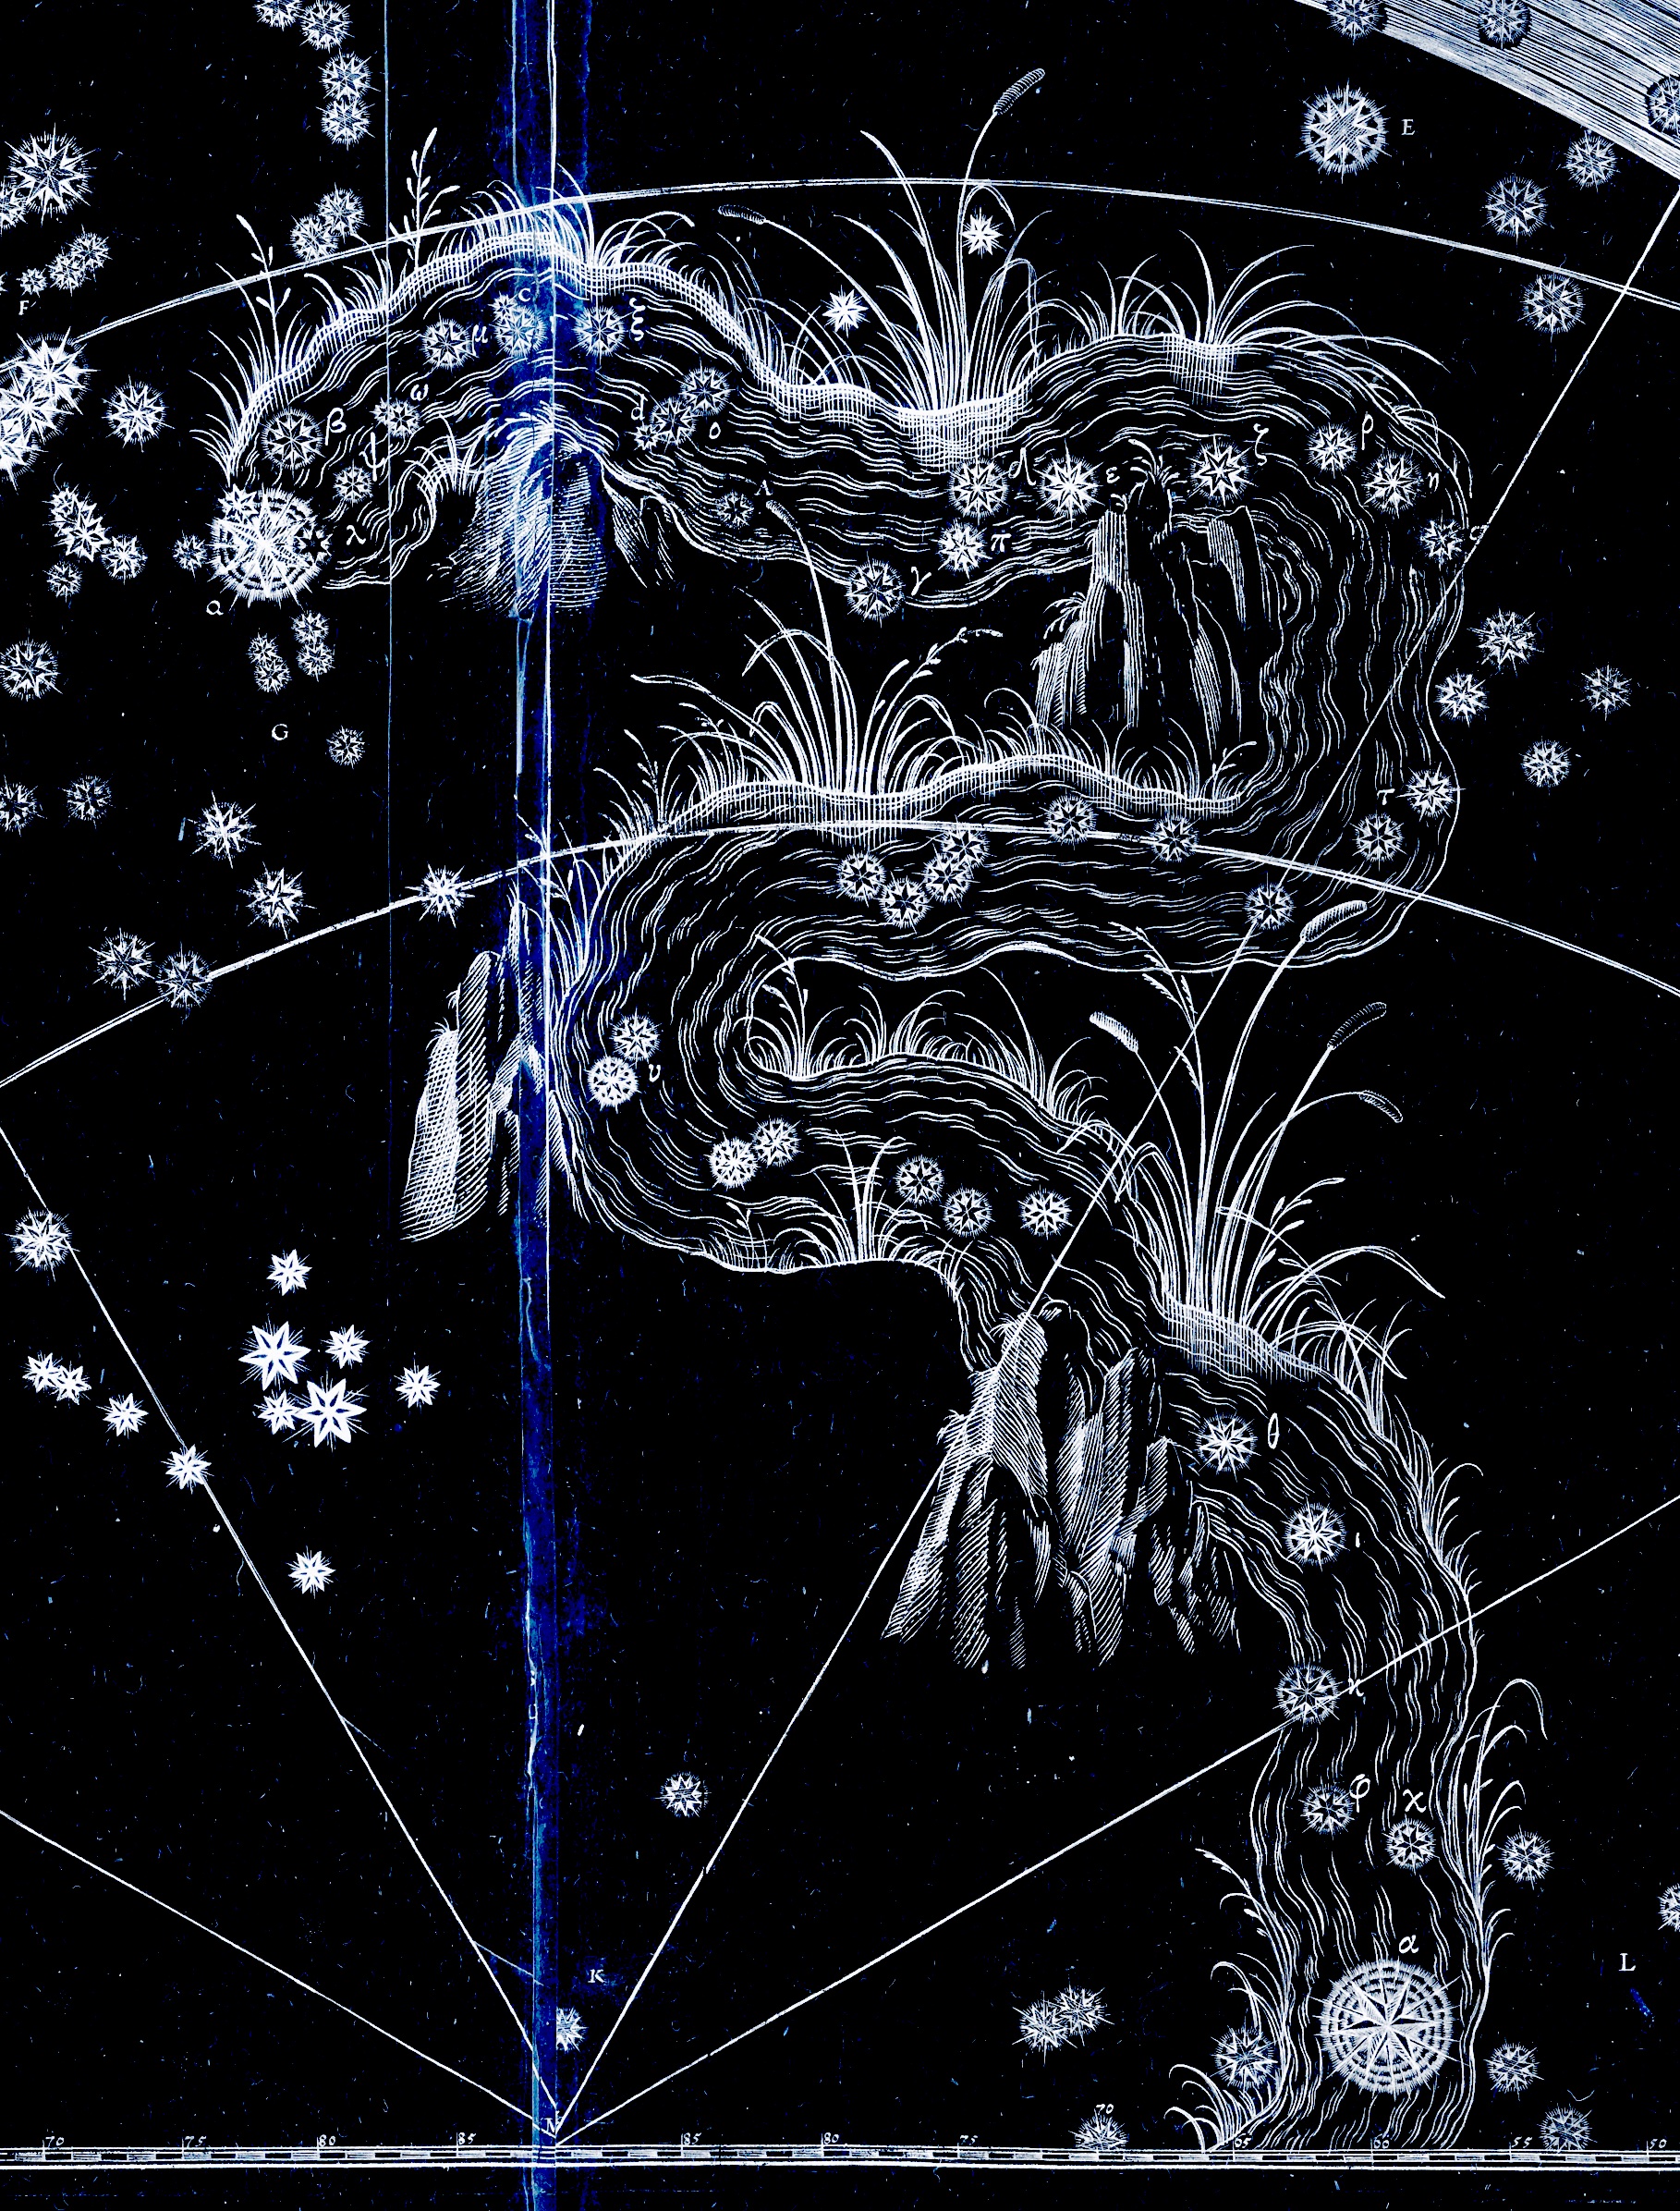
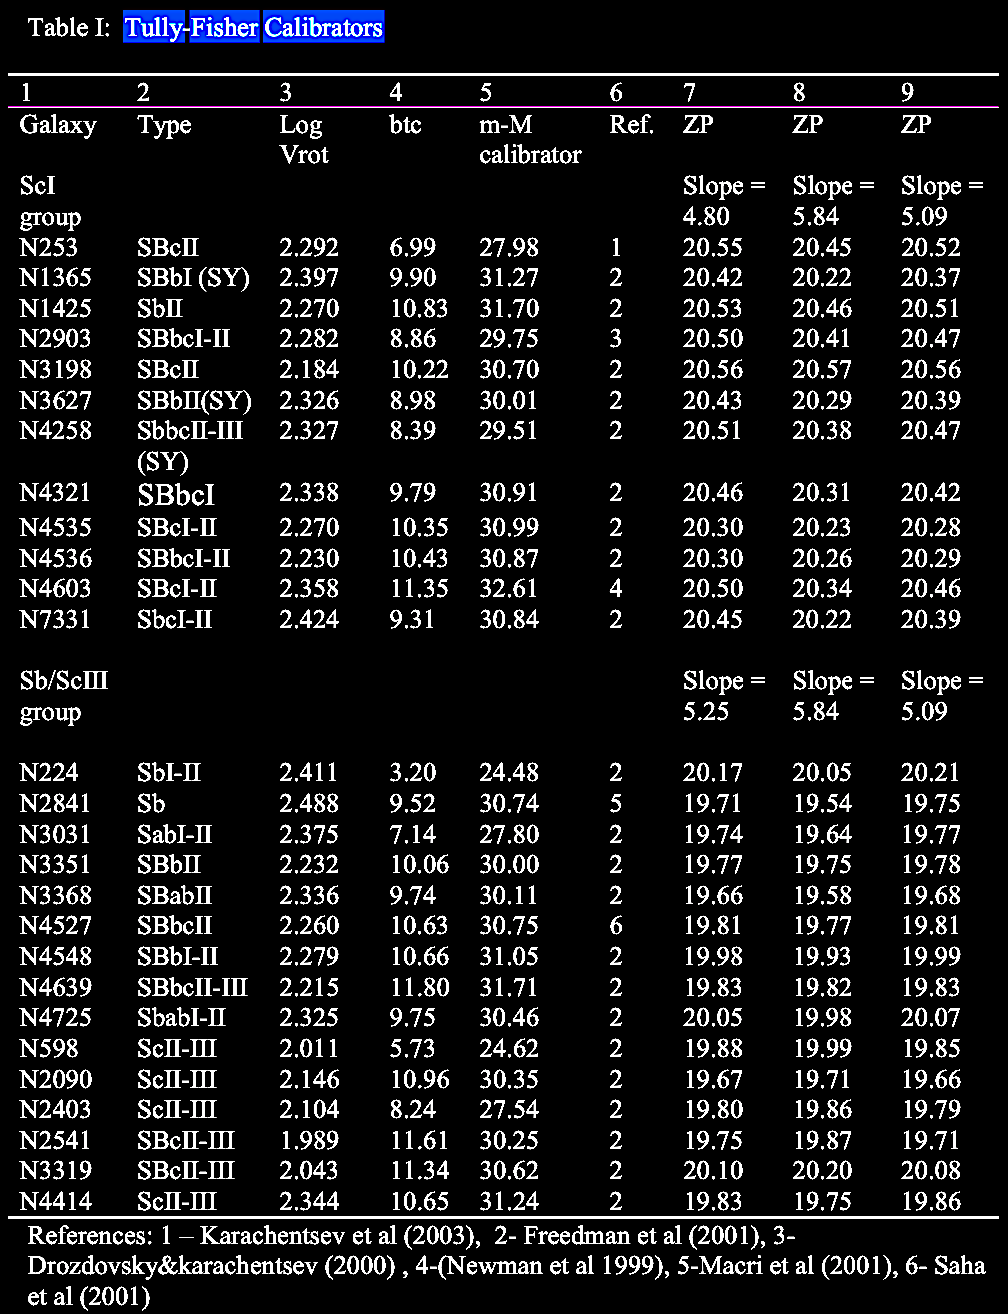
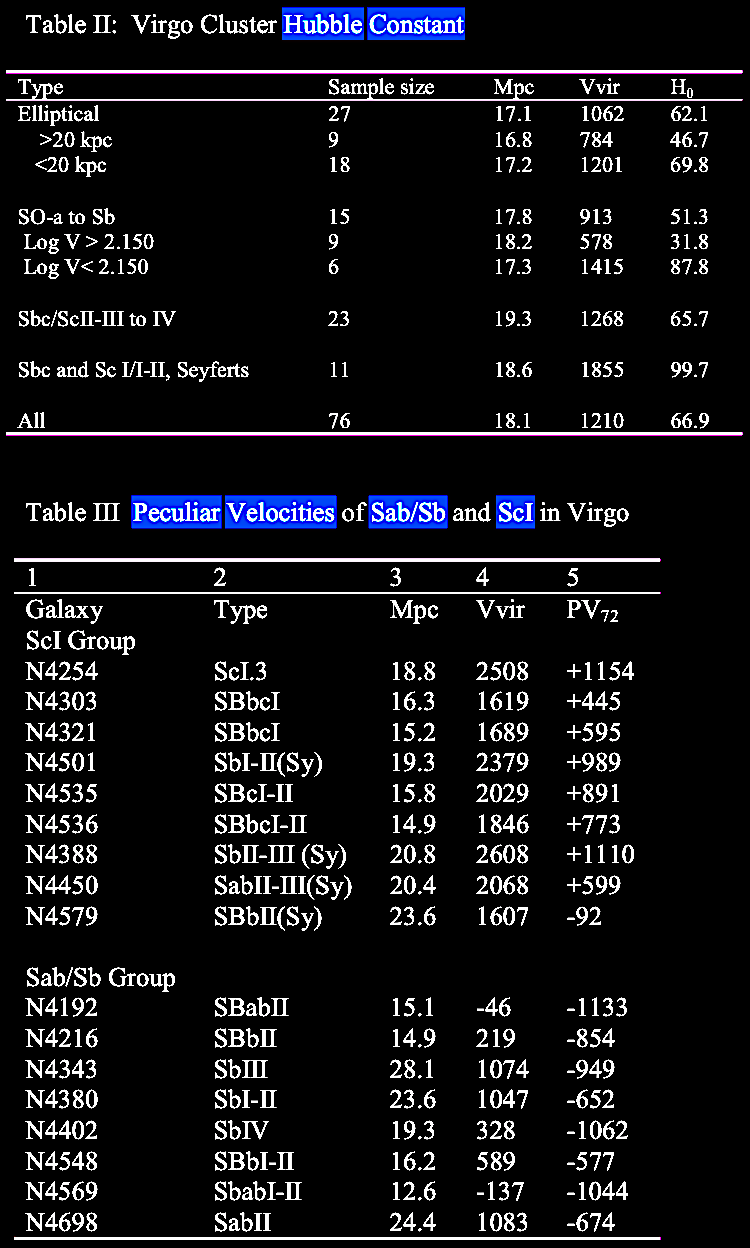
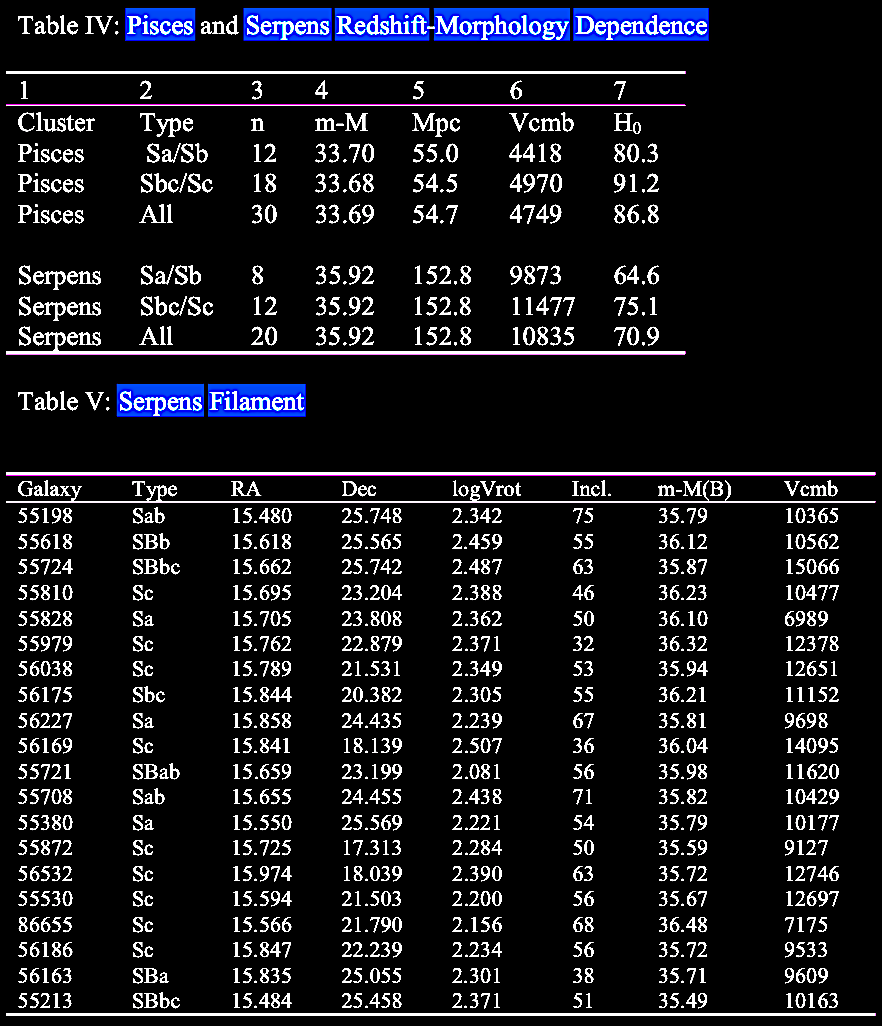
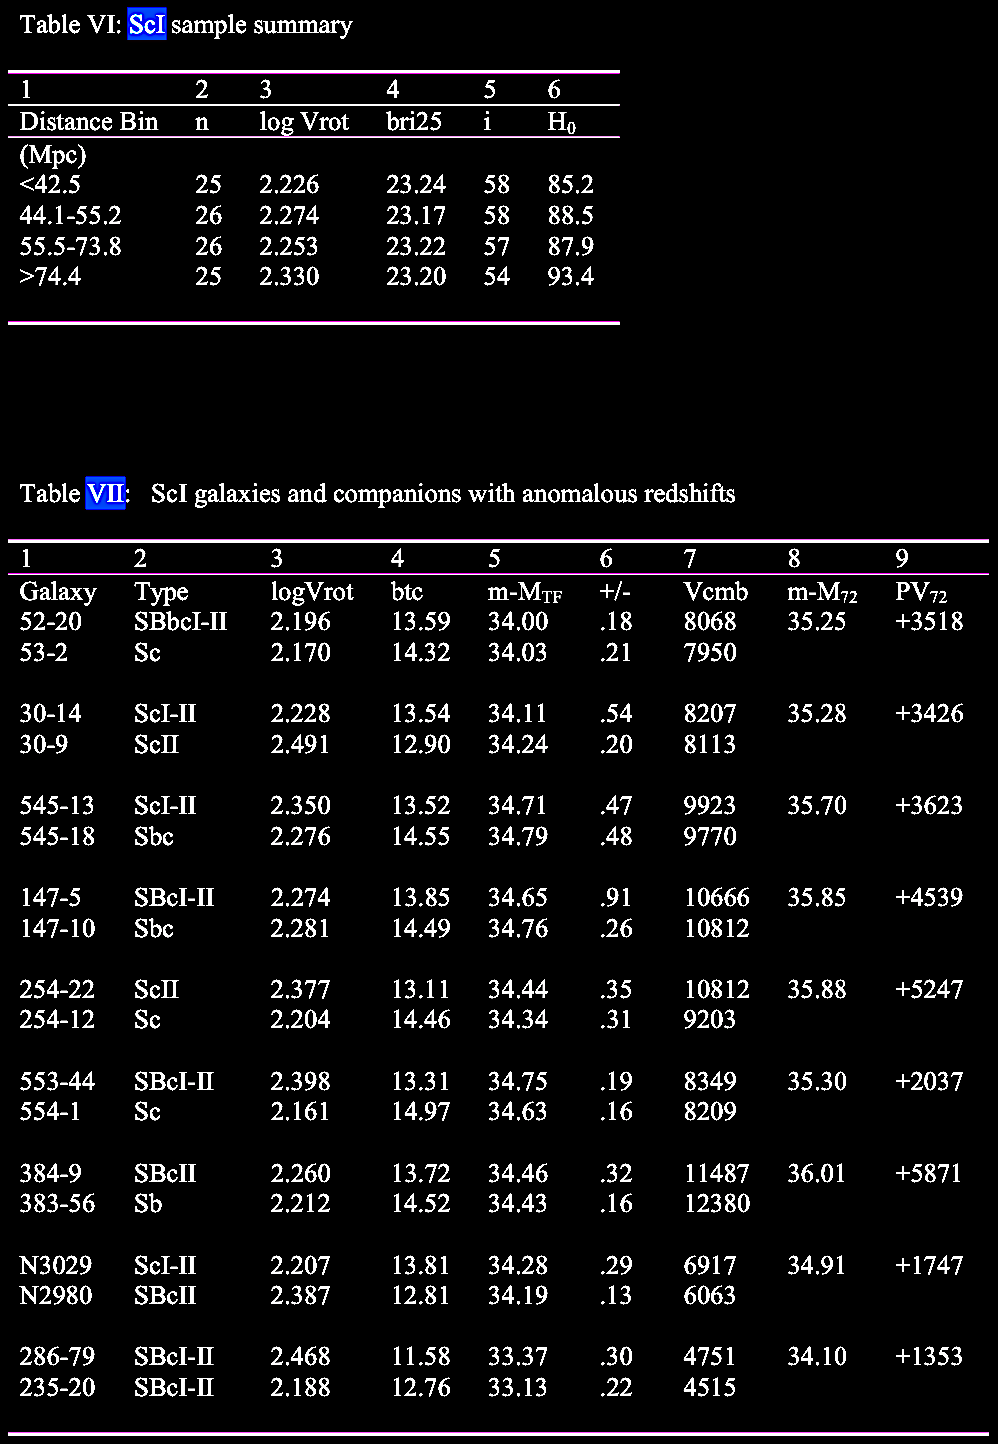
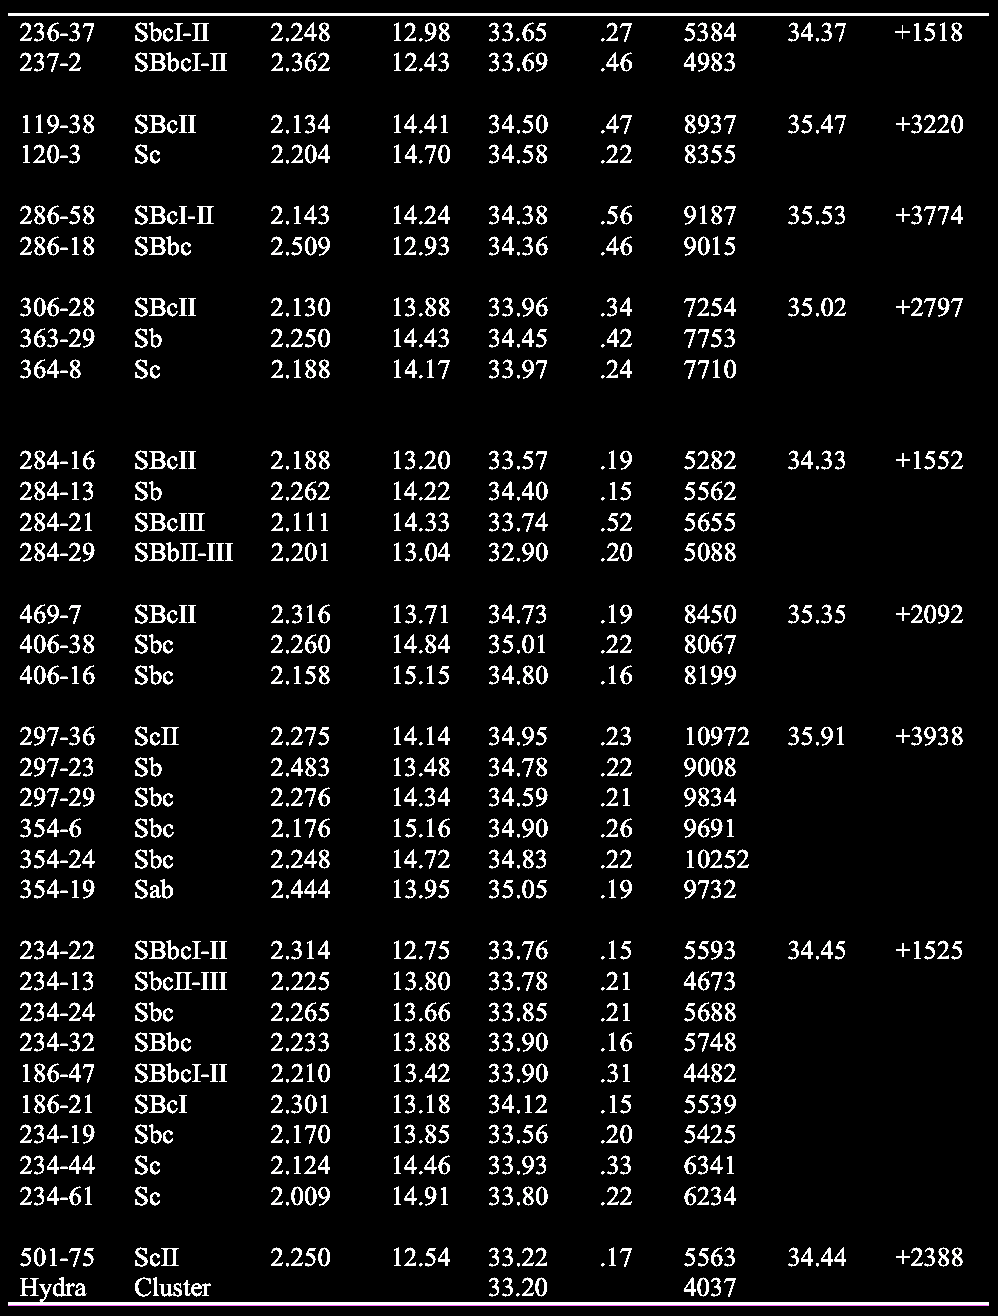
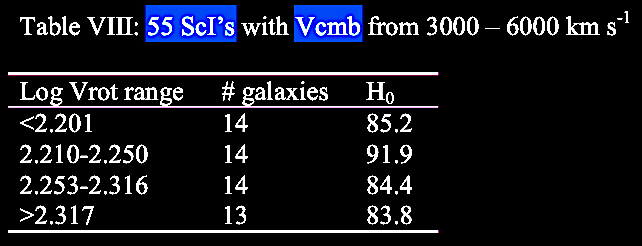
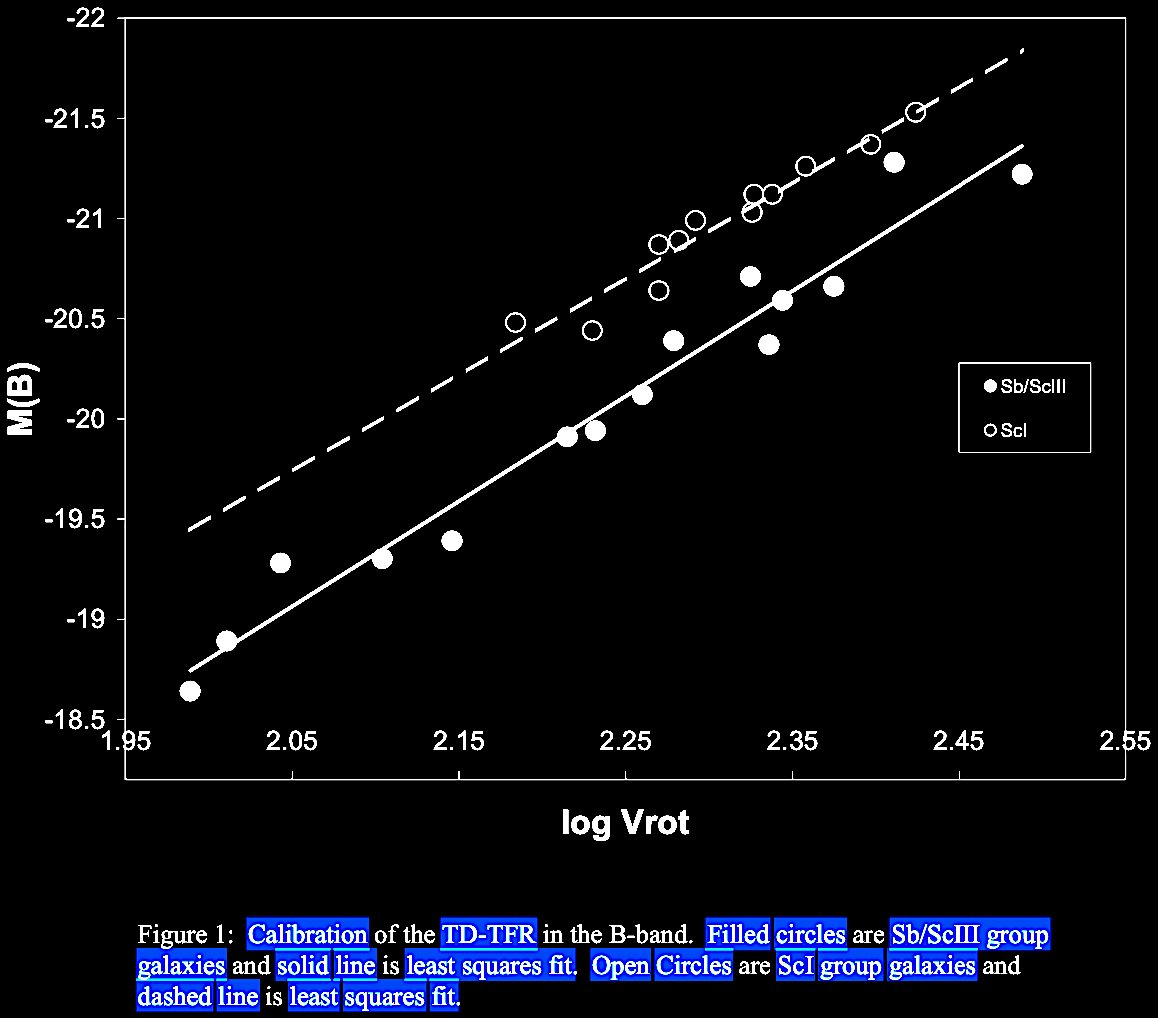
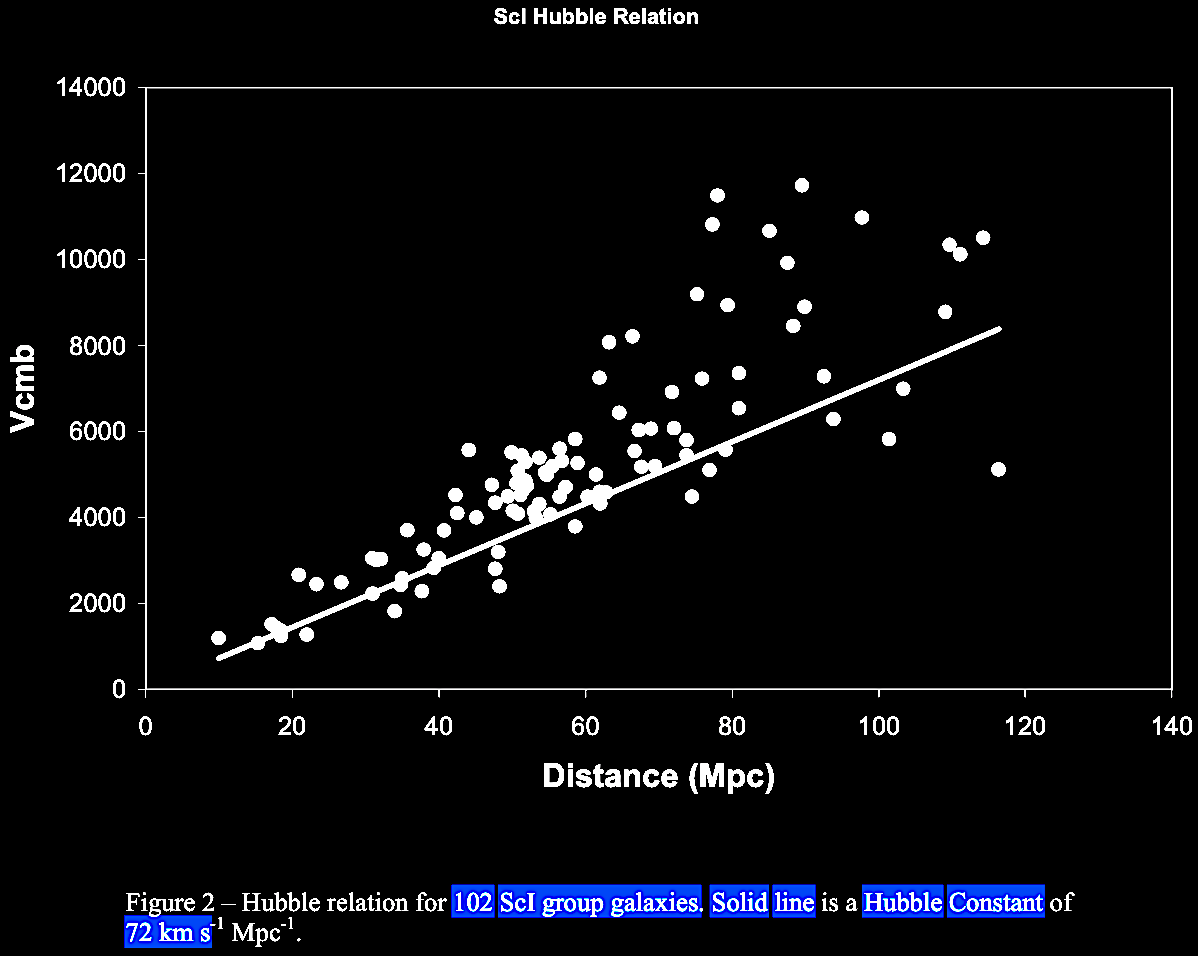
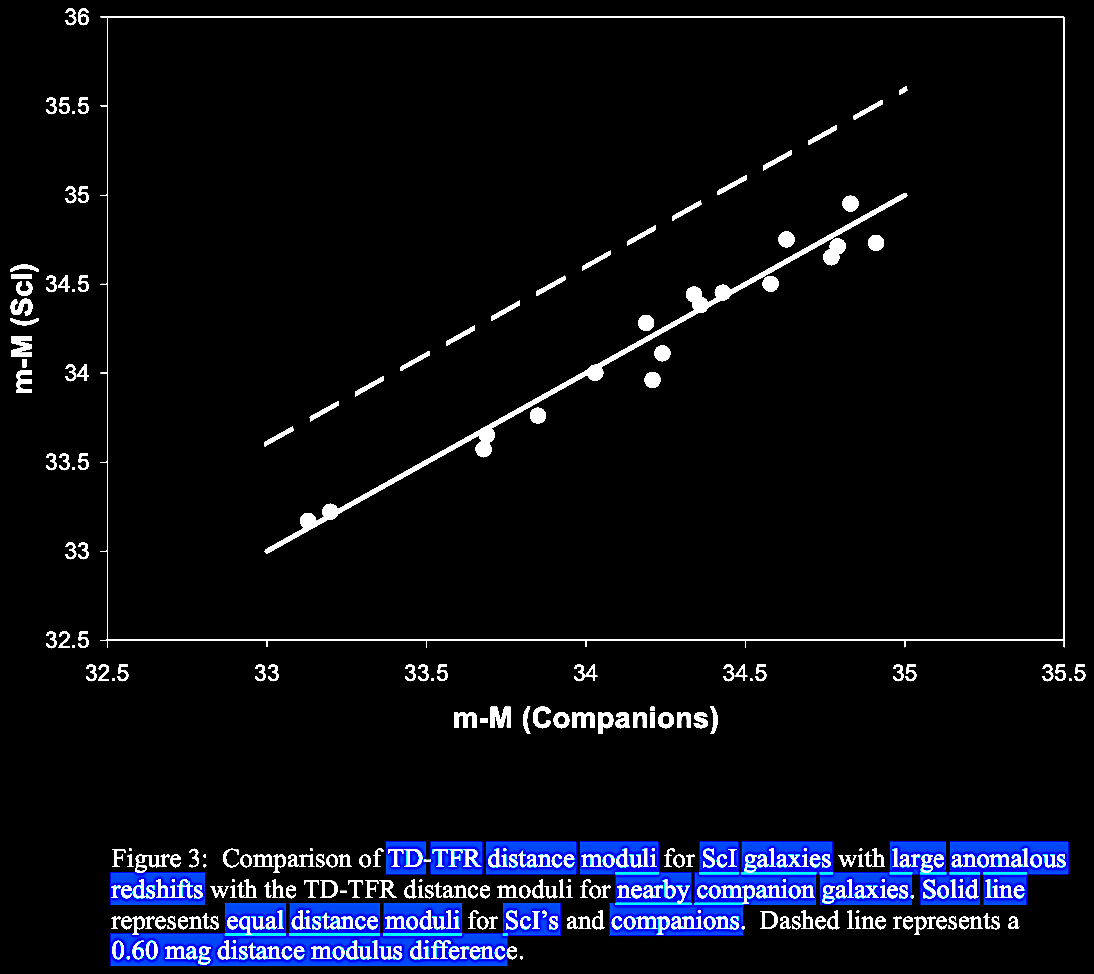
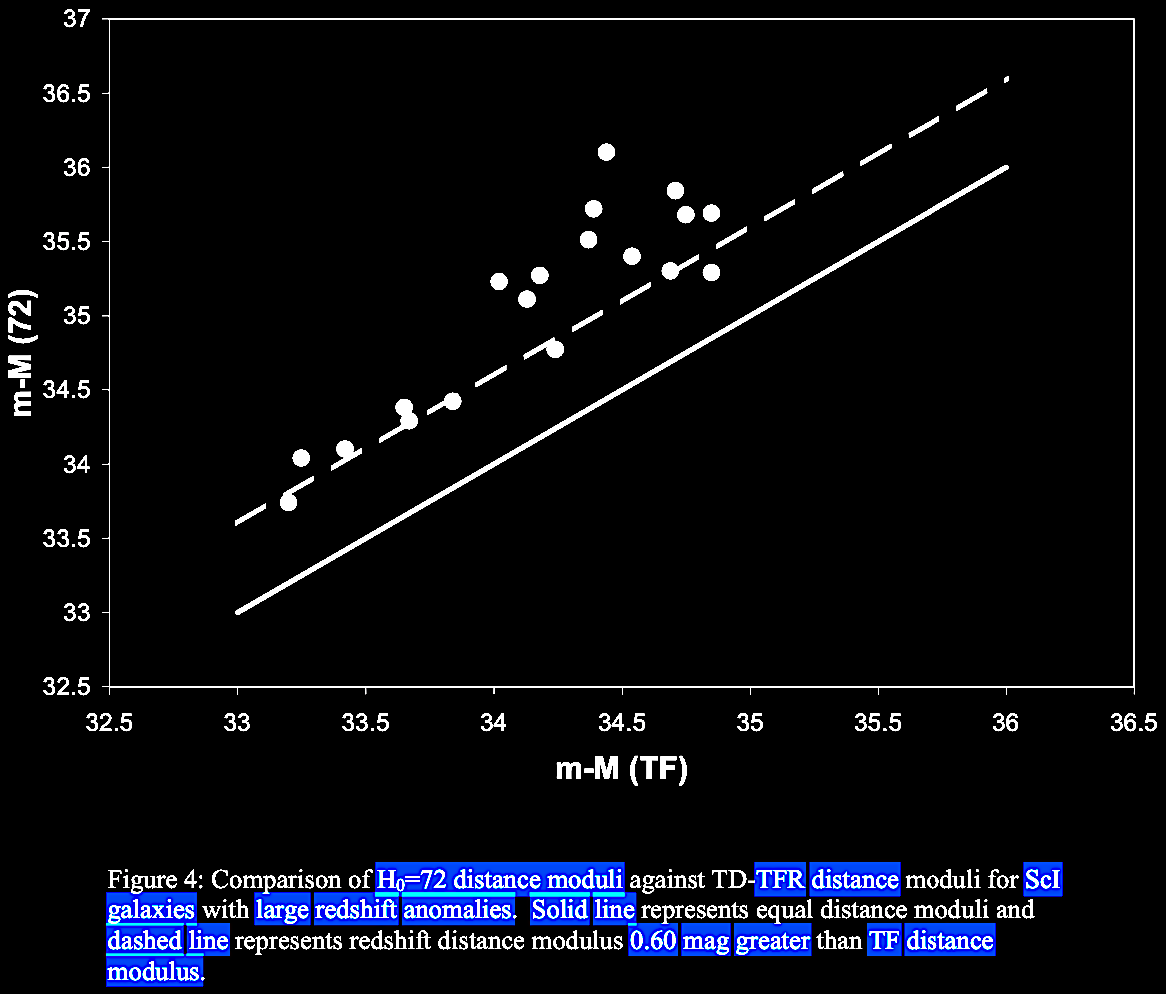
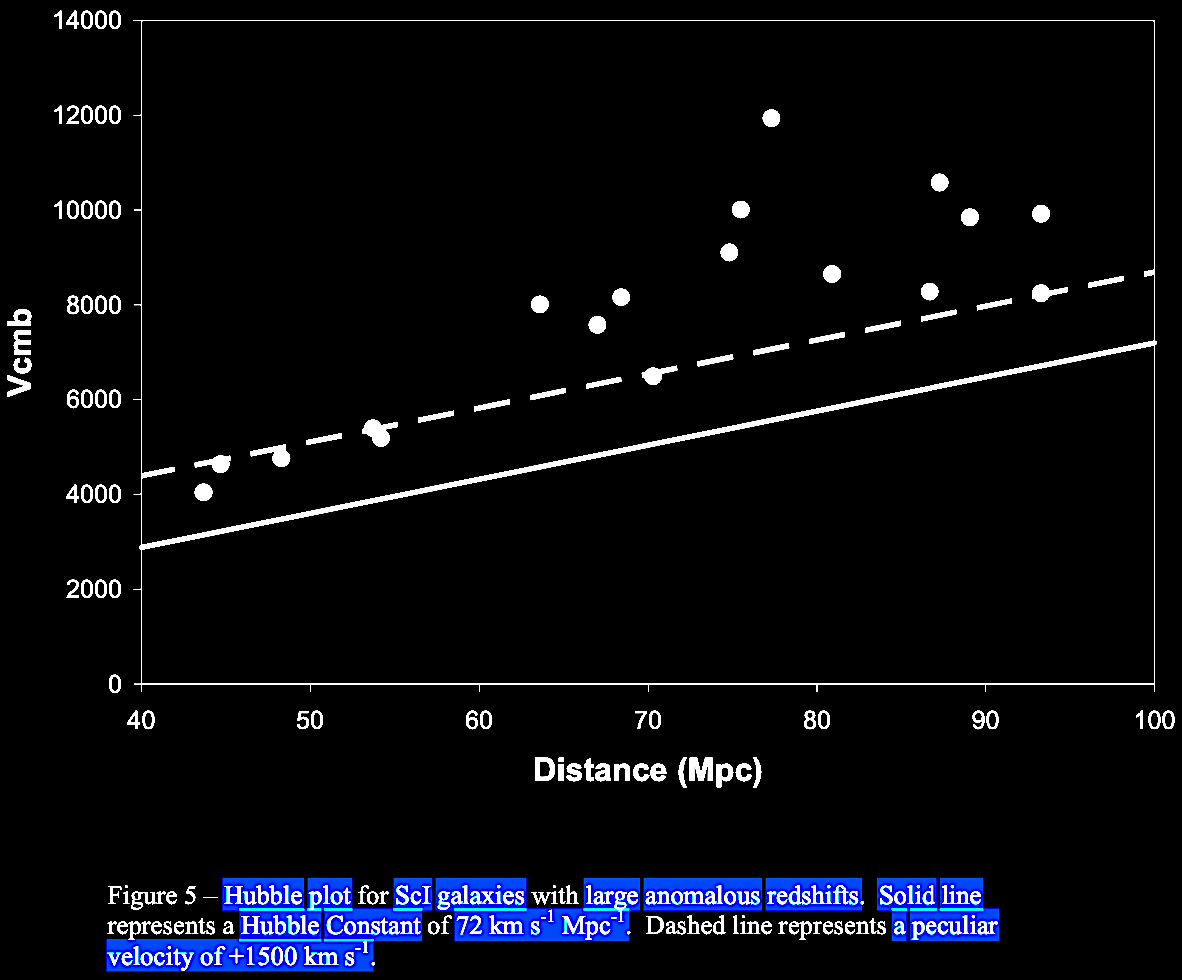
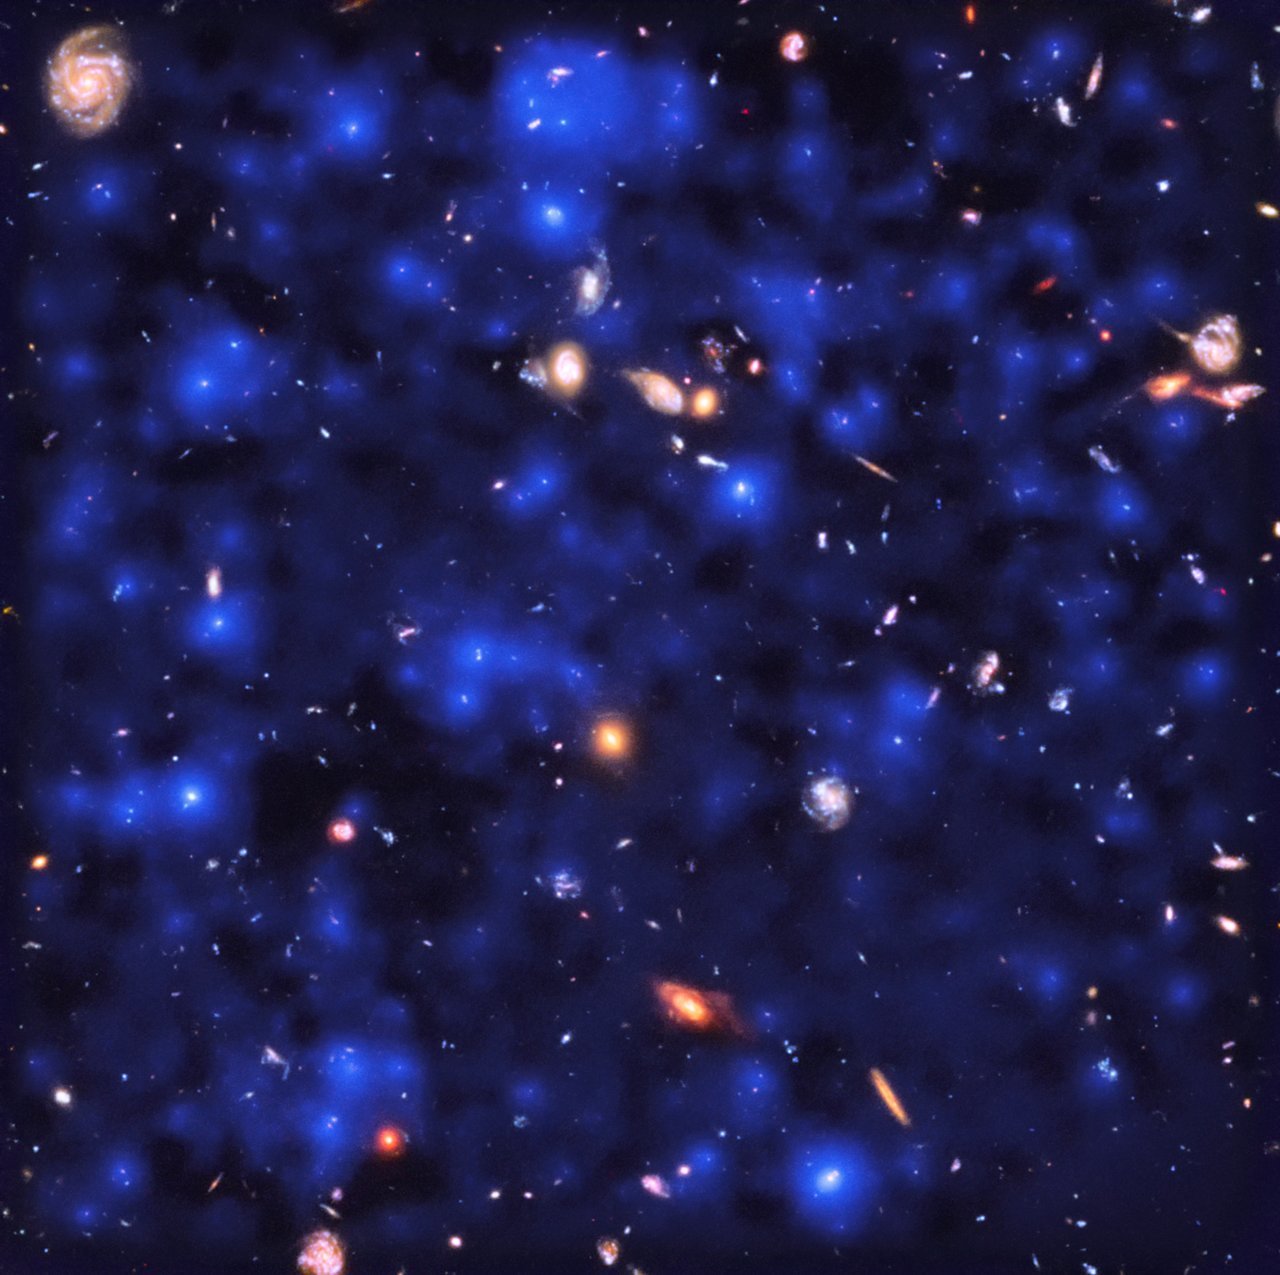
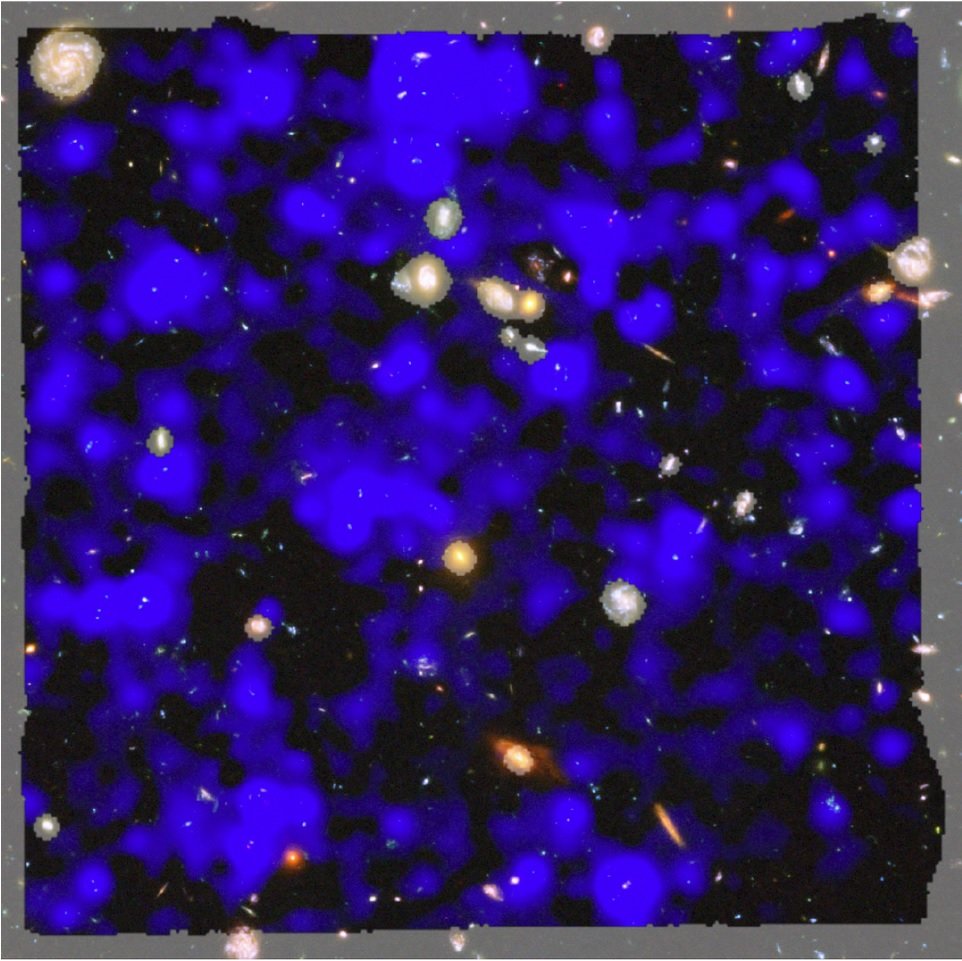

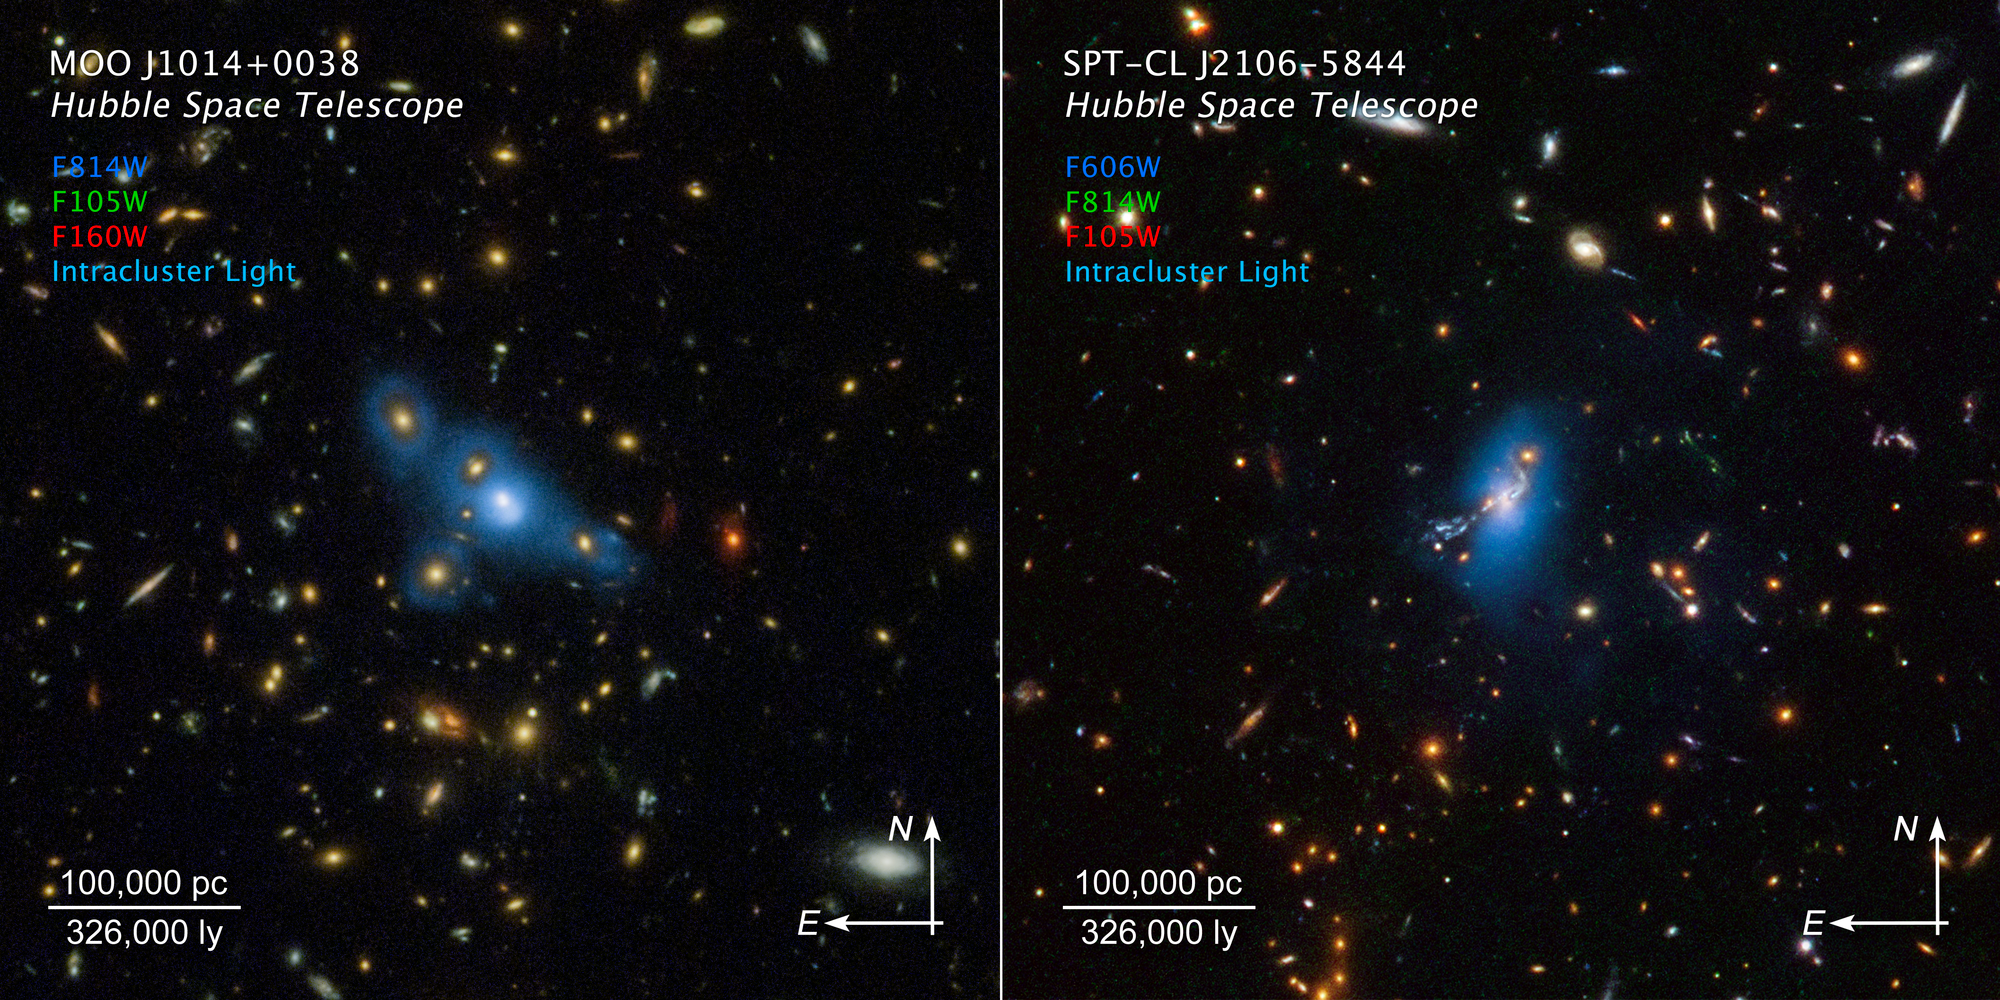
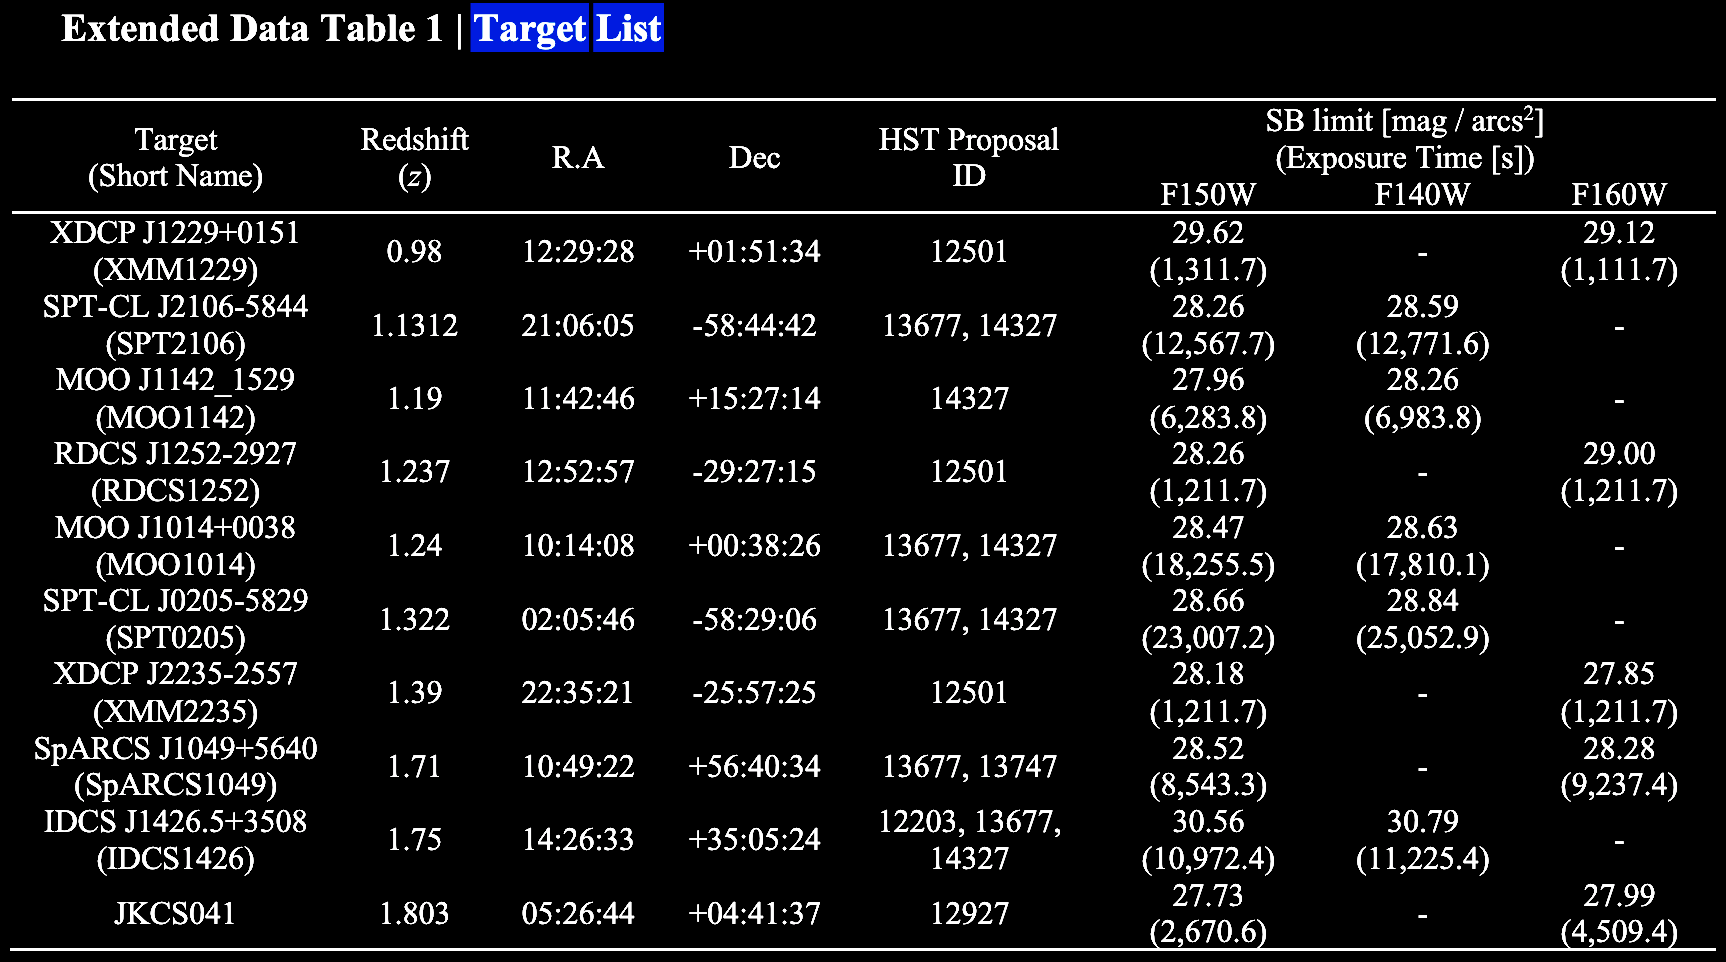

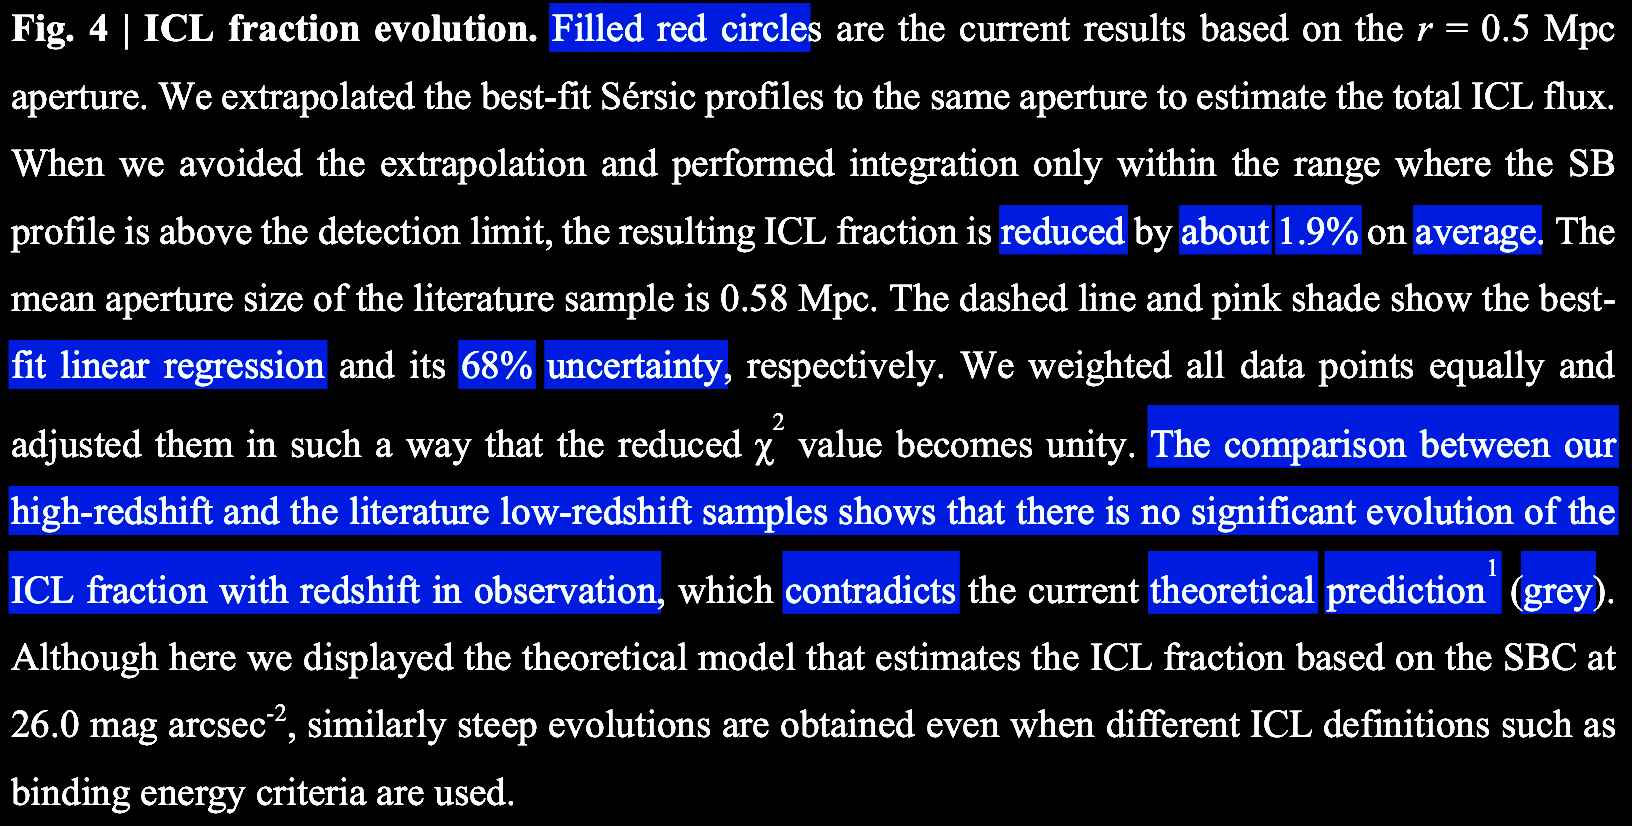
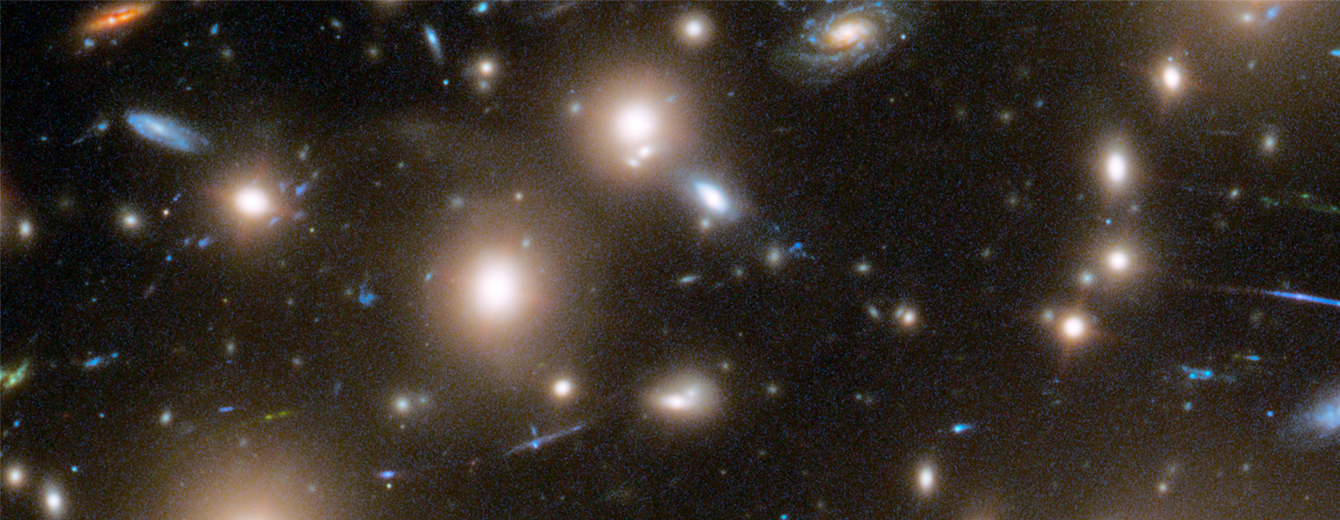