(Image
link); for the JWST Observatory Coordinate System and
Field of Regard:
(https://jwst-docs.stsci.edu/jwst-observatory-characteristics/jwst-observatory-coordinate-system-and-field-of-regard;
JWST data pipeline; link).
Chapter V: First publicly
published on 02 July 2023, just 10 days before the 1st
anniversary of JWST Day 1: 12 July 2022.
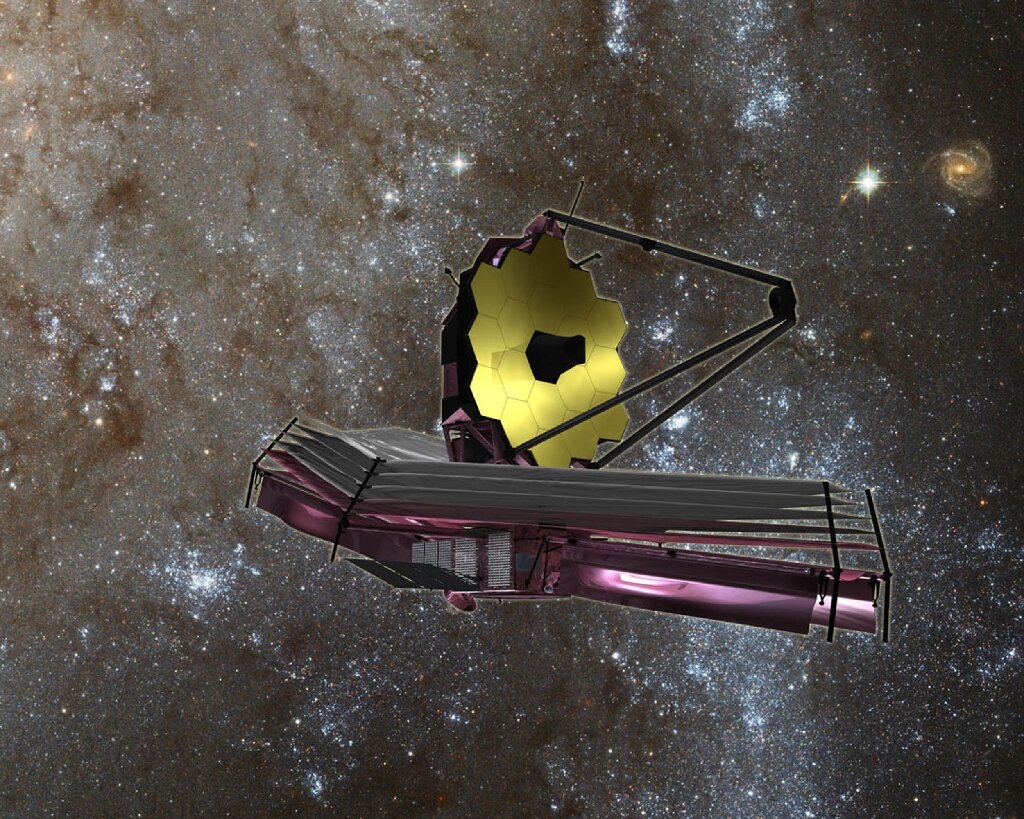
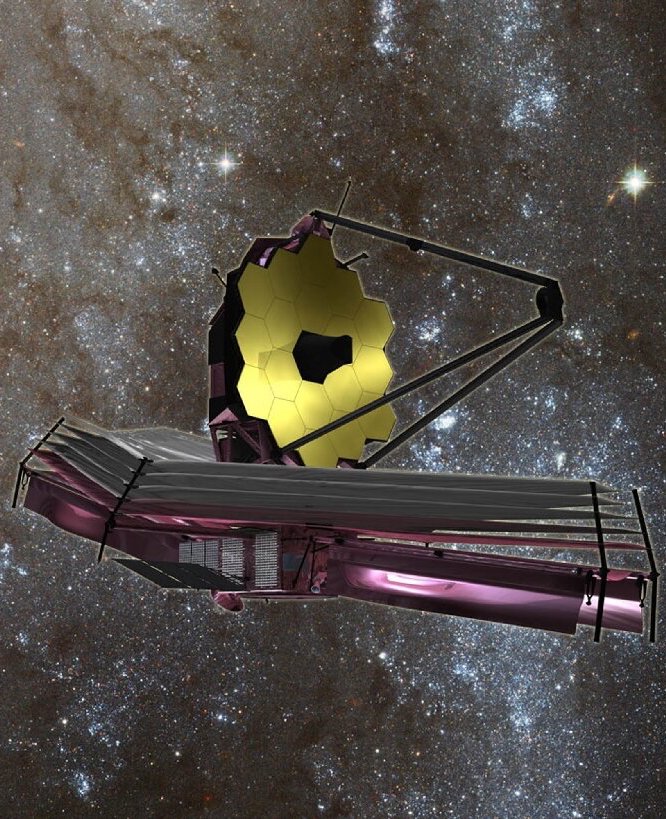
V. The James
Webb Space Telescope (JWST) discoveries are rocking the
foundations of the ΛCDM HBB Cosmology
From Mythos to
Cosmos took millennia, the Old Ptolemaic to Copernican took
centuries, the battle between the HBBC and CSSC took decades
and years, and the JWST is contradicting the HBBC in weeks
& months

Introduction. Because of the
wealth of data emerging from the JWST, this chapter
focuses on the data and results of significance for
testing cosmological theories in a time of paradigmatic
discussion. The papers and their data are summarized in
brief and laid out in chronological sequence, essentially
in scrapbook fashion. (See the Livescience popular
summary: "James Webb Space Telescope: Origins, design and
mission objectives" (link).
Also available is the DAWN JWST Archive (DJA), a database
of deep sky objects observed by the JWST: https://dawn-cph.github.io/dja/index.html.
As in the early days of the Scientific Revolution and the
Enlightenment, the technological advance of the telescope,
Galileo's scope, helped bring the Old Ptolemaic system or
world-view into a paradigmatic crisis (Kuhnian sense), so
the anomalies which have been for decades accumulating in
the New Ptolemaic system of the HBBC are being brought
into paradigmatic crisis by the JWST, building upon the
results of the HST. Science is often fundamentally
conservative when it comes to established paradigms, but
the influx of data rapidly increased by JWST and other
modern instruments is accelerating that paradigmatic
crisis. The comparison is apt, and we explore this
developing crisis in this chapter. The popular science
journalism is recognizing the paradigmatic situation also,
even if in limited terms dealing with the 'Hubble tension'
(discussed in detail in chapter VII), &c., using
the rather melodramatic title: "After 2 years in space,
the James Webb telescope has broken cosmology. Can it be
fixed?" (Livescience link).
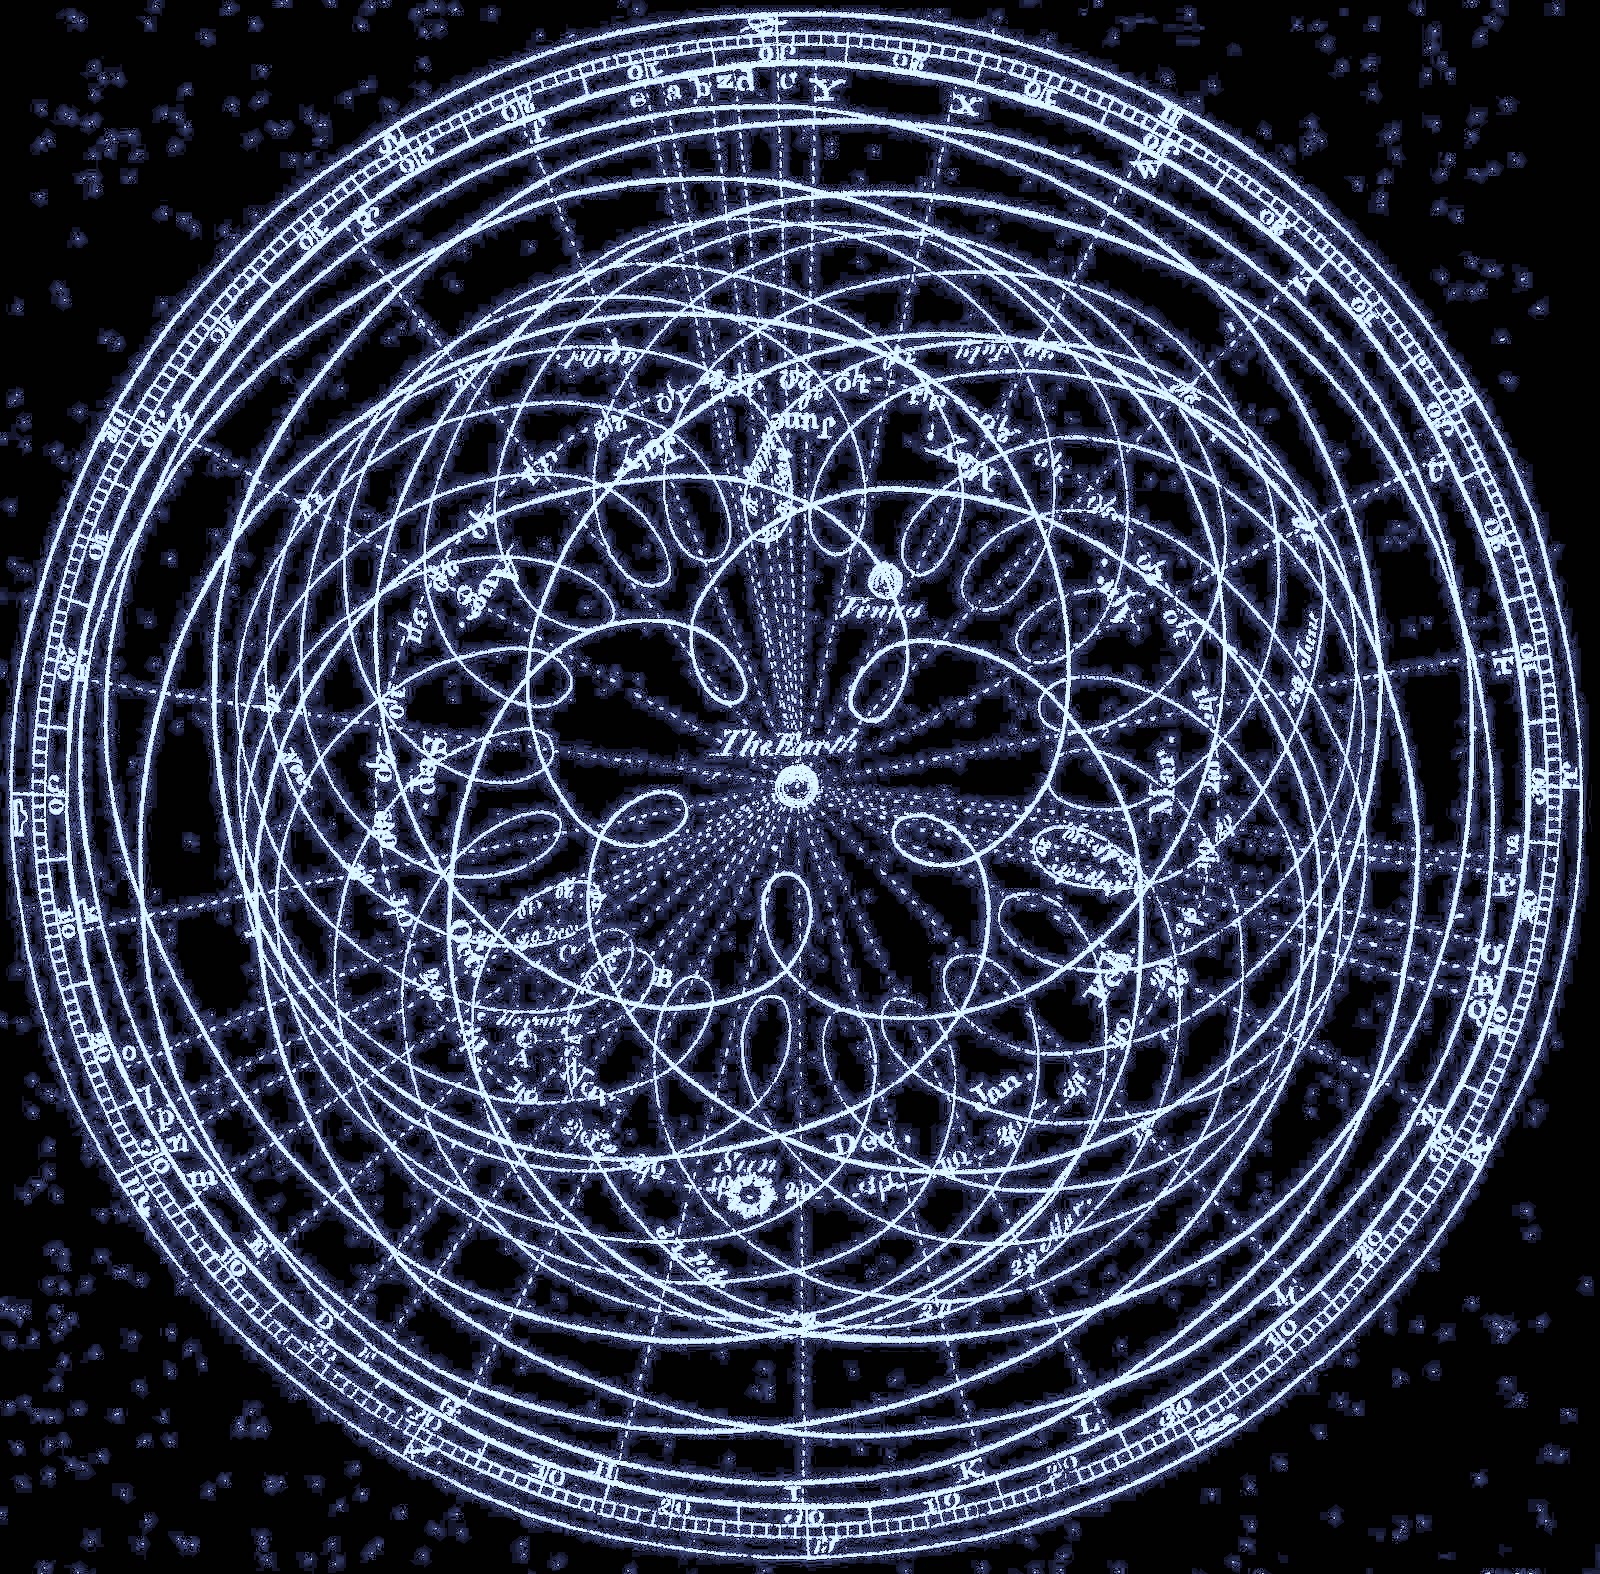
The telescopes versus
established cosmologies of their times: The Old & the
New Ptolemaic Systems

|
|
The
Old Ptolemaic System geocentric cosmology
|
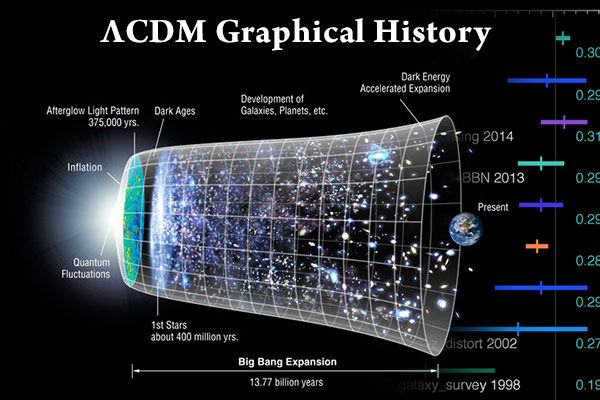
The
New Ptolemaic System cosmology: The ΛCDM HBBC
|
Paradigm-bursting telescopes.
Provisional Contents:
- JWST Diary begins: 12 July 2022,
Tuesday, 10:30 am EDT / 14:30 UTC, JWST Day 1.
- Happy
Birthday, JWST (12 July 2023).
- 12 July 2022, Tuesday, 10:30 am EDT /
14:30 UTC, JWST Day 1.
- Excursus on
Stellar Evolution and Stellar Ages.
- Hubble Spitzer Galaxy
morphology classification.
- Before 12
July 2022.
- Unfolding
the JWST Results. [Overall section within which
JWST Diary entries appear].
- 14 July 2022 (Thursday). [And we
don't list here every entry]....
- An Excursus on the Tolman
(1930, 1934) test applied to GALEX
& HUDF.
- Metallicity in high
redshift objects.
- [JWST Diary entries under
development, continuing....]
12 July 2022,
Tuesday, 10:30 am EDT / 14:30 UTC, JWST Day 1. The fully
operational JWST began to publicly "unfold the infrared
universe" (https://www.nasa.gov/webbfirstimages). Almost
immediately the simmering controversies in cosmology erupted
again in quite publicly renewed controversy over whether the
Big Bang cosmology can accommodate some of these very deep
sky data. The main JWST home website and its
frequently updated image
gallery went live, and one can follow the JWST on its
distant orbital path (Where
is Webb?). And the scientific paper preprint services
began putting out JWST data. The first images:
Juxtaposed images of an Abell
cluster of galaxies, SMACS-0723, ~4 billion light-years (Gly)
away, (Hubble Space Telescope or HST on Left, and James Webb
Space Telescope or JWST on Right).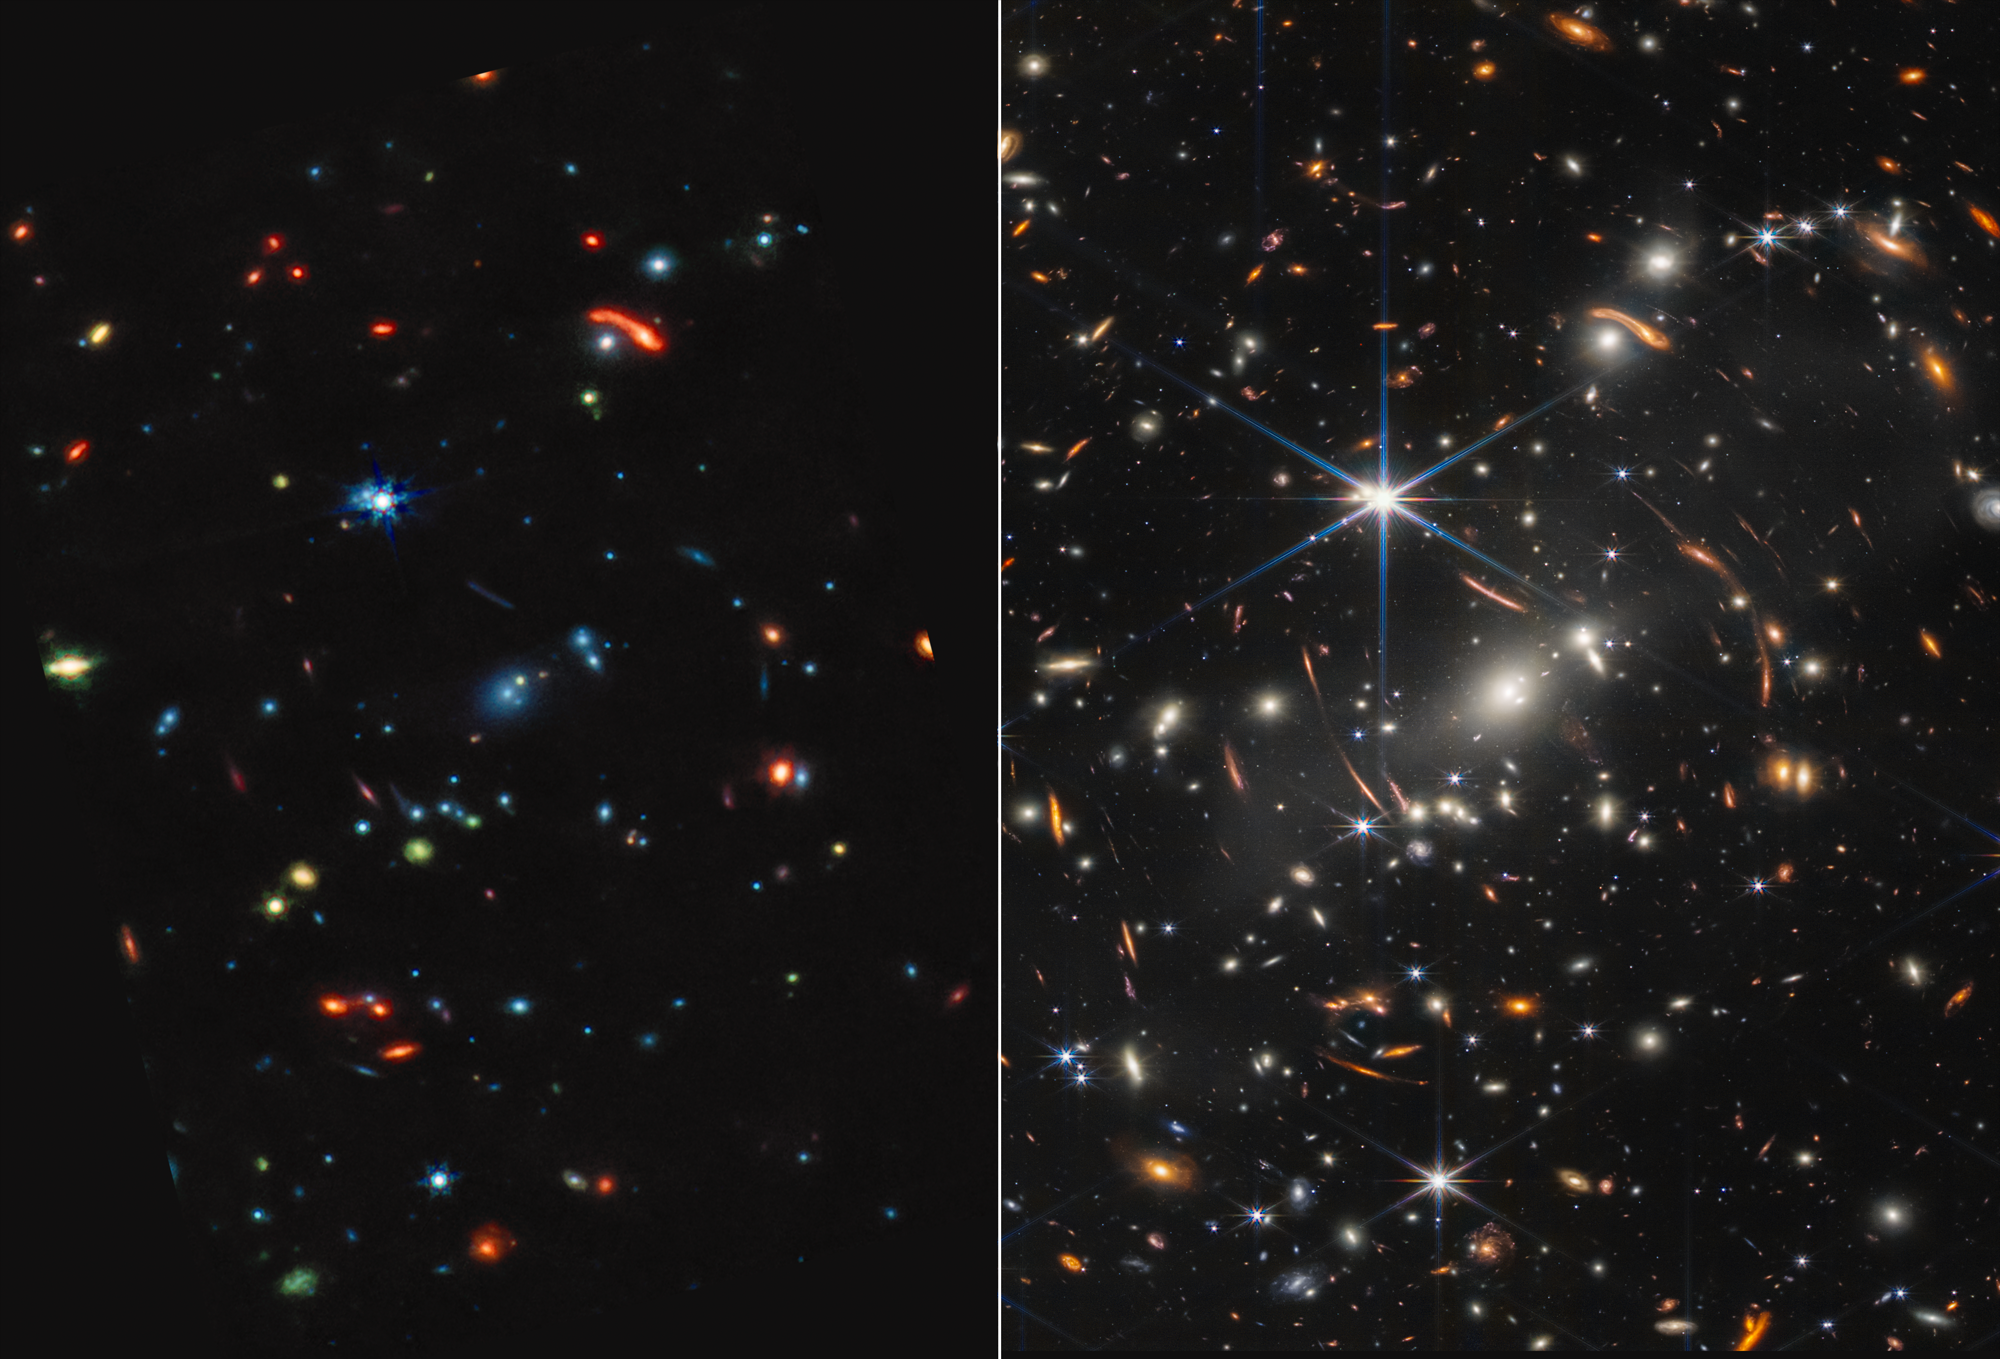
Part of the Carina
Nebula, NGC 3324: A star forming region (longest nebular
protrusions are about 7 light-years long).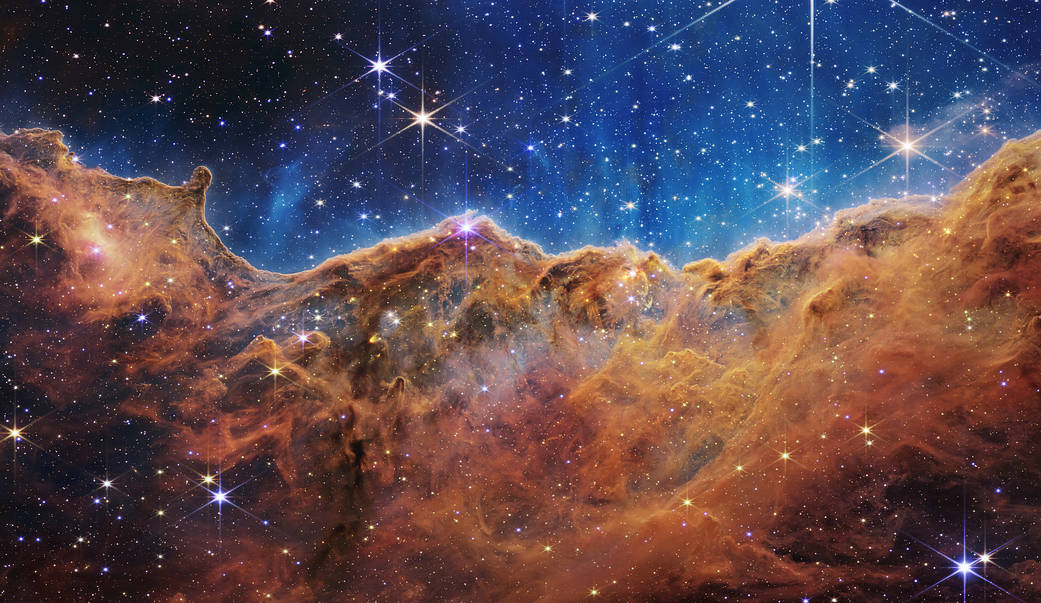
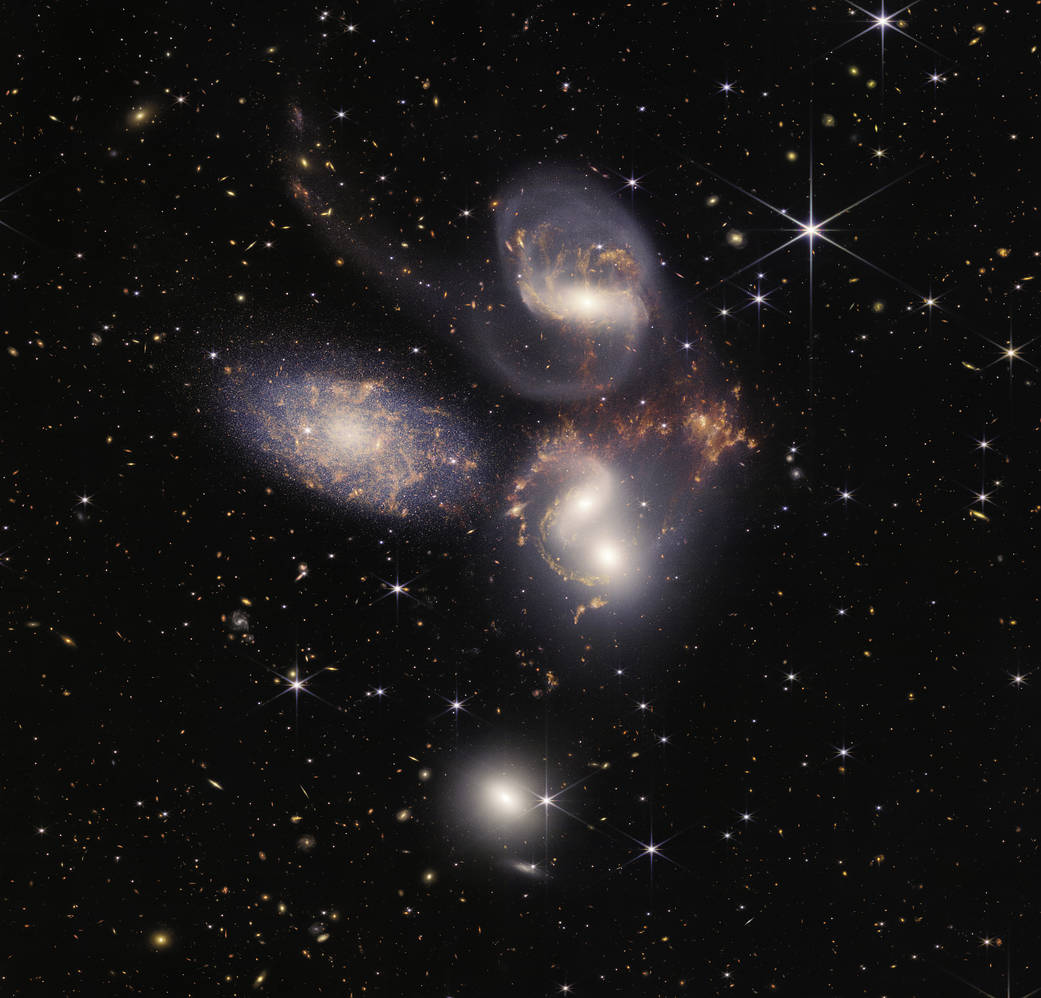
NGC 7317, NGC 7318A /
7318B, NGC 7319, and NGC 7320, or Stephan's Quintet of
galaxies (also known as Hickson Compact Group 92; HCG 92).
More about this enigmatic group may be found in chapters VIII
and IX.
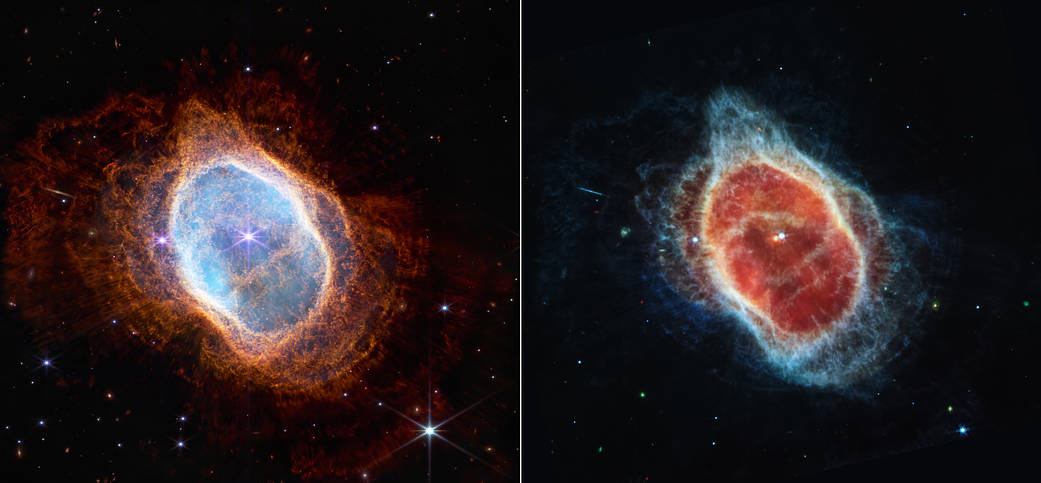
NGC 3132, Southern Ring Nebula ~2,500
light-years distant, a planetary nebula of gas and dust shed
away by a dying star (<5 solar masses), which after
swelling into a red giant, has blown away the shells of gas
and dust, leaving a white dwarf, for the first time revealed
as swaddled in dust (taken by two JWST cameras). Note the
distant galaxy, edge-on at about 10 o'clock.
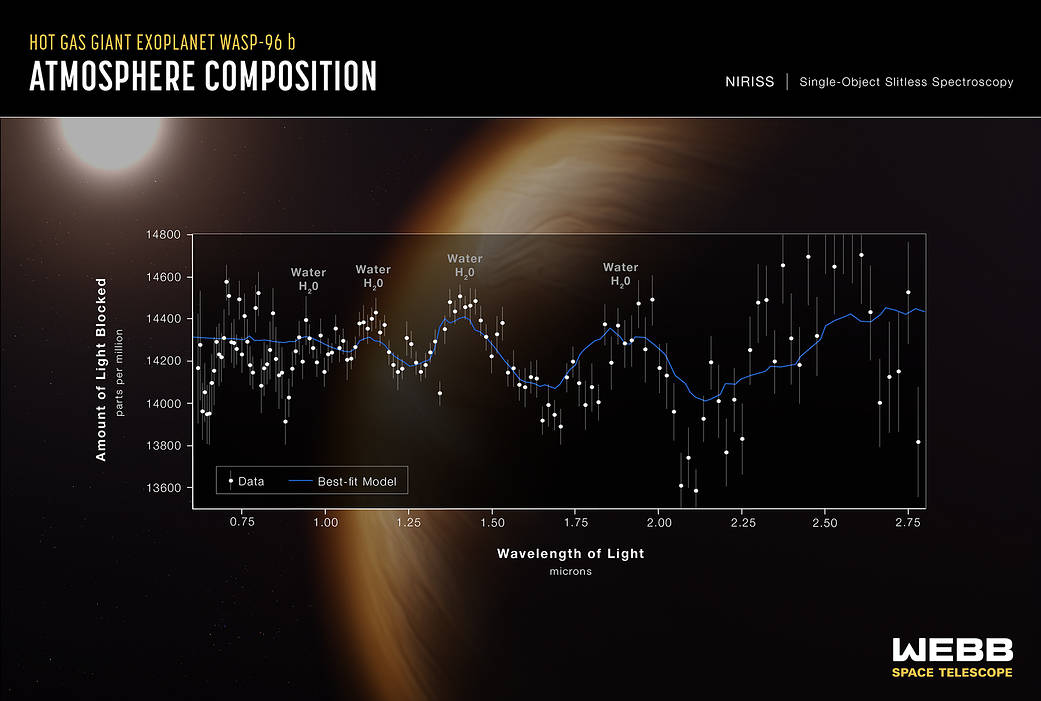
Representation of a spectrum (taken by
JWST) indicating the presence of an H2O
absorption spectrum on a hot gas giant planet (~0.48 Jupiter
masses) called WASP 96b (found in 2013 by the Wide Angle
Search for Planets) which is only 0.0453 AU (astronomical
units, ~93 million miles, Sun-Earth distance) from its star,
WASP 92, with an orbital period of only about 3.4 days (link).
Happy
Birthday, JWST (12 July 2023). On the first
anniversary, the JWST gallery released the following
image of the birth of Sun-like stars
An Excursus on Stellar
Evolution & Stellar Ages in Cosmology
(This section will ultimately be
re-located to chapter III,
but is temporarily for reference here).
The Hertzsprung-Russell
classification of stars by spectral type and
luminosity (as absolute magnitudes were determined
using established distances through Sun-Earth parallax
calculations).
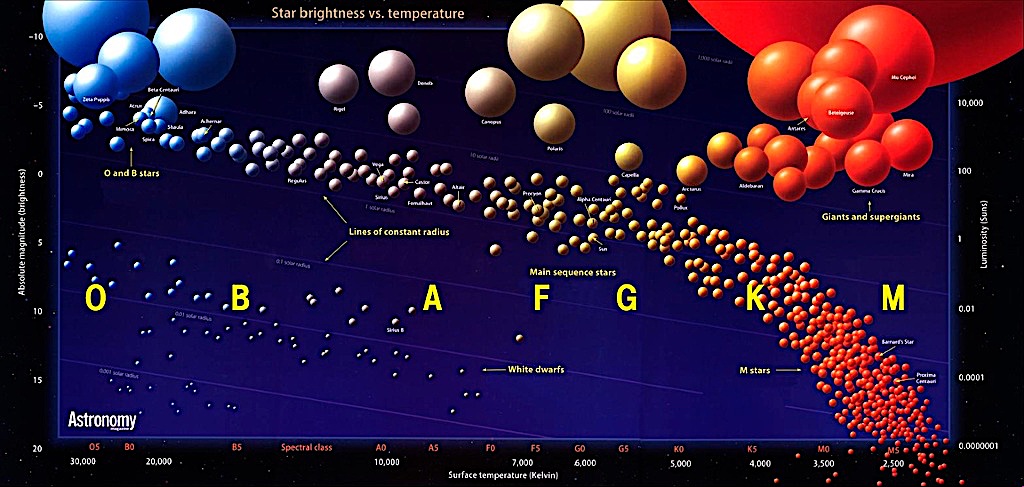 Start brightness vs temperature
(top axis), stellar surface temperature in Kelvins (bottom
axis), brightness in absolute magnitude (left vertical
axis), and luminosity in solar units (right vertical
axis); from https://www.thinglink.com/scene/713103122389532674
(also has linked nearby constellation examples of various
ones of these stellar types).
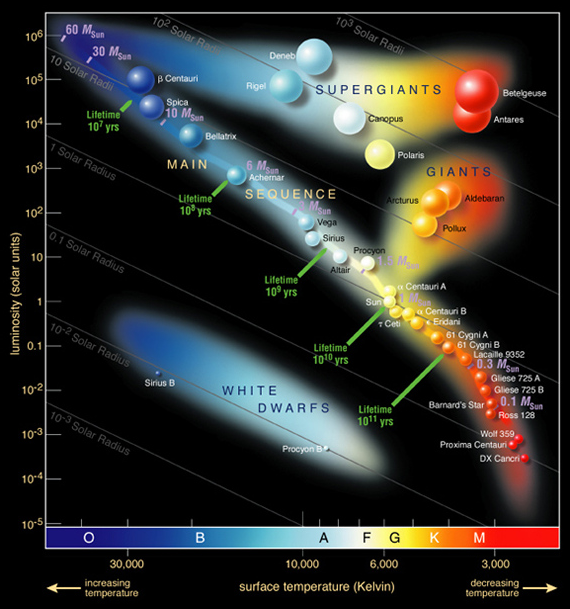
Start brightness vs temperature
(top axis), stellar surface temperature in Kelvins (bottom
axis), brightness in absolute magnitude (left vertical
axis), and luminosity in solar units (right vertical
axis); from https://www.thinglink.com/scene/713103122389532674
(also has linked nearby constellation examples of various
ones of these stellar types).
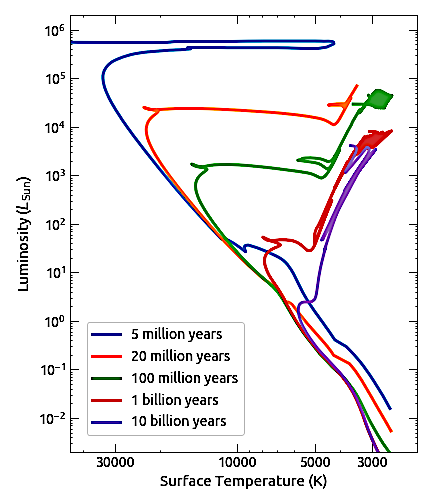
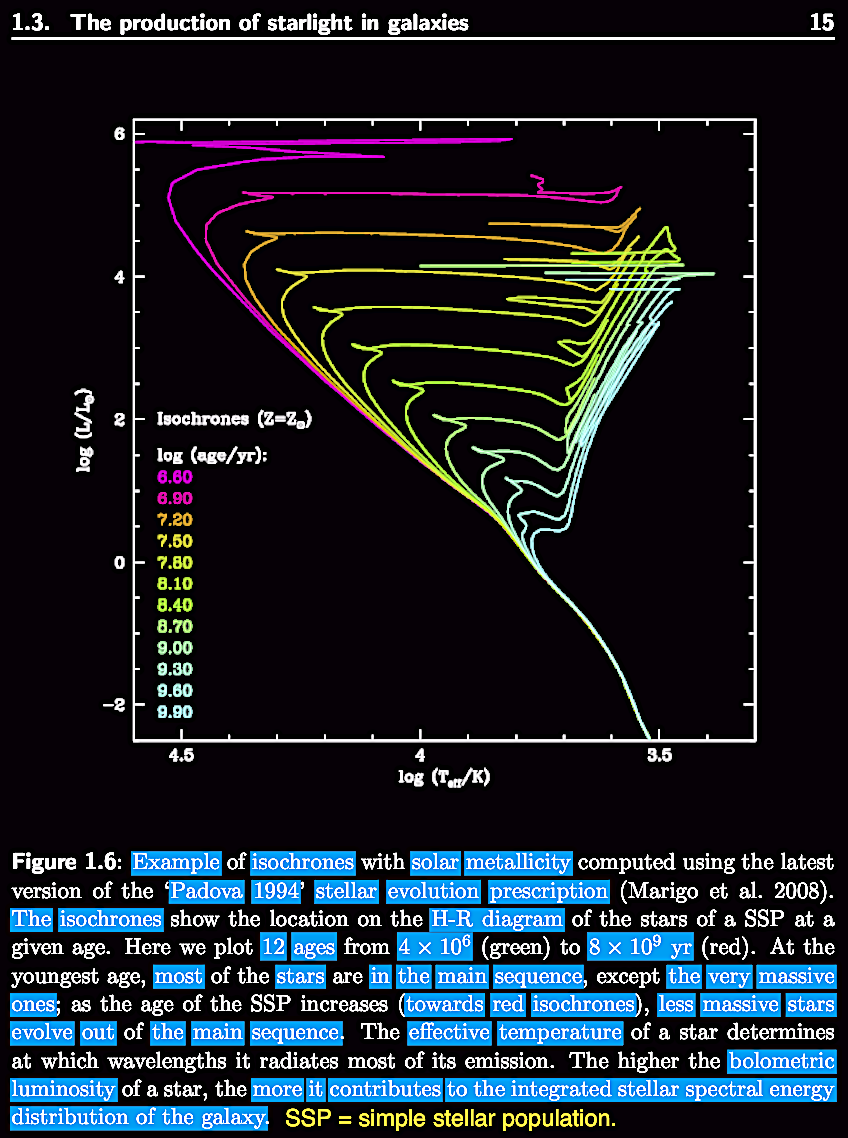
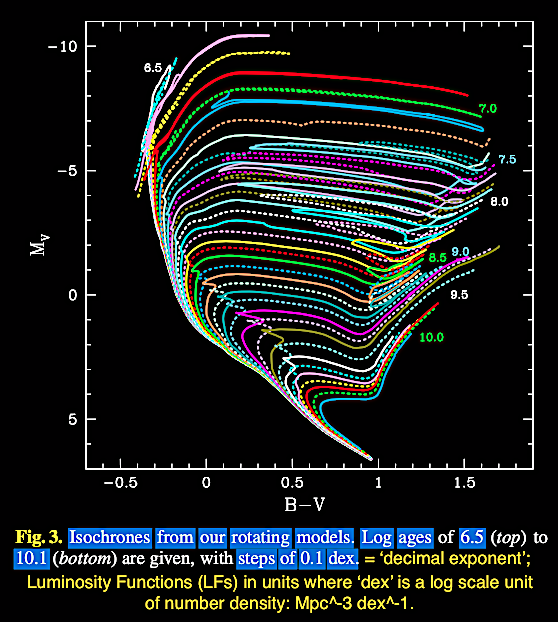
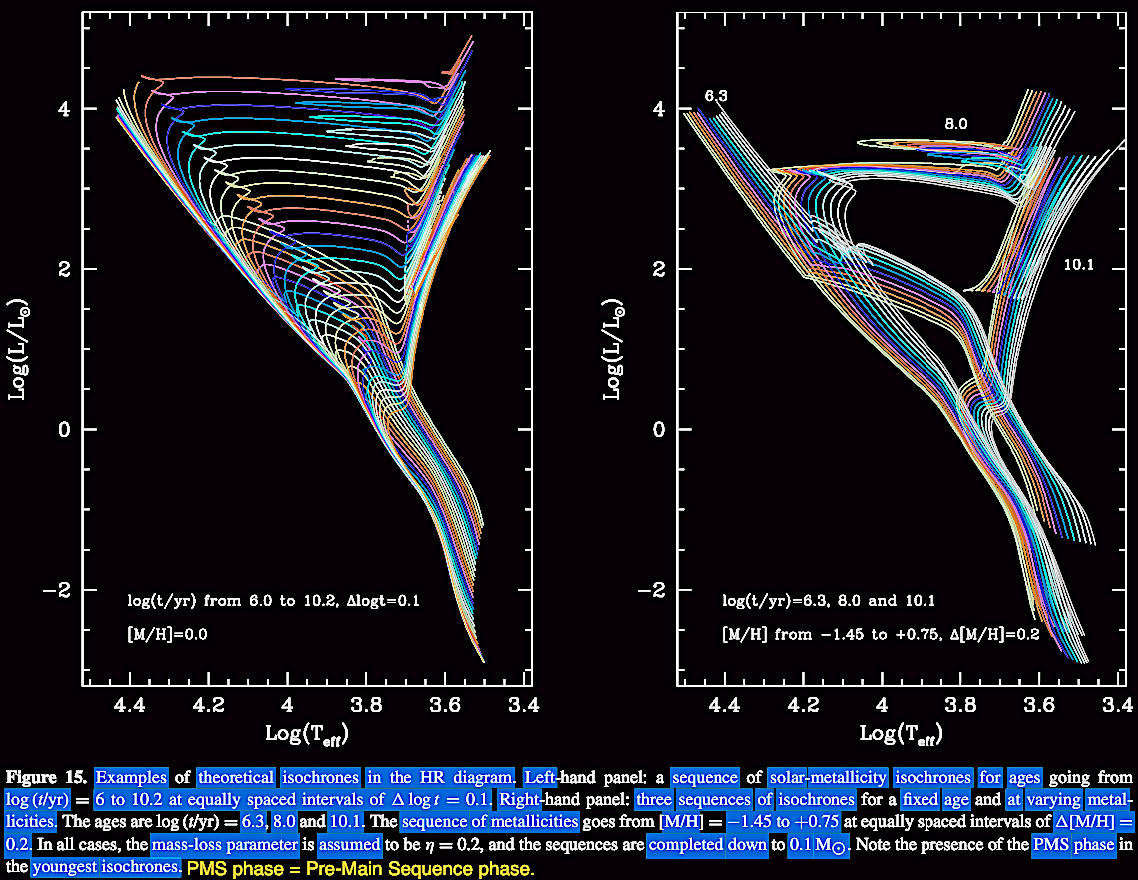
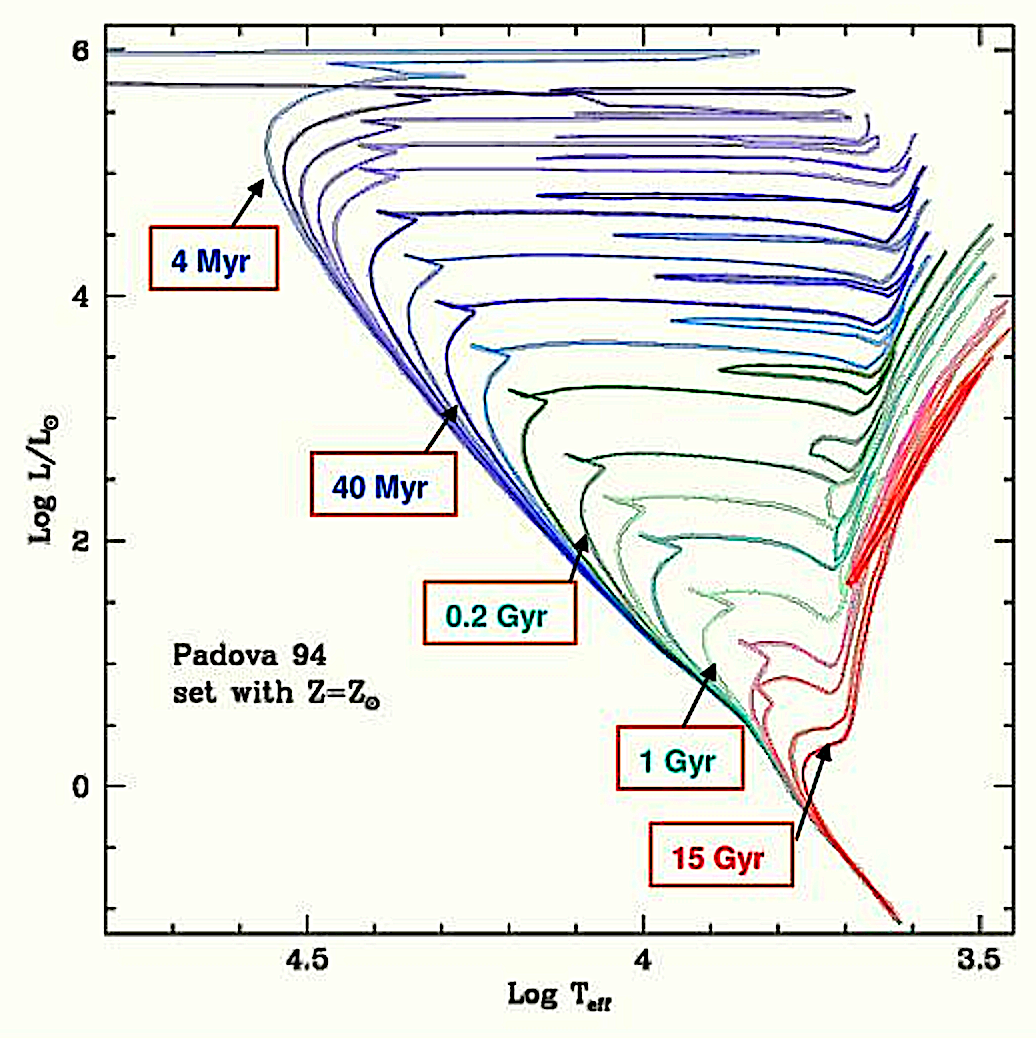
Use of stellar isochrone (&c.) dating in
the Hertsprung-Russell (HRD) and Color-Magnitude (CMD)
Diagrams:
 (link; link). (link; link).
|
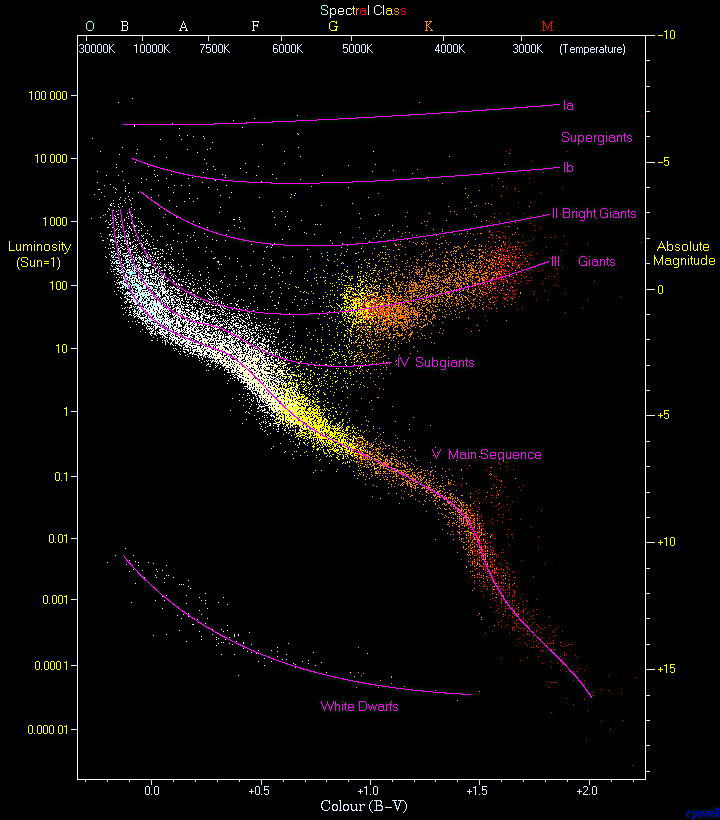
22,000
stars from the Hipparcos Catalogue along
with 1000 nearby stars from the Gliese
Catalogue (link).
|
|
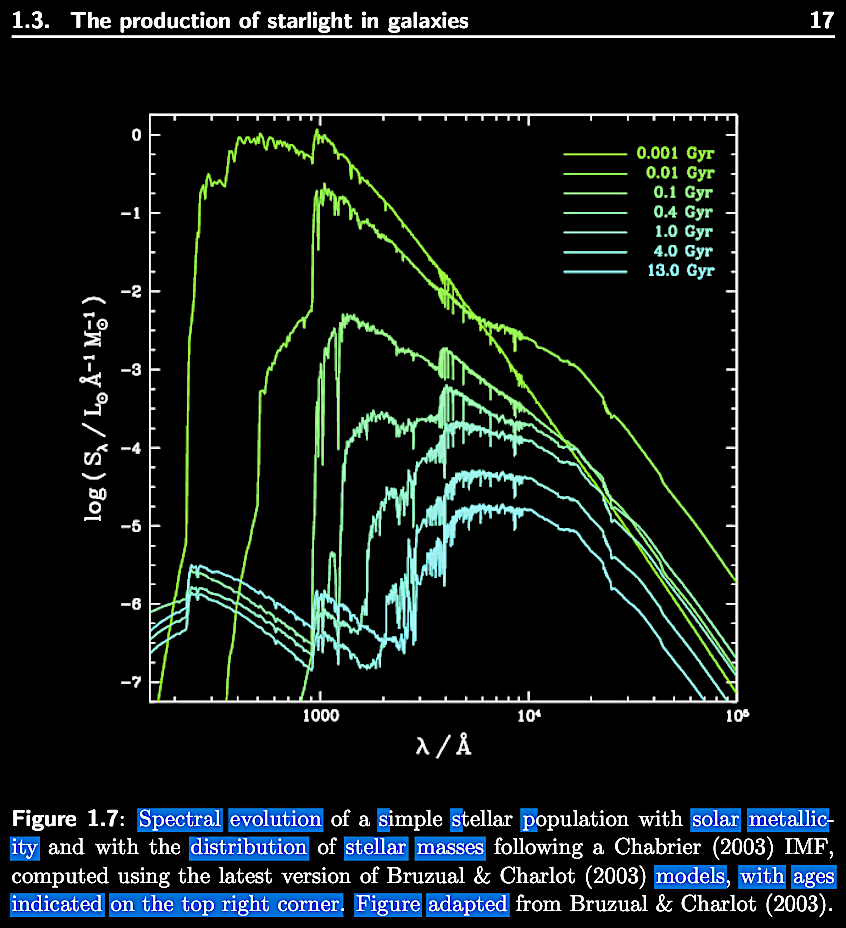
Figures 1.6 and 1.7 from
Elizabete da Cunha, 2008, 2010. Modélisation
des Distributions Spectrales d'énergie des
Galaxies de l'Ultraviolet à l'Infrarouge.
Ph.D. Dissertation. Institut d'Astrophysique de
Paris, CNRS (UMR 7095), Universite Pierre &
Marie Curie; 185 pp. https://www.researchgate.net/publication/41053015.
|
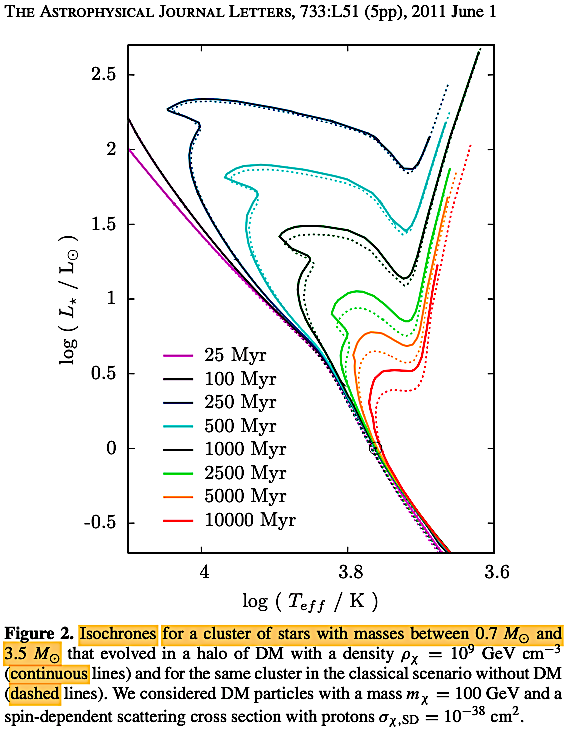
Casanellas, J. & Lopes, I.
2011. Signatures of dark matter burning in nuclear
star clusters. ApJL 733 (2), L51.https://iopscience.iop.org/article/10.1088/2041-8205/733/2/L51.
Note the isochrones, even though put in the
context of supposed unknown 'dark matter' (DM).
|
Ekstrom et al. 2012. Grids of
stellar models with rotation. I. Models from 0.8
to 120 M⊙ at solar metallicity (Z
= 0.014). A&A 537, A146. https://doi.org/10.1051/0004-6361/201117751.
|
Bressan et al. 2012. PARSEC: stellar
tracks and isochrones with the PAdova and TRieste
Stellar Evolution Code. MNRAS 427
(1), 127. https://doi.org/10.1111/j.1365-2966.2012.21948.x.
Cf. Bressan et al. 2013. Red Giant
evolution and specific problems. 40th Liege
International Astrophysical Colloquium. Ageing Low
Mass Stars: From Red Giants to White Dwarfs. EPJ
Web of Conferences 43, 03001. https://doi.org/10.1051/epjconf/20134303001,
and Meyner & Maeder, 2000. Stellar evolution
with rotation V: Changes in all the outputs of
massive star models. https://arxiv.org/abs/astro-ph/0006404v1.
|
June Murcell (2014) on stellar
counts between color magnitude diagram (CMD) and
star formation history (SFH) slideshare.
|
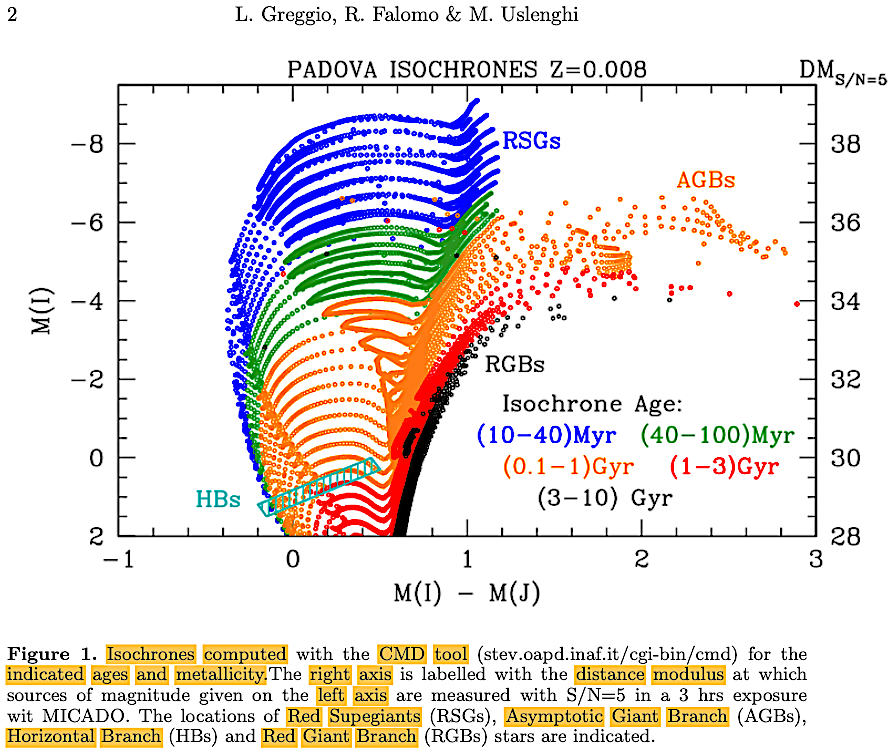
Greggio, L., Falomo, R., &
Uslenghi, M. 2015. Studying stellar halos with
future facilities.
In A. Bragaglia, M. Arnaboldi, M. Rejkuba
& D. Romano, eds. Proceedings IAU
Symposium 11, S317.
https://www.researchgate.net/publication/282844079.
|
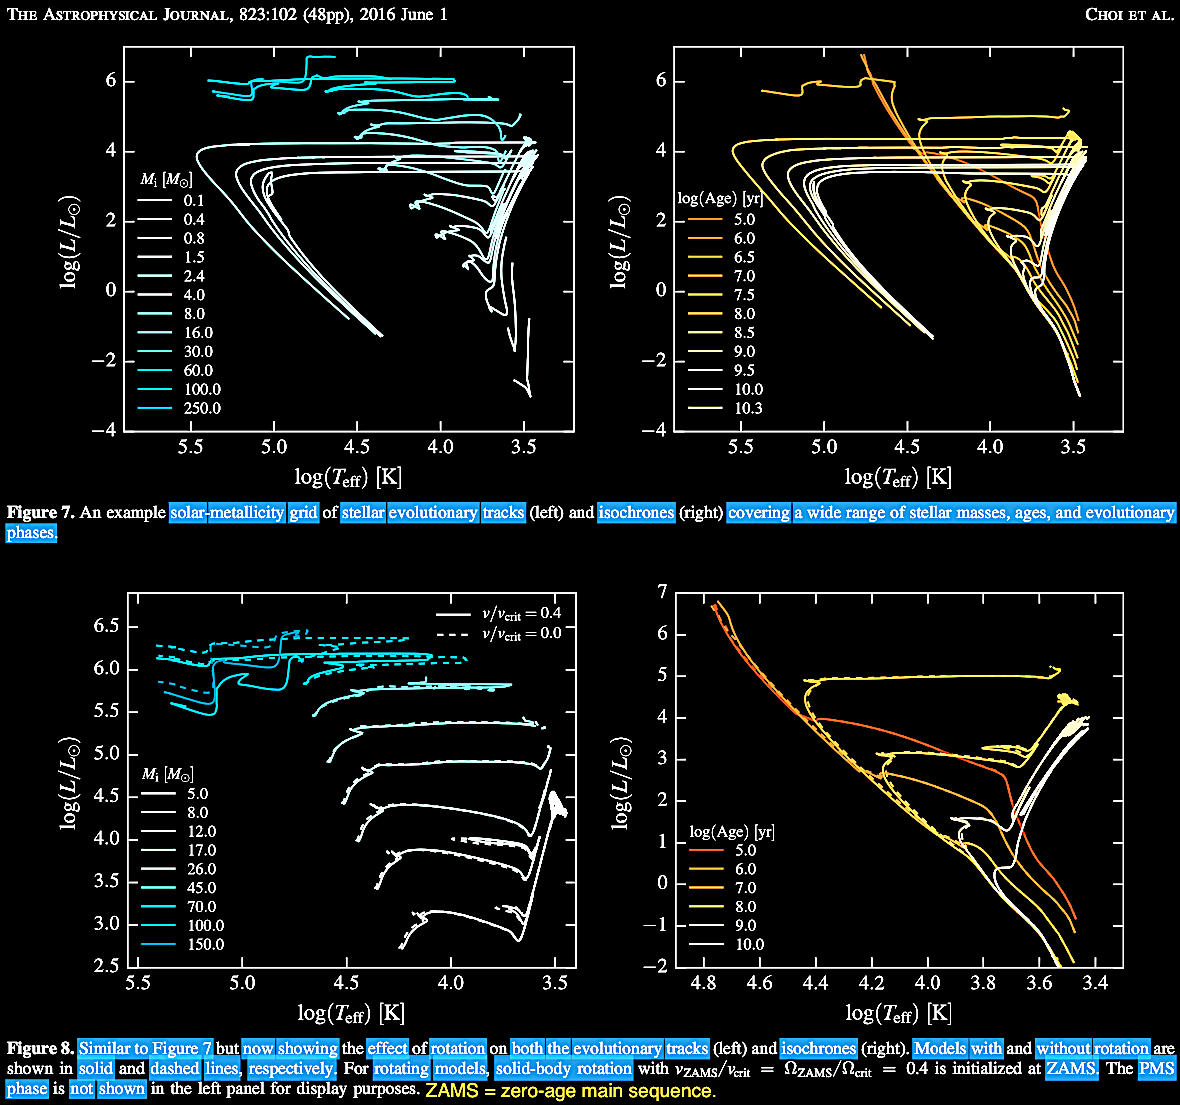
Choi et al. 2016. MESA
isochrones and stellar tracks (MIST). I.
Solar-scaled models. ApJ 823 (2),
102. https://iopscience.iop.org/article/10.3847/0004-637X/823/2/102.
|
Choi
et al. 2016. MESA isochrones and stellar
tracks (MIST). I. Solar-scaled models. ApJ
823 (2), 102. https://iopscience.iop.org/article/10.3847/0004-637X/823/2/102.
|
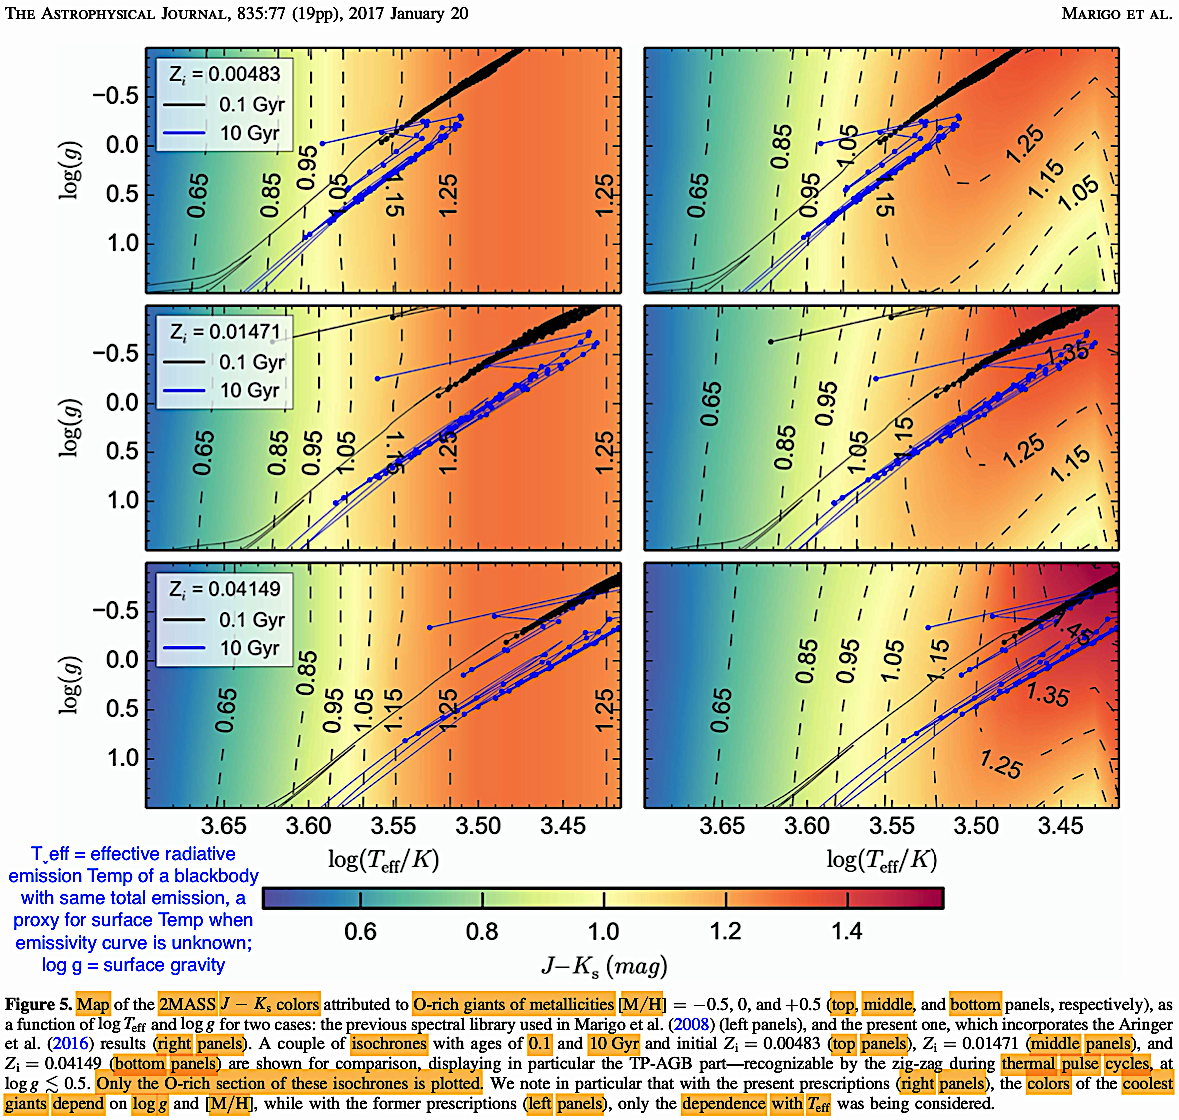
Marigo et al. 2017. A new
generation of PARSEC-COLIBRI stellar isochrones
including the TP-AGB phase. ApJ 835
(1), 77. https://iopscience.iop.org/article/10.3847/1538-4357/835/1/77.
|
Chiba, R. & Schonrich, R.
2021. Tree-ring structure of Galactic bar
resonance.
MNRAS 505 (2), 2412. https://doi.org/10.1093/mnras/stab1094.
|
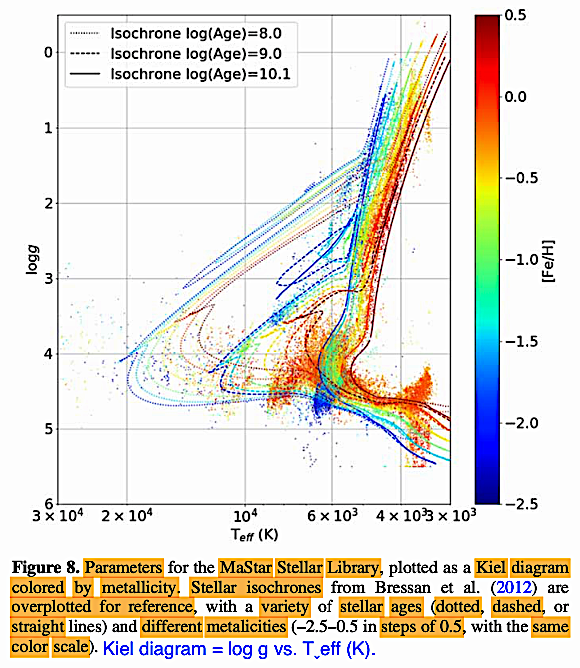
Imig et al. 2022. SDSS-IV
MaStar: Data-driven parameter derivation for the
MaStar Stellar Library.
AJ 163 (2), 56. https://doi.org/10.3847/1538-3881/ac3ca7.
|
Working from their own 2015 model,
Angus et al. 2019. Toward precise
stellar ages: Combining isochrone fitting with
empirical gyrochronology. AJ 158
(5), 173. https://doi.org/10.3847/1538-3881/ab3c53,
provided a hierarchical Baysian statistical
package, Stardate (https://doi.org/10.5281/zenodo.2712419),
for combining isochrones of the
Hertzsprung-Russell Diagram (HRD) and the
Color-Magnitude Diagram (CMD) with rotational
behavior of stars, gyrochronology to model and
predict the difficult ages of subgiant and low
mass main sequence stars (FGKM), calibrated by
known stars. 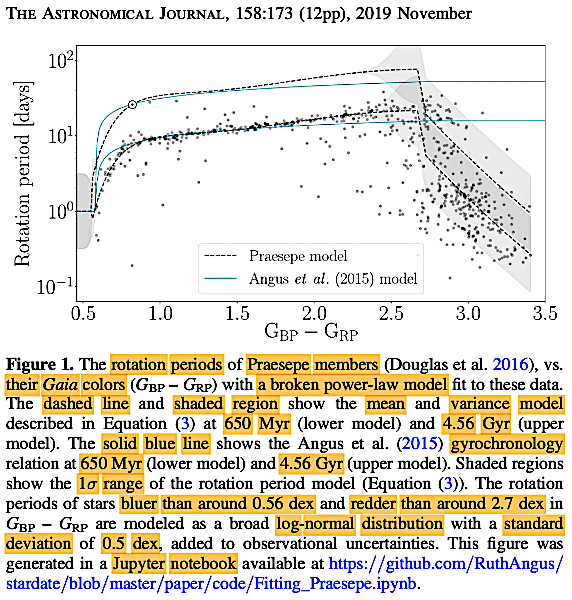
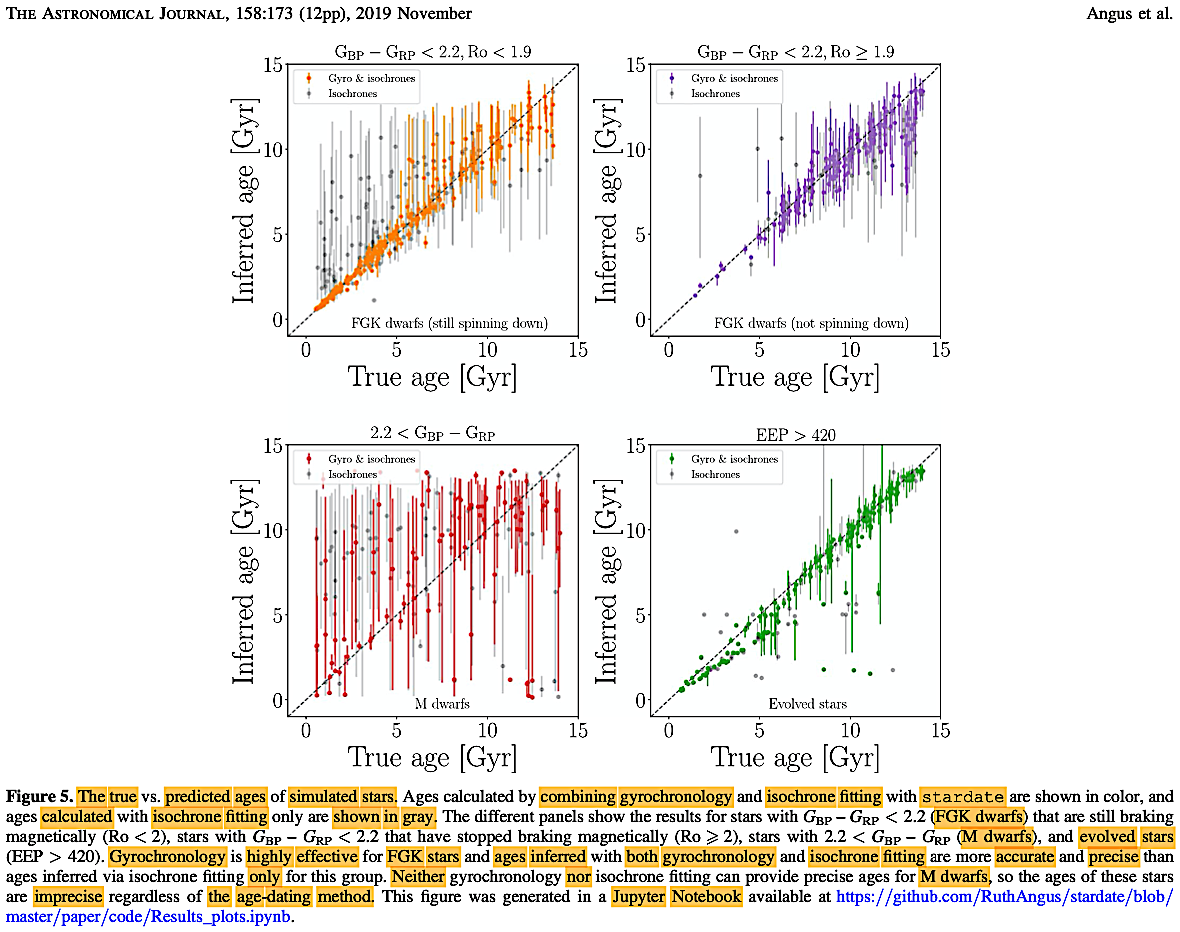
|
It
is important to note that since M dwarf stars
(as pointed out) are difficult to precisely
date for many reasons doubtless, so their
dates can definitely be greater than sometimes
found in HBBC-constrained estimates. This
suggests possible tests for other cosmological
models not limited by the HBBC time-frame.
For example,
in the QSSC and kindred old / eternal Universe
cosmologies, the highly stable, long-lived
~0.7 M☉ M stars could have
ages on the order of ~15 - ~25 Gya, far beyond
the HBBC time constraints. The existence of
such stars is again a potentially-testable
cosmological prediction for data in stellar
evolution, especially if modelers don't rule
them out a priori for paradigmatic
reasons.
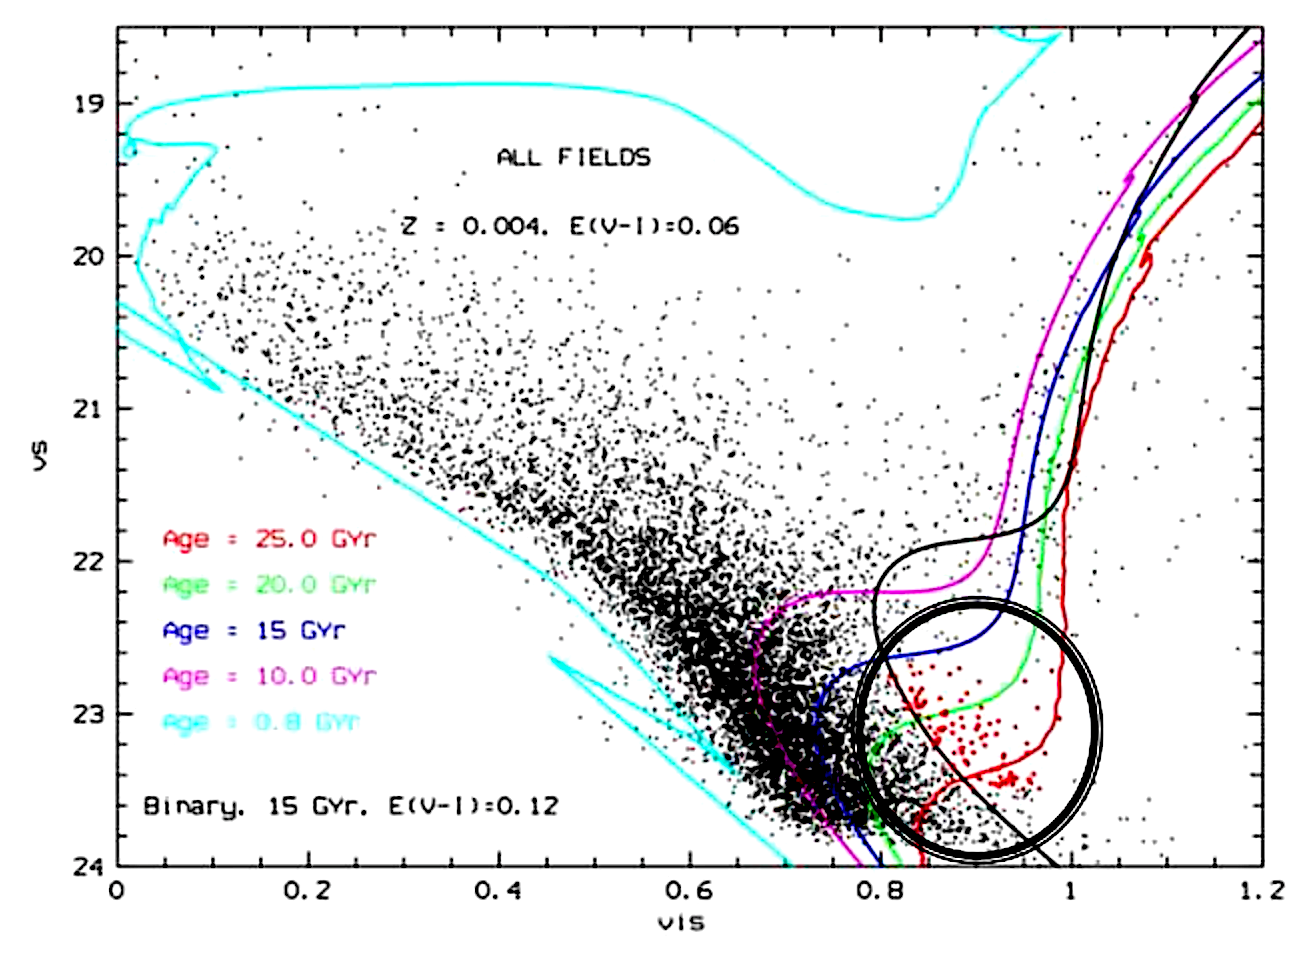
The Milky Way satellite galaxy, the stars of the
Large Magellanic Cloud (LMC) in the HST data
σ(V-I) < 0.02 in the Color-Magnitude Diagram
(CMD), cited in J. V. Narlikar's talk, "The case
for an alternative cosmology" (link),
given in a colloquium at the Copernicus Center for
Indisciplinary Studies, Jagiellonian University,
Krakow, Poland (link).
|
Databases & Resources: "PARSEC
stellar evolution code" (https://people.sissa.it/~sbressan/parsec.html);
CMD 3.7: web interface for stellar isochrones and their
derivatives (http://stev.oapd.inaf.it/cgi-bin/cmd);
cf. older Padova database of stellar evolutionary tracks
and isochrones (https://pleiadi.oapd.inaf.it/);
also cf. Gerardi & Marigo presentation on updating the
Padova database of stellar tracks and isochrones (https://www.astro.rug.nl/~sctrager/FTSPM/Girardi.pdf).
In light of
the data discussed throughout this history of
cosmology, the evolution of stellar ages of open,
globular clusters, and of the galaxies and other
extra-galactic objects with stars are key to examining
the assumptions and testing any hypotheses which
underlie any cosmology postulating a cosmos of finite
duration. Stellar ages greater than (>) or much
greater (>>) ~14 Gya should not be ruled out a
priori.
As
we prepare to critically examine the JWST data, as well as
reminding ourselves about stellar ages, it is important to
review the advances made in galaxy morphology classification
beyond the simple Hubble Tuning-Fork (chapter III and
referenced elsewhere). This can be done in a pre-JWST
setting by reference to advances in galactic morphology
classification from other orbiting observatories, such as
the Hubble Space Telescope (HST; link) and the Spitzer
(infrared) Space Telescope (link;
cf. searchable repository: https://sha.ipac.caltech.edu/applications/Spitzer/SHA/),
particularly in the Spitzer Infrared Nearby Galaxies Survey
(SINGS) Hubble Tuning-Fork classification (database: https://irsa.ipac.caltech.edu/data/SPITZER/SINGS/;
cf. https://www.esa.int/Science_Exploration/Space_Science/Fine-tuning_galaxies_with_Herschel_and_Spitzer);
primary papers search on arXiv (results)
and on the Harvard astrophysical data system (results):
Warning in this false-color image set: Old stars
are made to appear as blue when they should be RED
(Hertzsprung-Russell Diagram); young stars made to appear
as red when they should be BLUE (Hertzsprung-Russell
Diagram); lumpy knots of green and red are supposed to be
new stars in their nebulae of gas and dust. This switch
may have been inadvertent, but it unfortunately has the
effect of misleading people about the relative stellar
ages represented by each morphotype.
Cosmology model test. Galaxy morphology (as well as
stellar population ages) are vital in light of consideration
of observational tests for cosmological models which
empirically compare the prevalent galaxy morphologies
between the local Universe populations of galaxies and the
high redshift or high-z Universe populations of
galaxies. Readers, whether amateur astronomers, professional
scientists, or anyone interested, should examine the images
and make comparisons for themselves.
Before 12 July 2022. In 2021, Ricardo
Scarpa and Eric Lerner published a paper asking, Will LCDM
cosmology survive the James Webb Space Telescope? https://www.researchgate.net/publication/361208585.
Over the years during the development and building of the
James Webb Space Telescope (JWST), the Science Working Group
(SWG) and other scientists Space wrote a variety of 'white
papers' on "Potential Science with JWST" with advice
for the telescope builders on the capabilities to be
included, collected by the Telescope Science Institute
(STScI). The builders of JWST fully expected that JWST would
confirm and consolidate the ΛCDM version of
the hot Big Bang model, being tasked among other
objectives certain goals of cosmological model scope
including with
- Revealing
the formation and assembly of galaxies in the
early cosmos.
- Probing the
end of the 'dark ages' before star formation and
the re-ionization epoch after the Big Bang.
- Galaxy
evolution across cosmic time.
- Elucidating
the nature of 'dark energy' as hypothesized to
explain the SNIa results since 1998.
- Primordial
stellar populations, including the hypothetical
'population III' stars.
- And of
course many more local topics such as extrasolar
planets, solar system observations,
astrobiology, & more.
Scarpa & Lerner
(2021) predicted that JWST will not thus confirm the ΛCDM.
The JWST
data they hold will spark a revolution in cosmology,
astronomy, and fundamental physics. JWST is expected to
look farther out and farther back in time into the
Universe than any human instrument before.
Scarpa
and Lerner (2021) closed in the first version of their paper
by correctly
pointing out a possible parallel in that the old
Ptolemaic System did not survive Galileo Galilei's
telescope, and asking if the ΛCDM version of the HBB
Cosmology, what we here have called the New Ptolemaic
System, in its current form, can survive another
telescope, the JWST?
Scarpa & Lerner (2021) made
very specific and falsifiable predictions based on
cosmological models. Let us summarize here in these
select areas. Using a default Euclidean cosmos model as
a null test for the expected values under the ΛCDM paradigm.
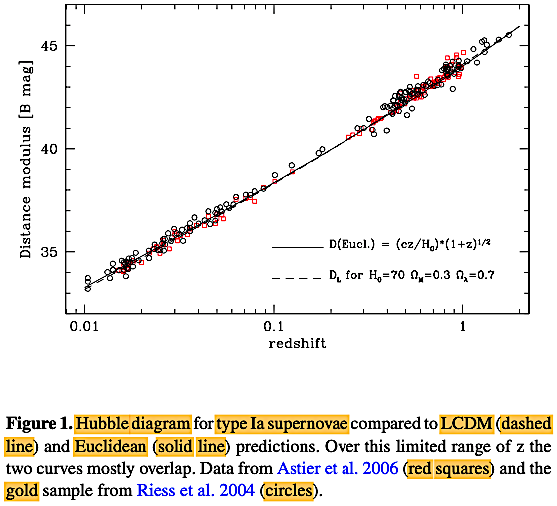
Comparing
the predictions of the ΛCDM (with specific free
parameter settings) with the Euclidean predictions
for type Ia supernovae. These predictions are
indistinguishable out to z > 1. As JWST
pushes those z-values to higher levels, then
Scarpa & Lerner (2021) expect that a divergence
between the ΛCDM and Euclidean Universe predictions
will become more sharply differentiated for
hypothesis-testing.
|
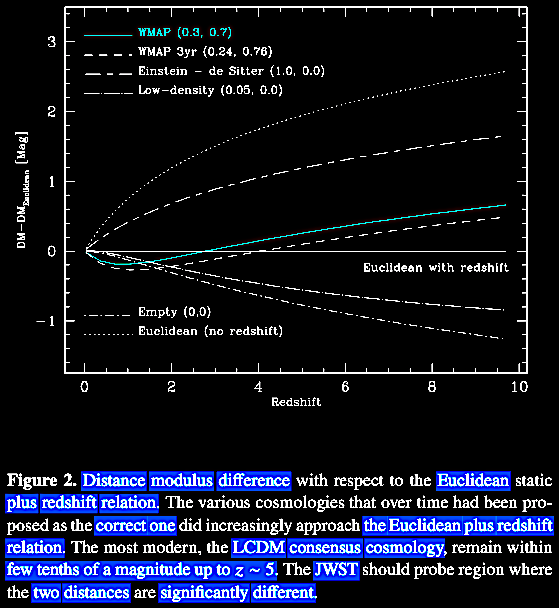
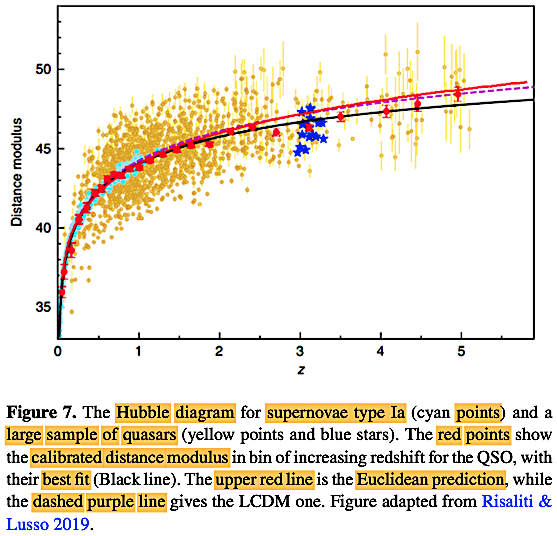
Scarpa
& Lerner (2021) predict, that while there is rough
congruence for distance modulus (μ = m
- M, where m is the apparent
magnitude, and M is the absolute magnitude =
apparent magnitude at 10 parsecs) at different
redshifts or z-values between the WMAP values
and the Euclidean, up to about z ~ 5, at
higher redshifts, there will be a divergence between
the ΛCDM-interpreted WMAP results and the Euclidean
predictions. They forecast that the Euclidean
predictions will be borne out by the JWST data instead
of the ΛCDM-dependent predictions.
|
|
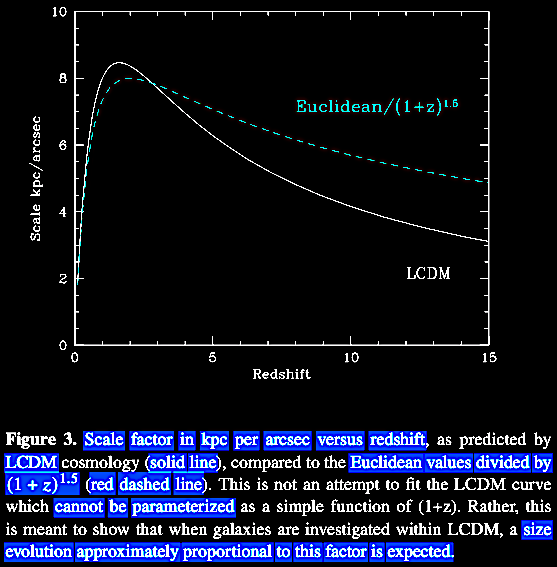
Scarpa
& Lerner (2022) point out that for galaxies with
similar UV luminosities, size is parametrized to
evolve as (1 + z)α, with a
range of -0.75 < α < -1.4. However, in a
Euclidean space up to a redshift of z = 15,
this parameter α
= -1.5, well beyond and removed from the ΛCDM
paradigm of the HBBC expectations.
Inverted color: red = cyan
|
According
to the ΛCDM Big Bang,
galaxies grow over the course of the BB cosmos by
accretion and merging of smaller galaxies of the order
of 𝑀 ≃ 104𝑀⊙, so there is
supposed to be a size evolution, with small, irregular
galaxies common in the cosmic past. However, in a
Euclidean cosmos, there is not a size evolution.
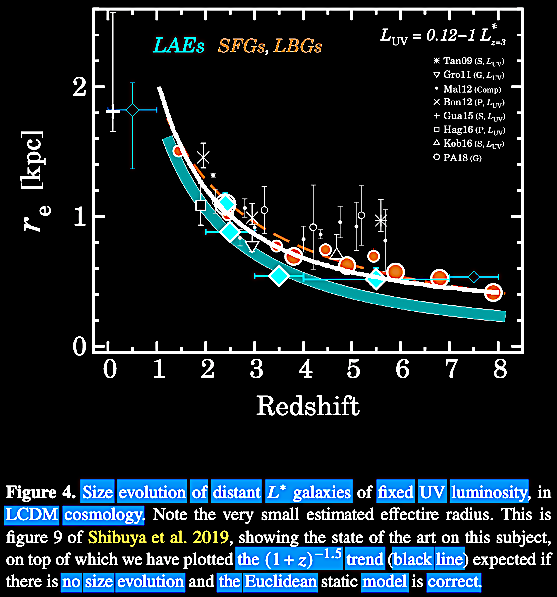
Shibuya et al. (2019 & the references they
cite). Morphologies of ∼190,000 galaxies at z
= 0-10 revealed with HST legacy data. III. Continuum
profile and size evolution of Lyα Emitters. ApJ
871 (2), 164. https://doi.org/10.3847/1538-4357/aaf64b,
found using the model-independent Sersic index of
brightness intensity distribution. Lyman-α emitting
galaxies (LAEs), star-forming galaxies (SFGs), and
Lyman-break galaxies (LBGs) with their data curves are
shown here compared with Euclidean predictions (heavy
white line) where there is no size evolution and the
trend follows (1 + z)-1.5, such as
would be expected in an infinite, eternal Euclidean
Universe, rather than a dimming ~ (1 + z)-3
with size evolution which is not observed, requiring a
free parameter adjusted reformulation to keep it in
harmony with the ΛCDM
Big Bang model, re ∝ (1 + z)-1.37 +/-
0.65 (which by the way, includes the Euclidean
prediction of (1
+ z)-1.5 to approximate the data.
See the parameter α discussion with Fig.
3. It should be noted that the size-luminosity
relation of the LAEs decreases monotonically toward
higher z-values, but Shibuya et al.
(2019) claim otherwise for the SFGs and LBGs which
evolve according to re ∝ (1 + z)-1.37 +/-
0.65, which includes the (1 + z)-1.5
prediction for a Euclidean model, claiming that
this may mean that LAEs "are probably biased to
faint sources at low redshift" showing that they
have not really grappled with the implications of
their data.
|
|
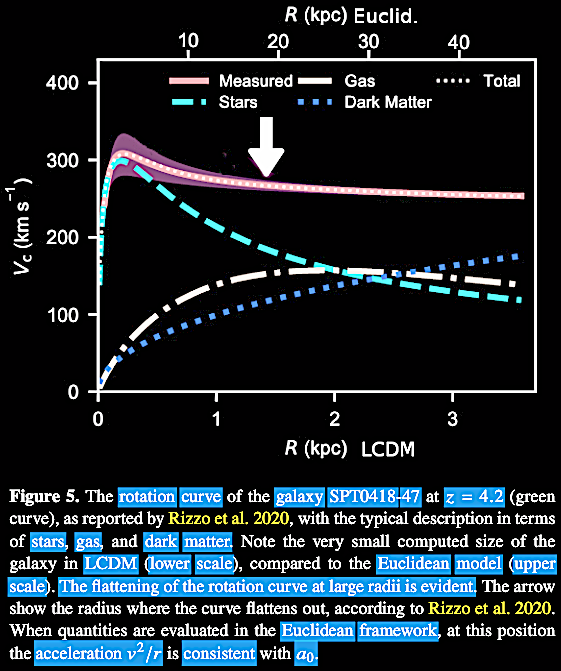
They point
out that in the local Universe, large spiral galaxies
have characteristic velocity rotation profiles
leveling off at around 280 km s-1, as one moves outward from the
core by several kpc. It is this which is supposed to
be an indication of 'dark matter' under standard
gravitation or requiring MOND to explain. Under the
HBBC ΛCDM paradigm, galaxies are supposed to be much
smaller in the past, so this is a test for whether
ΛCDM or Euclidean predictions are met. Already in
Rizzo et al. (2020) cited, the spiral galaxy
SPT0418-47 at z = 4.2, with the angular radius
chosen by Rizzo et al. (2020), there is a
linear radius of ~19 kpc and a 𝑉2/𝑟 = 1.4 x 10⁻⁸
cm s-2, which agrees with the local
Universe values, i.e., no evolution there. In other
words, it seems that this spiral galaxy is like our
spiral Milky Way, except located at z = 4.2!
What would be expected in steady state or Euclidean
model. The JWST
will tell us whether this trend continues to higher
redshift values.
|
Without
all of the ΛCDM free parameter fitting and adjusting,
the Euclidean model predicts the scatter in QSO
redshifts just as well as or just as poorly (they add)
as the ΛCDM must have just to remain
viable at all, with all of the parameter-fitting.
See the discussion of the data of Resaliti &
Luzzo (2019) in chapter VII,
"Unexpected Redshifts."
|
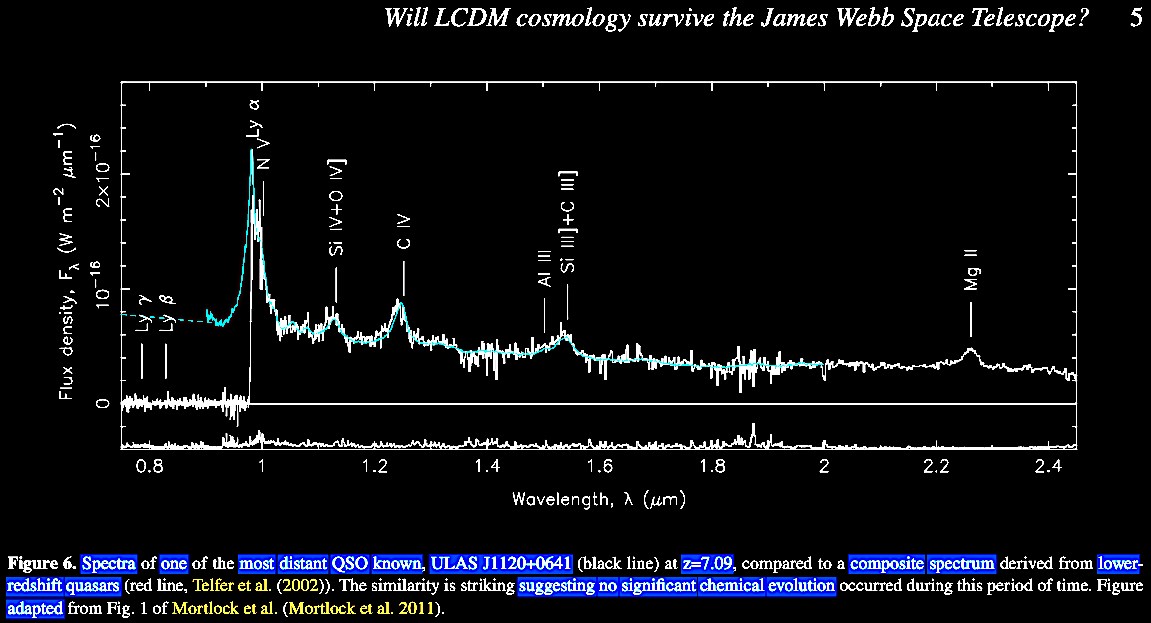
Scarpa & Lerner (2021).
The chemical evolution found in even very distant QSOs shows
that there is plenty of metallicity as indicated by distant
quasar ULAS J1120+0641, with a redshift of z = 7.09,
i.e., a calculated look-back time of 12.964 Gya (supposedly
0.758 Gyr
post-BB). This high metallicity is surprising and not
expected for a quasar, let alone a quasar of that redshift,
under the HBBC ΛCDM paradigm. Citing the Mortlock, D.,
Warren, S., Venemans, B. et al. 2011. A luminous
quasar at a redshift of z = 7.085. Nature 474,
616. https://doi.org/10.1038/nature10159,
Scarpa & Lerner (2022) point out that quasars are
self-similar at all redshifts, indicating that they should
have minimal physical or chemical evolution, however, as ULAS J1120+0641 illustrates, there is
plenty of chemical evolution and metallicity in this
high redshift quasar.
(Scarpa & Lerner, 2021).
Scarpa &. Lerner (2020) conclude in their own words, "We
have presented a short list of cases - other[s] could have
been included, though we believe we made our point clear -
in which data probing the distant Universe have been
interpreted differently from what is usually done. This
alternative interpretation rests on the assumption there is
no expansion of space and the linear Hubble law is valid to
arbitrarily large redshifts. In this framework, distant
galaxies are found to be similar to local galaxies,
indicating nothing special is happening at the largest
probed z. Quasars do suggest the same. All this show
there are little indications that observations are actually
approaching the beginning of the Universe....
Our main conclusion is that the JWST will fail to probe the
Dark Age, because there never was one." They then hope
for these advances in data to inspire a new vision of the
Universe and a revolution in physics.
For further pre-JWST details of the observational data and
pre-JWST predictions of departures from the ΛCDM paradigm,
please see Lerner et al. (2014) and Lerner (2018)
discussed below, under An excursus on the Tolman (1930,
1934) test applied to GALEX & HUDF. Other papers
with their data may be added here as they are relevant to
cosmological tests inherent in the data emerging from the
unfolding saga of JWST below.
Unfolding the JWST
Results
Our approach of
discussing these results will be to cite below when the paper
was first released for the chronology (for example the release
date on arXiv), and then cite and utilize the finished paper
published, when available, to discuss the data of significance
to cosmological theories. [All cosmological calculations
included in this chapter, unless otherwise stated, are done
with the advanced calculator of E. L. Wright, 2006. A
cosmology calculator for the World Wide Web. PASP 118
(850), 1711. https://iopscience.iop.org/article/10.1086/510102,
found at https://www.astro.ucla.edu/~wright/ACC.html;
parameters adjusted from the papers when available. The
calculator's default value is set at H0 =
69.9 km s−
1 Mpc
−1
].
A short excursus
on gravitational lensing. The first deep sky images from
JWST sought to take advantage of gravitational lensing via a
distant Abell cluster of galaxies to 'magnify' more distant
galactic objects beyond. Because of general relativity, which
can model gravity using Riemann spacetime general covariant
curvature, first described by David Hilbert and appropriated
by Albert Einstein (see chapter I for forthcoming details),
'gravitational lensing' of more distant objects by intervening
masses can be illustrated thus:
14 July 2022
(Thursday)
released.
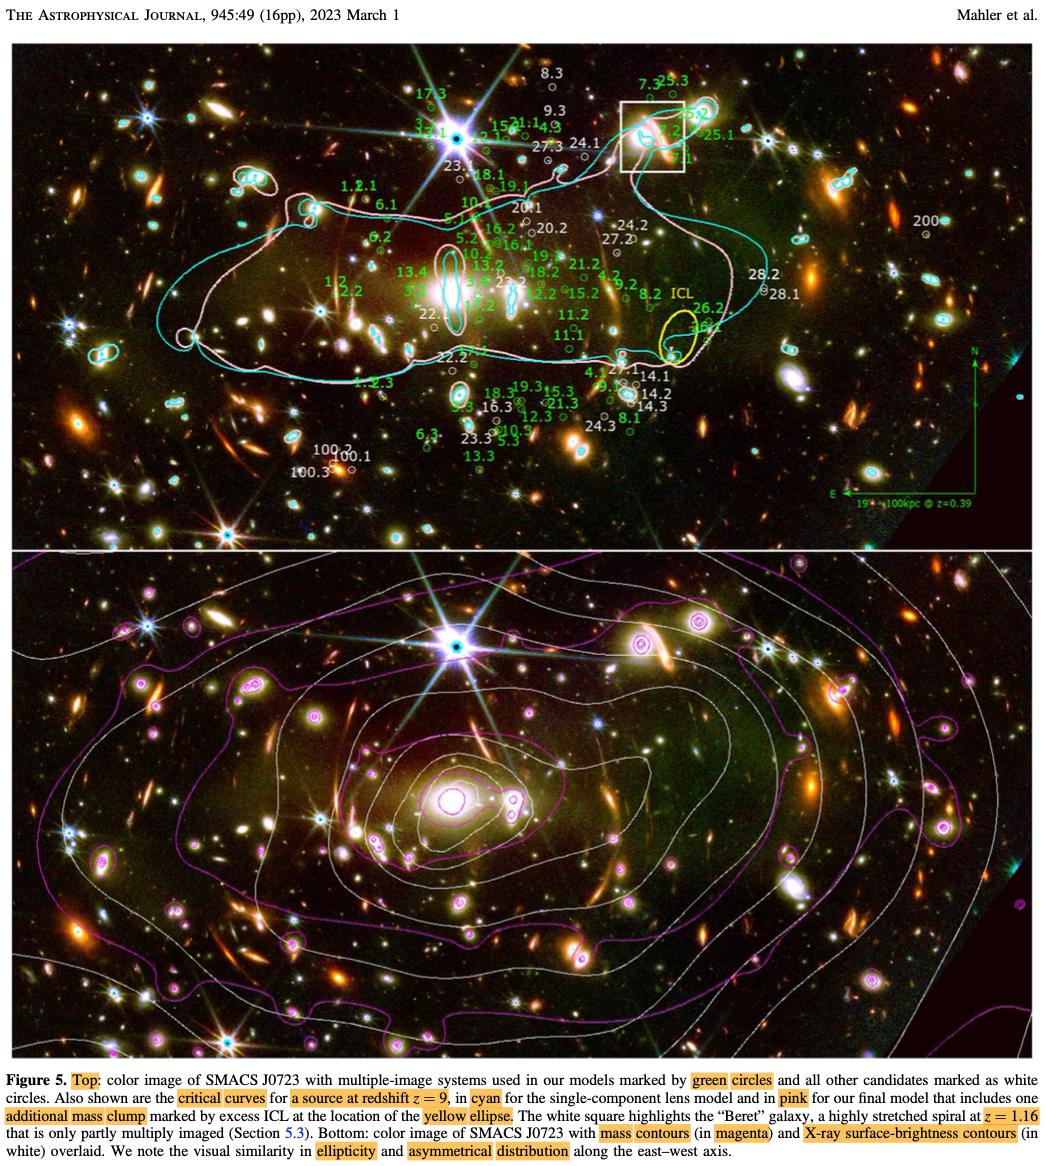
On this date a large research group released their findings (https://arxiv.org/abs/2207.07101),
Mahler et al. 2023. Precision modeling of JWSTʼs first
cluster lens SMACS J0723.3-7327. ApJ 945, 49.
https://doi.org/10.3847/1538-4357/acaea9.
The Abell cluster has an estimated mean redshift of z
= 0.3877, so that its light traveled ~4.2 Gya. They centered
their image (Fig. 1) on the brightest cluster galaxy (BCG) and
overlaid the Chandra X-ray surface brightness isophotes over
that (white contours). Table 1 shows the spectrographic
redshifts of 26 members of the Abell cluster. Figure 5 shows
various contours, including the critical curve (in cyan) for a
lensed source with a z = 9, meaning a light traveling
time of 13.170 Gya. Table 2 has some
spectroscopically-determined redshifts.
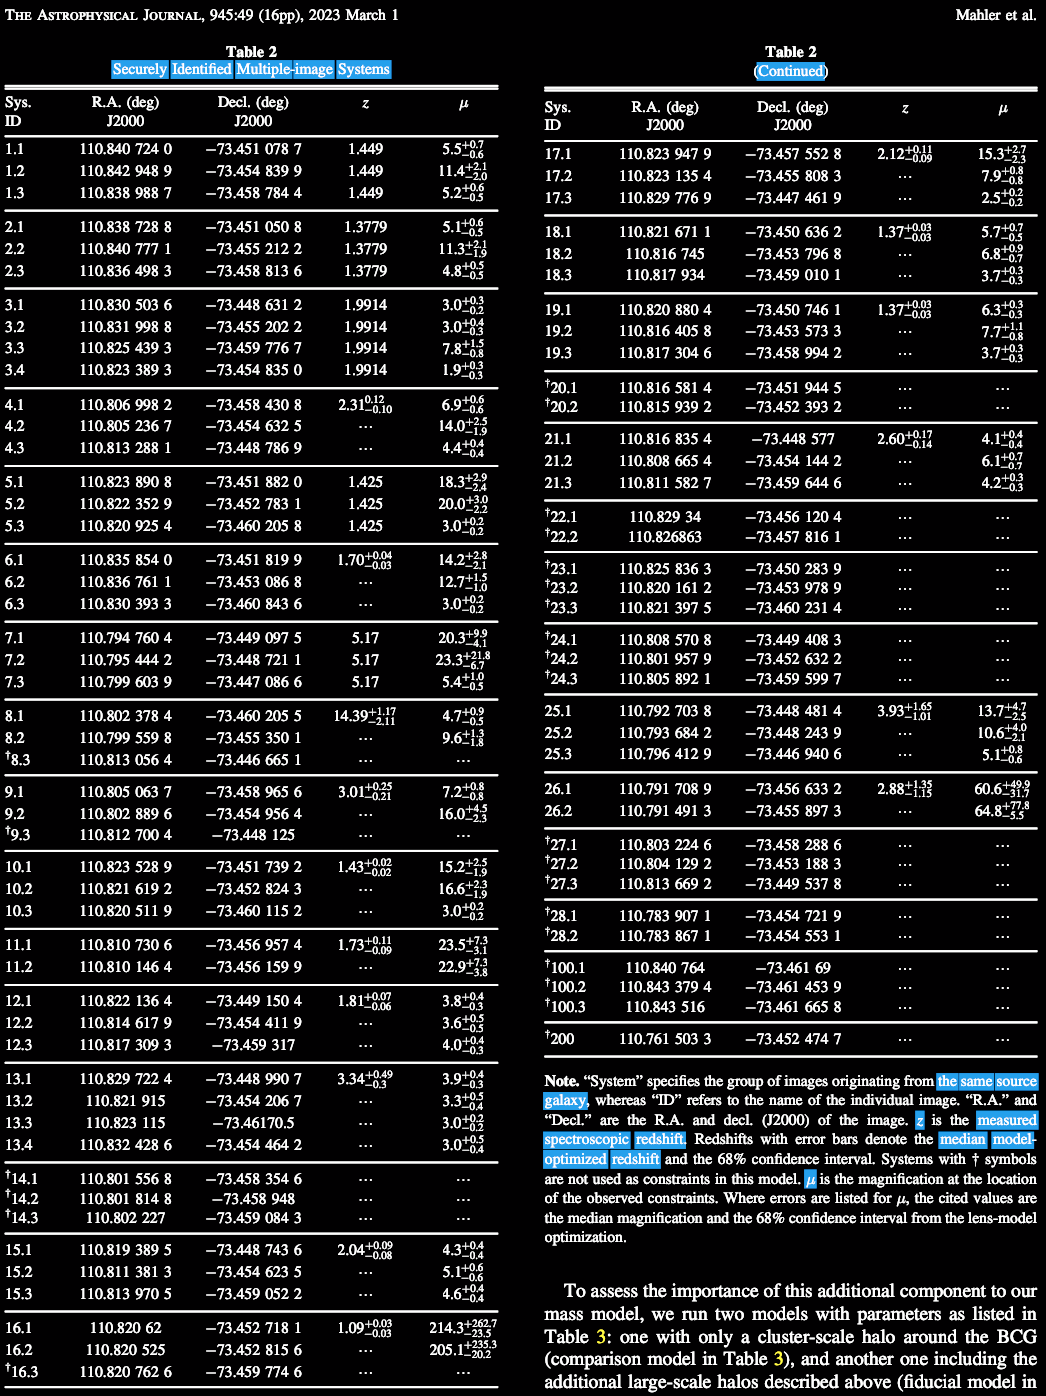
In Mahler et
al.'s (2023) Table 2, we find some very high redshifts
(with their travel distance in light-years calculated via
Wright's advanced cosmology calculator: Wright, E. L. 2006. A
cosmology calculator for the World Wide Web. Publ. Astron.
Soc. Pacific 118 (850), 1711. https://iopscience.iop.org/article/10.1086/510102;
located at https://www.astro.ucla.edu/~wright/ACC.html),
including
the
highest
redshift value
thus far in
that paper, z = 14.39 (look-back
time ~13.434
Gya), which
was higher
than the
highest z-value
(~13.1 Gya) of
any object
observed in
the Hubble
Ultra Deep
Field (HUDF).
These z-values are
already
surpassing
many of the
redshift
values found
in the HUDF
(Radefski et
al. 2015).
A quick tabulation:
Redshift (z)
|
Look-back
times....
|
| z
= 1.09 |
8.166 Gya
|
| z
= 1.38 |
9.092 Gya |
| z
= 1.425 |
9.214
Gya |
| z = 1.73 |
9.918
Gya |
| z = 1.81 |
10.074
Gya |
| z = 1.9914 |
10.391
Gya |
| z = 2.04 |
10.468
Gya |
| z = 2.12 |
10.589
Gya |
| z = 2.31 |
10.849
Gya |
| z = 2.60 |
11.183
Gya |
| z = 2.88 |
11.449
Gya |
| z = 3.01 |
11.558
Gya |
| z = 3.93 |
12.130
Gya |
| z = 5.17 |
12.584
Gya |
| z
= 14.39 |
13.434
Gya |
It should not escape our notice, as
with the various Hubble Deep Fields, that many of the galaxies
with these high redshifts were already galaxies with aging star
populations, indicating that they were old when the light left
them billions of years ago.
Another paper released that day (https://arxiv.org/abs/2207.07102)
was Pascale et al. 2022. Unscrambling the lensed
galaxies in JWST images behind SMACS 0723. ApJ 938,
L6. https://doi.org/10.3847/2041-8213/ac9316,
identified the distant galaxies they considered to be lensed by
this Abell cluster (Figure 1) and the rather considerable
redshifts with differences in some cases between earlier
determined redshifts, the JWST NIRCam (near IR camera), and the
lens model determinations.
19 July 2022
(Tuesday)
released.
Three other notable papers dropped on this late July Tuesday.
After preprint, https://arxiv.org/abs/2207.09434,
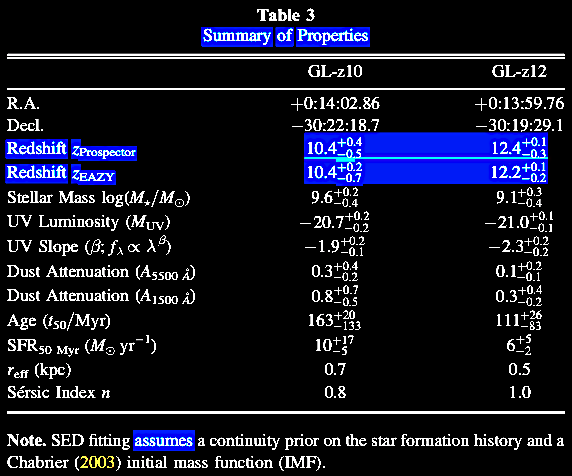
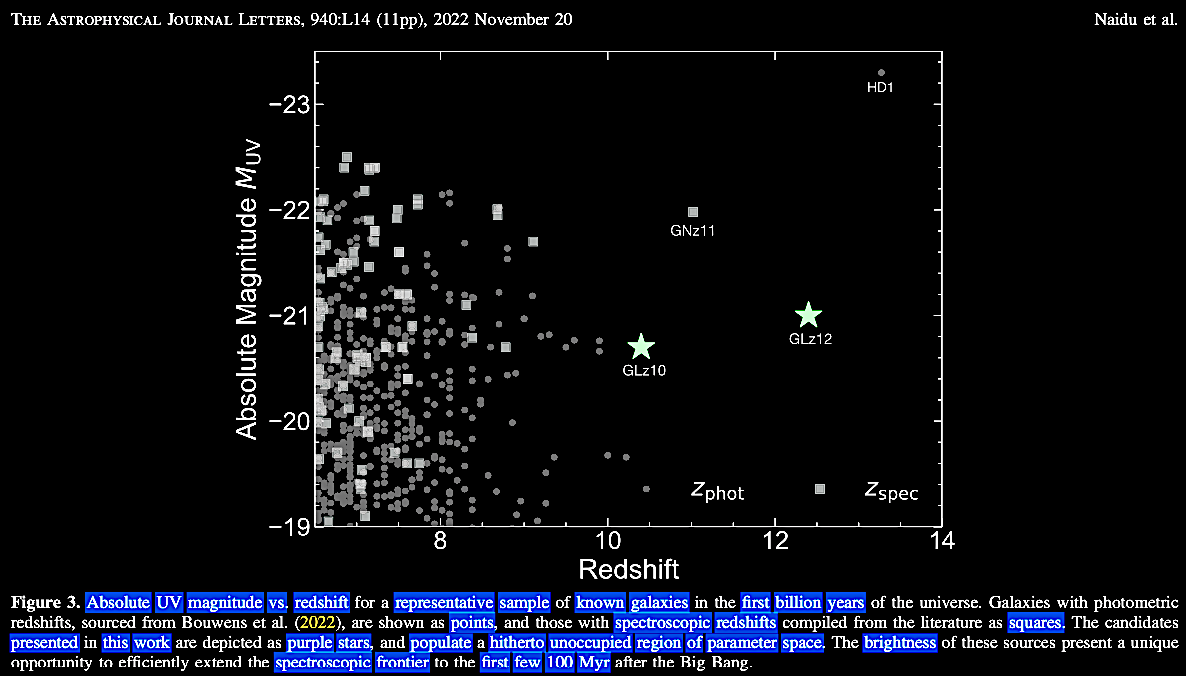
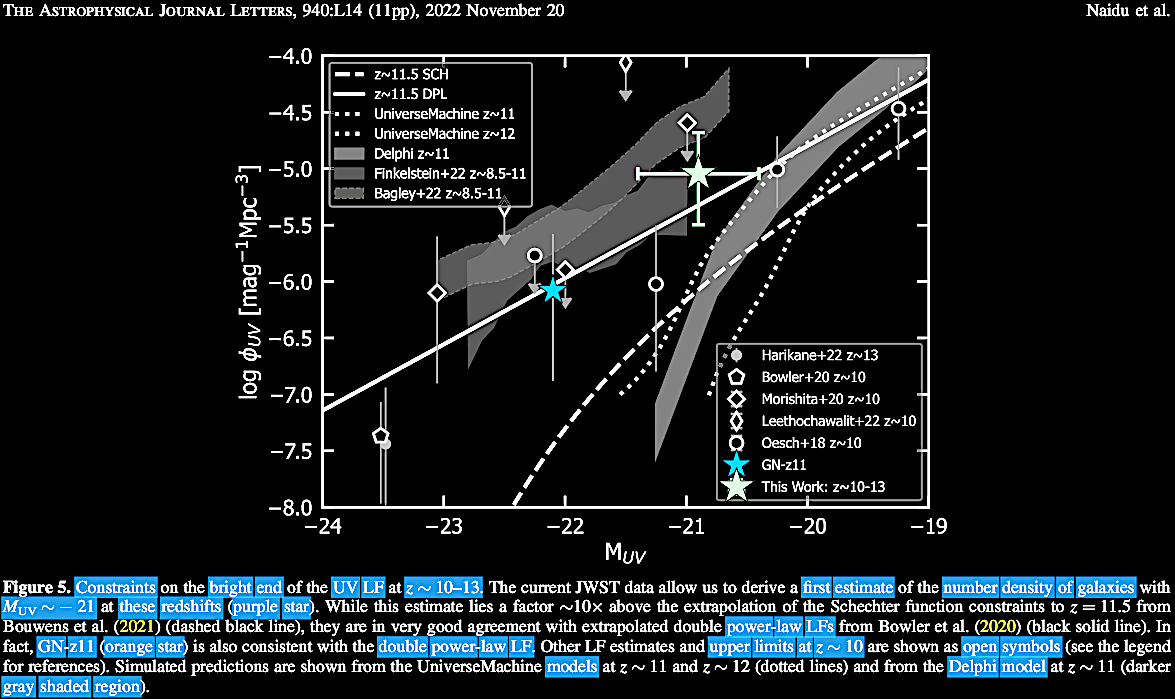
Naidu et al. 2022, published, Two remarkably luminous
galaxy candidates at z ≈ 10-12 revealed by JWST. ApJ 940,
L14. https://doi.org/10.3847/2041-8213/ac9b22.
They weren't the only high redshift galaxies documented by
these astronomers, but both were unusually bright, and one
displayed unexpected morphology. These
galaxies, designated as follows, have the following redshift
extrapolations.
- GLz10: z ~ 10.4 or inferred look-back
times ~13.269 Gya (supposedly
~0.453 Gyr post-BB).
- GLz12: z ~ 12.3 or inferred look-back times ~13.363
Gya (supposedly ~0.359 Gyr post-BB).
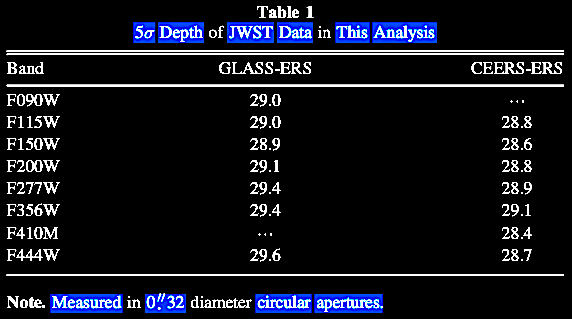
Note the faint magnitudes captured at the 5σ
depth with JWST across the wavelength bands in this
Table 1.
|
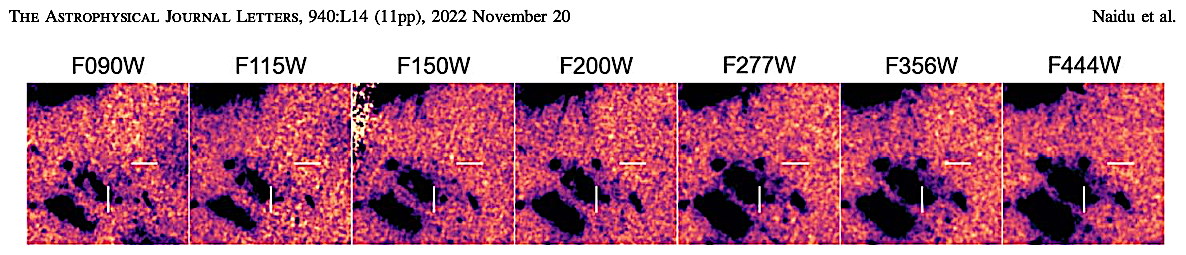
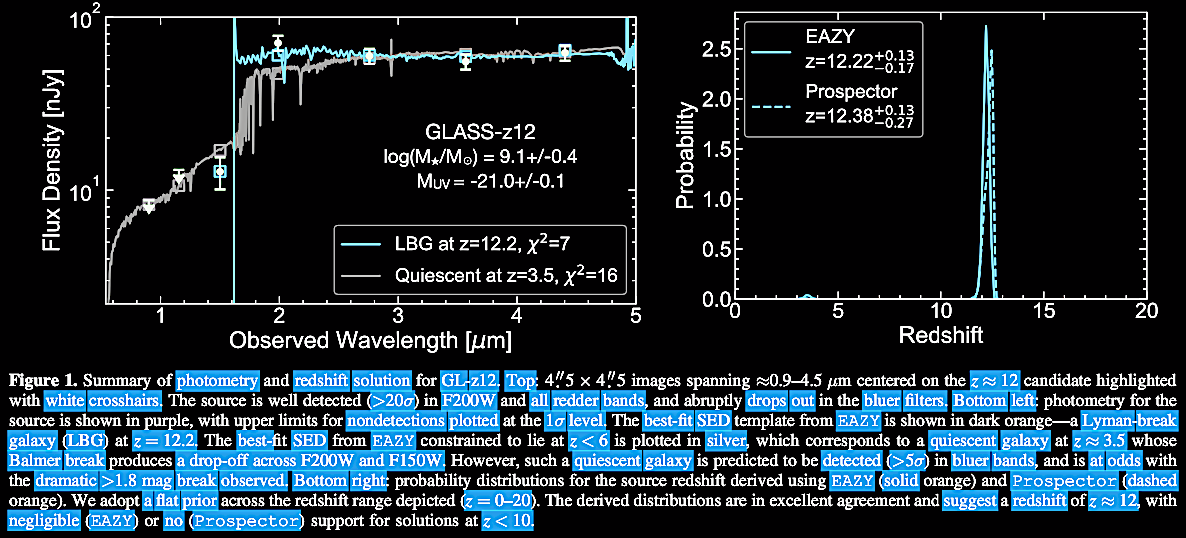
The top part of Figure 1 remained uninverted and the
bottom part was inverted, both for clarity.
|
Comments:
- In Figure 1 (across
above right), note that (as discussed with the data
of Yan et al. 2002, and other papers cited
in this chapter), the high redshift galaxy, GLASS-z12
at z = 12.2, is closely associated with a
'quiescent' lower redshift galaxy at z =
3.5. These two galaxies, one high-z and one
lower-z occur in the same angular location in
the sky, and have had their respective redshifts
statistically confirmed.
- In Figure 2 (across),
also note that like GLASS-z12, high redshift
galaxy, GLASS-z10 at z
~ 10.39 (avg of z-values according to the
EAZY and Prospector analyses), is likewise closely
associated with a 'quiescent' lower redshift galaxy
at z = 2.5; also with respective redshifts
statistically confirmed.
There are comparable, proportional spreads
in z-units, respectively
between the high z galaxies and the low z
galaxies.
Galaxies
|
GLASS-z12 |
GLASS-z10 |
| High z |
12.2 |
~10.39 |
| Low z |
3.5 |
2.5 |
Ratio
(zL / zH) |
(3.5 / 12.2) ~0.287 |
(2.5 / ~10.39) ~0.241 |
A footnote question: Is this
proportionality, (or similar ones in other
'deep field' high z / low z
distributions), possibly significant?
|
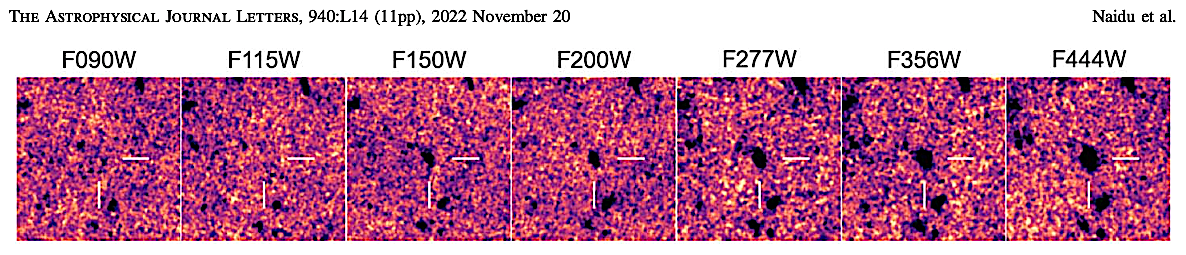
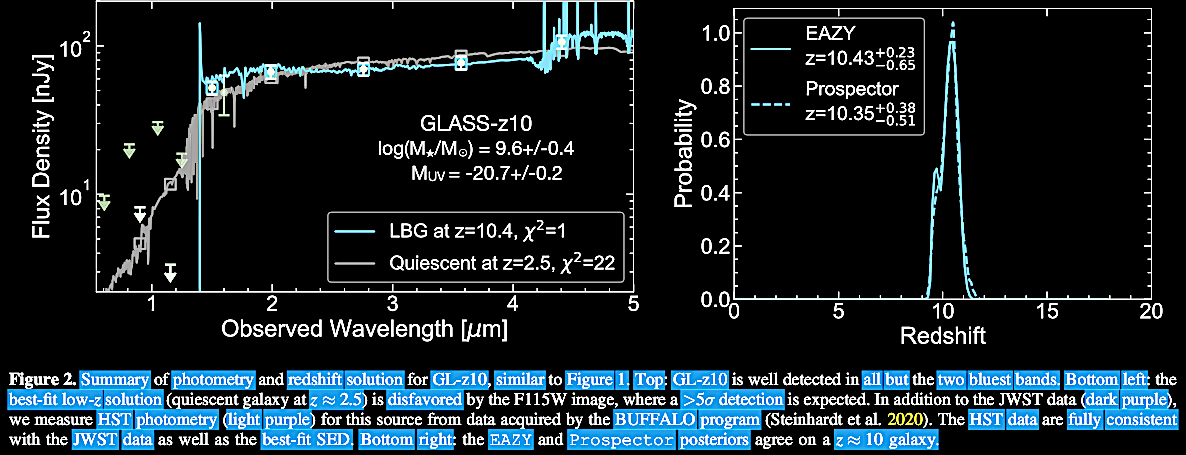
The top part of Figure 2
remained uninverted and the bottom part was inverted,
both for clarity.
|
|
|
In
Figure 4, note the disk-like morphology of one of these
high-z galaxies!
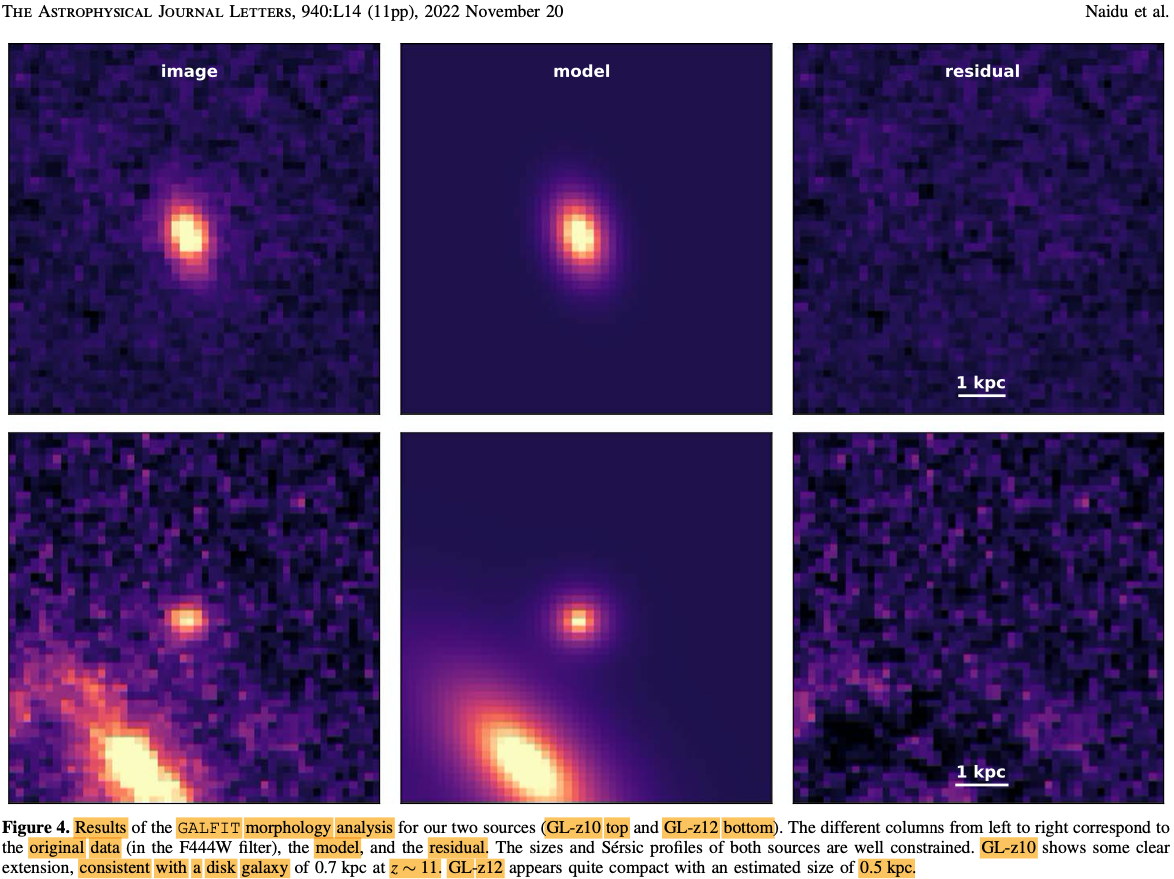
On the bottom panel, the
angularly-larger galaxy below, assaying its z-value
would be of interest.
|
|
Figure
6{a} Top
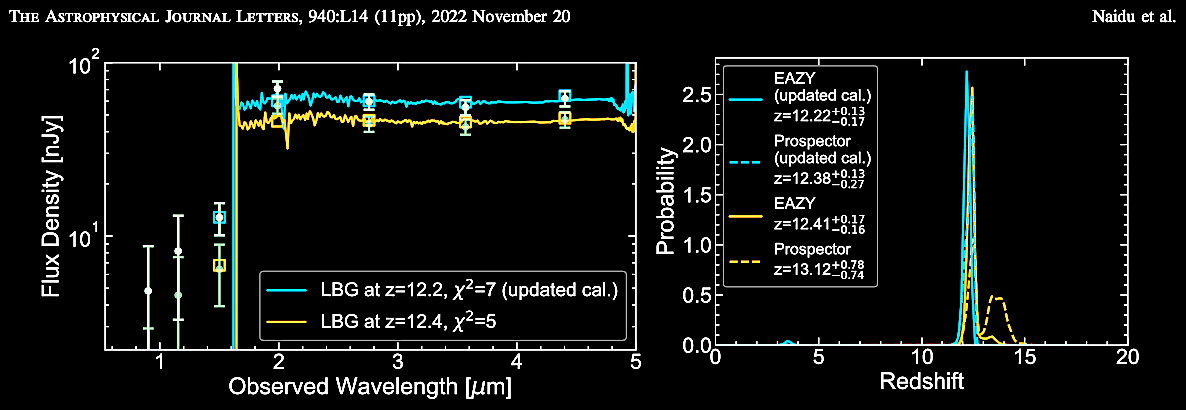
Figure 6{a}

|
Figure
6{b} Bottom
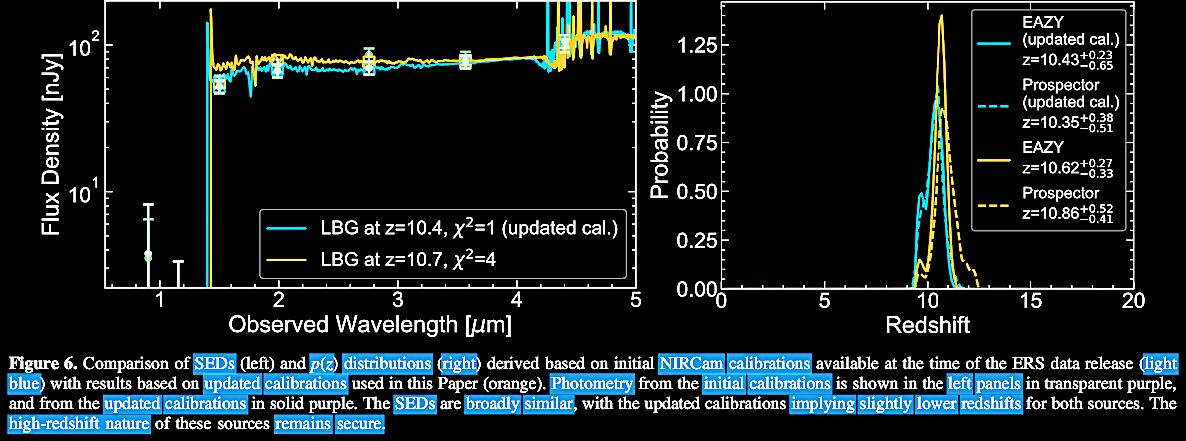
Figure 6{b}
|
Both of these galaxies
displayed unusual brightness, with look-back times >13.2 Gya
(supposedly <0.5 Gyr post-BB), and yet they are massive, and
one of them at z > 10 has the morphology of a disk,
possibly spiral, galaxy (see Fig. 4 above). And they both, in
angular sky location, are associated with lower redshift
galaxies, both with comparable, proportional spreads in z-units.
Another paper more generally about galaxies with high redshifts
also dropped on 19 July 2022 (https://arxiv.org/abs/2207.09436),
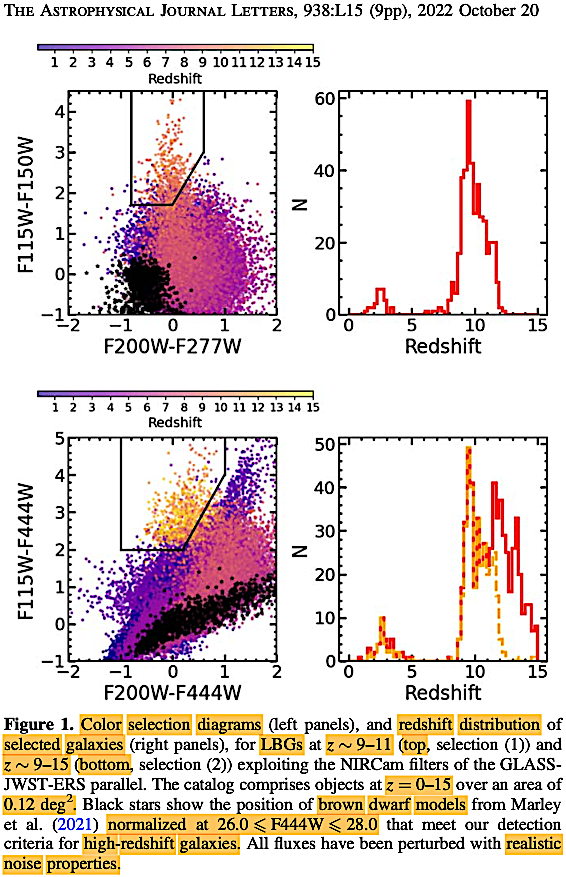
Castellano et al. 2022. Early results from GLASS-JWST.
III. galaxy candidates at z∼9-15. ApJ 938, L15.
https://doi.org/10.3847/2041-8213/ac94d0.
Table 1 shows candidate, color-selected galaxies with redshift
values varying from z ~ 9.04 or
13.174 Gya (supposedly ~
0.547 Gyr post-BB) to z ~ 12.30 or ~12.363 Gya
(supposedly ~0.359 Gyr post-BB).
Castellano et
al. (2022) Figure 1 shows the detection of a selection
of high redshift galaxies in different color channels,
including large bright galaxies (LBGs) in the z ~ 9-11
range, with look-back times ranging from 13.170 Gya (supposedly 0.552 Gyr post-BB) to 13.303 Gya (supposedly 0.419 Gyr post-BB) and also in the z
~ 9-15 range, again with look-back times from 13.170 Gya
(supposedly 0.552 Gyr
post-BB) to 13.450 Gya (supposedly 0.272 Gyr
post-BB). m
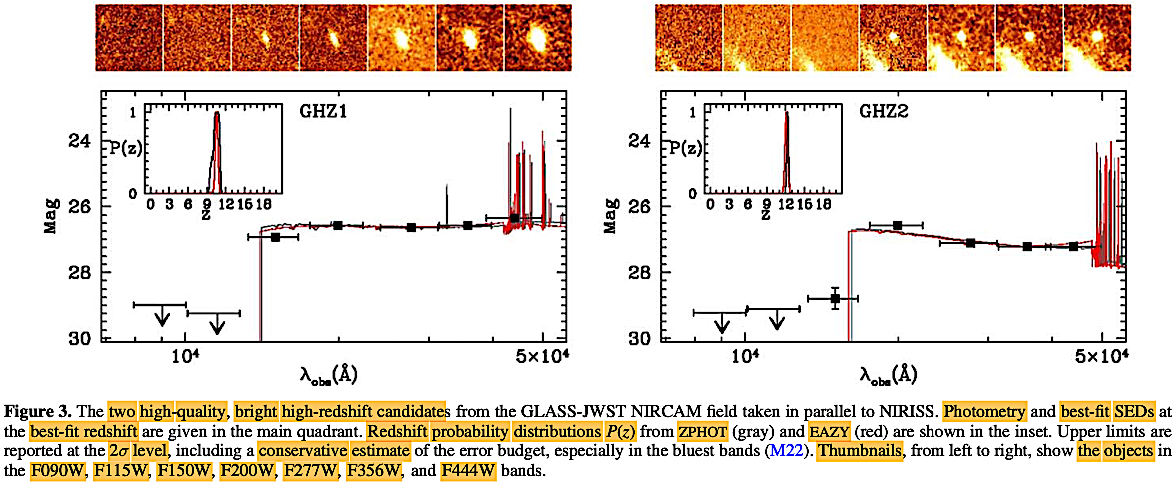
 Below, two very bright and high quality
redshift galaxies (LGBs), GHZ1 and GHZ2.
Below, two very bright and high quality
redshift galaxies (LGBs), GHZ1 and GHZ2.
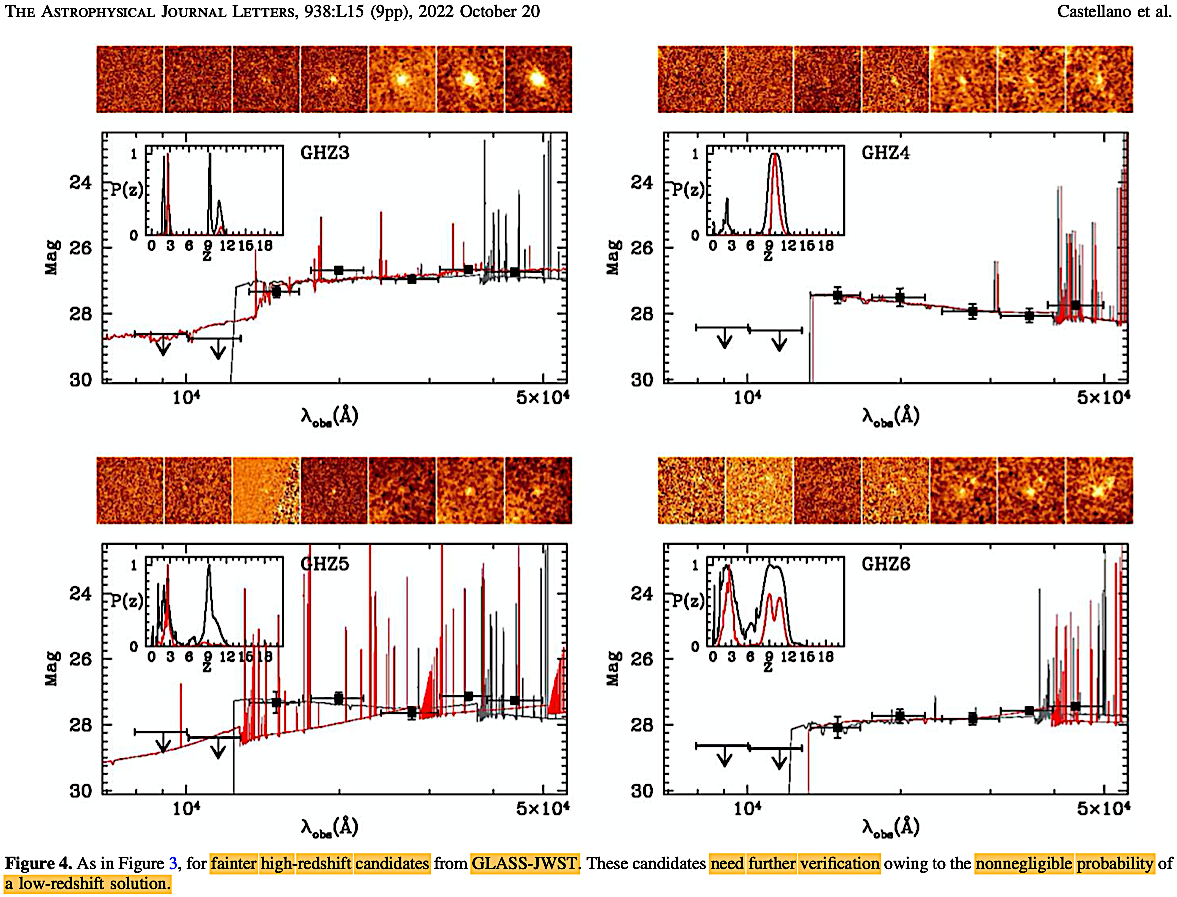
 Below, fainter high redshift galaxy candidates,
3 of them equivocal with a non-negligible probability of being
lower redshift (GHZ3, GHZ5, GHZ6), while GHZ4 has a high
probability of being a high redshift galaxy, but in the fainter
magnitude range,
Below, fainter high redshift galaxy candidates,
3 of them equivocal with a non-negligible probability of being
lower redshift (GHZ3, GHZ5, GHZ6), while GHZ4 has a high
probability of being a high redshift galaxy, but in the fainter
magnitude range,
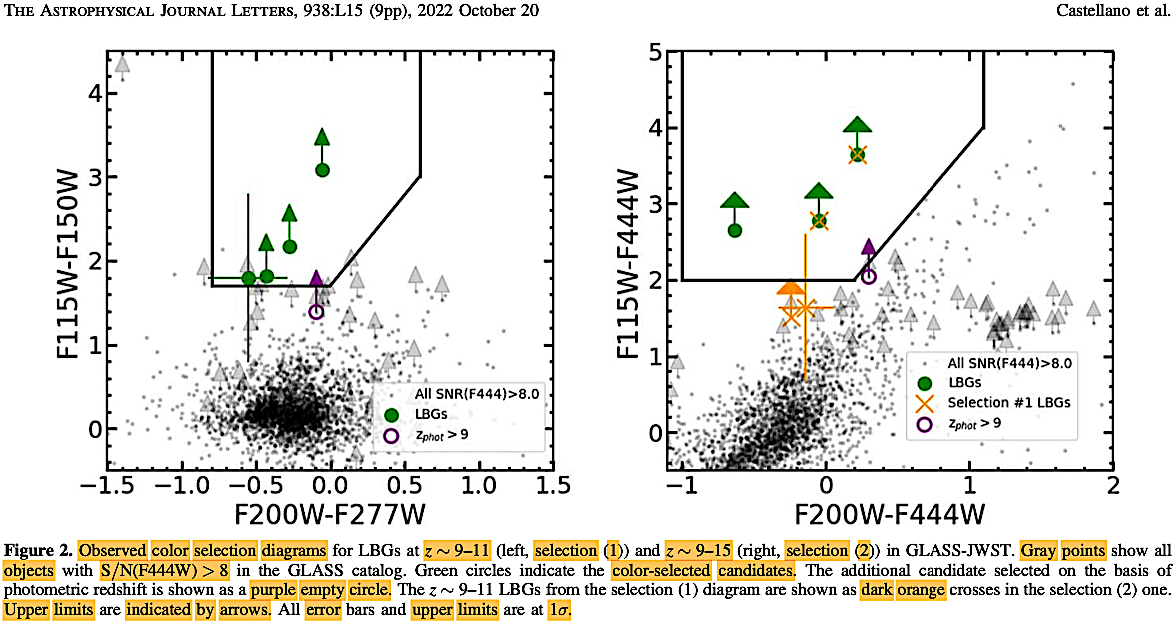
Castellano et al. (2022) pointed out that JWST's power
to find high-z galaxies is unquestioned within certain
uncertainties. This paper in the single GLASS field found a
number of z ~ 9-15 galaxies from the 7-color band, mag
~29 (5σ) NIRCam imaging, making the NIRCam images the first
multi-color band selection of Lyman-break galaxies in this
redshift range 'using two independent color-color diagrams.' The
authors point out that they have two unambiguous high redshift
bright galaxy candidates (Fig. 3), which are GHZ1 at z =
10.6 equivalent in look-back time to 13.281 Gya (supposedly 0.441 Gyr post-BB) and
GHZ2 at z ~/= 12.2
Early Results from GLASS-JWST. III. Galaxy Candidates at
z ∼9�15
equivalent in look-back time to 13.359 Gya (supposedly 0.363 Gyr post-BB). They
urge that the other more ambiguous high redshift galaxies should
be tested further in JWST Cycle-2.
And now we can start getting a census of how many galaxies there
are at such high redshifts. Again in a putative eternal
Universe, the only limit is our instrumentation, in this case,
our best thus far, the JWST.
The final and most significant paper to drop that Tuesday (https://arxiv.org/abs/2207.09428)
was Ferriera et al. 2022. Panic! at the disks: First
rest-frame optical observations of galaxy structure at z > 3
with JWST in the SMACS 0723 field. ApJ 938, L2.
https://doi.org/10.3847/2041-8213/ac947c.
Although some cultural icons, 'guardians of the galaxy's
orthodoxy tried to make a big serious face fuss that critics had
not explicitly stated that "Panic! at the disks" was a cultural
reference to the popular music group, Panic! At the Disco, they
in fact showed their own lack of humor at the implications of
the findings in this early JWST paper.
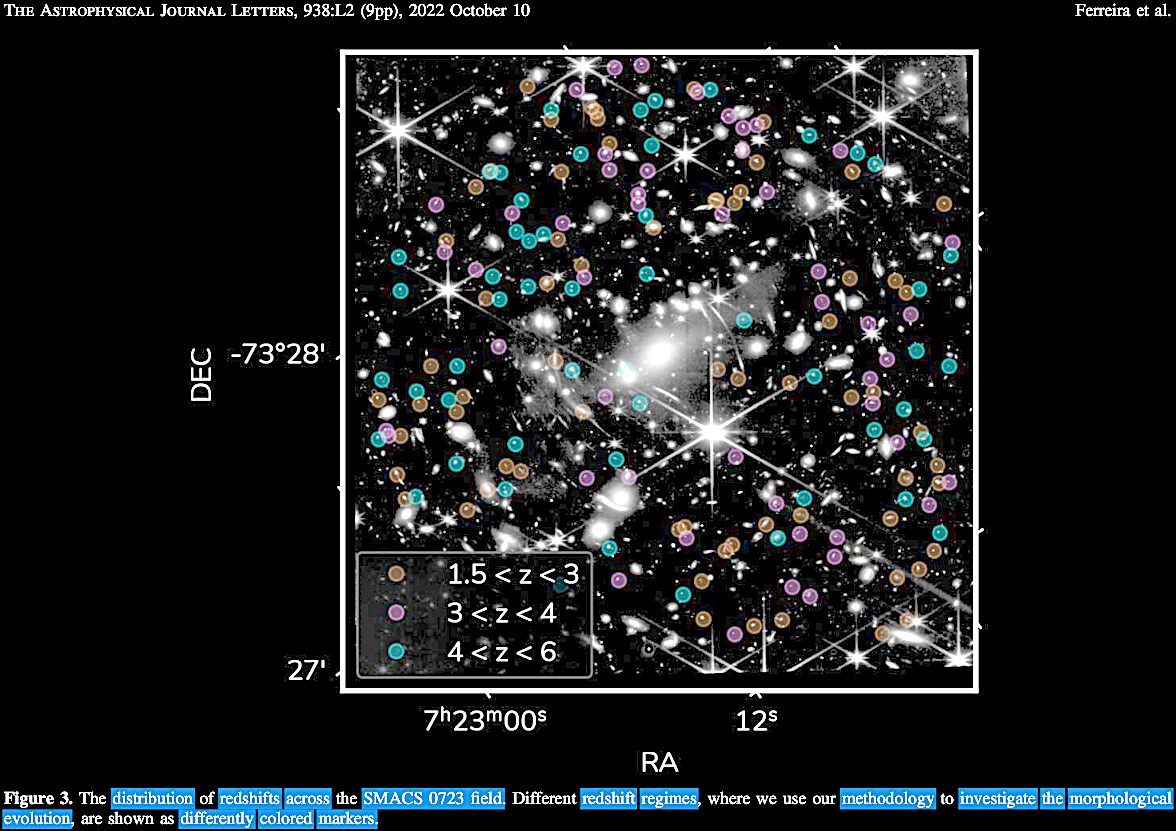
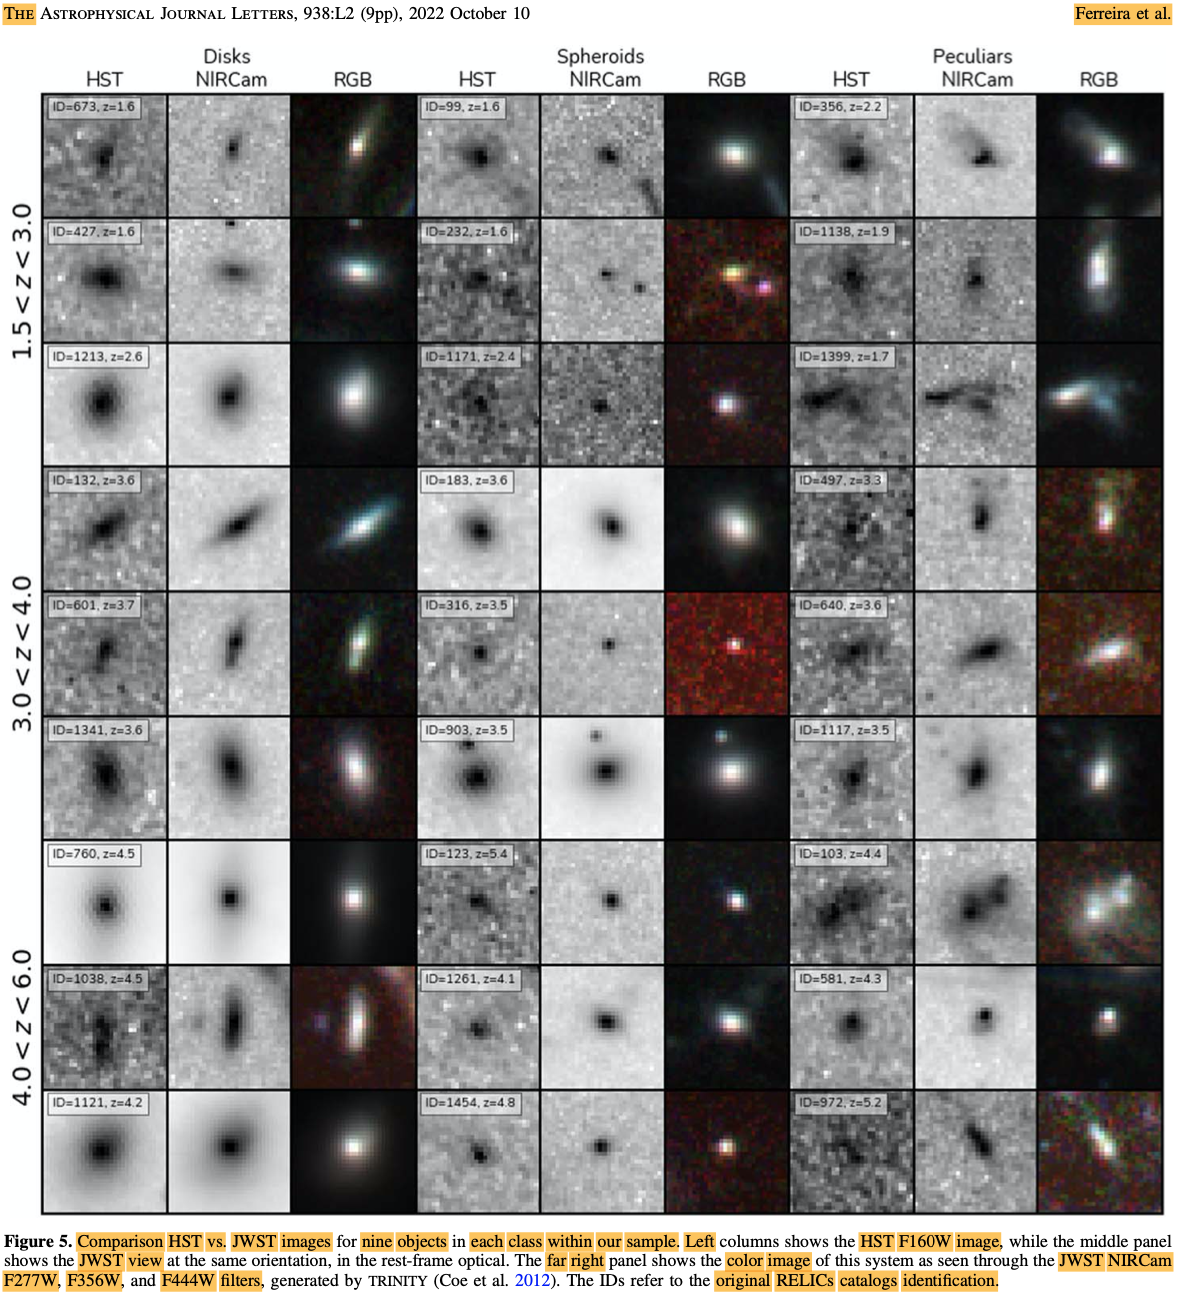
These
galaxies (in Fig. 3) appear 2-3 times smaller than expected
from HST observations, again indicating that there is not
the expansion effect magnification predicted by the Big
Bang.
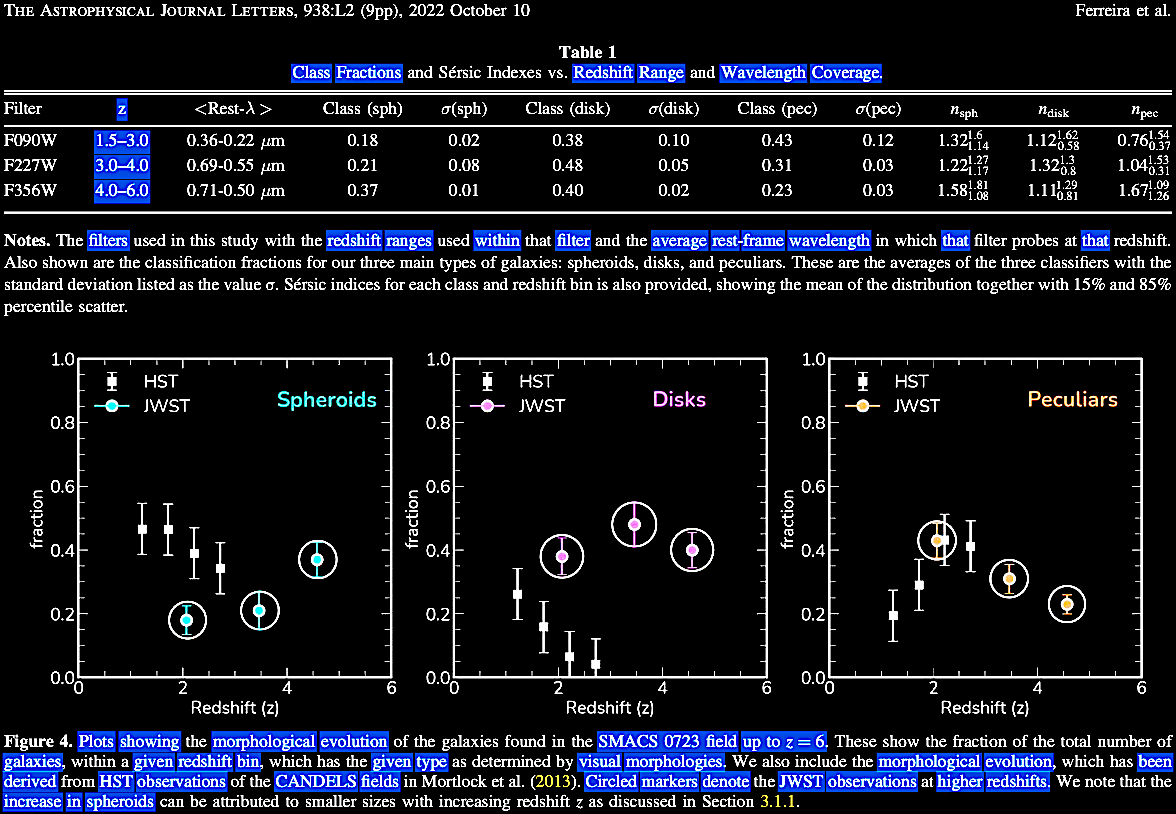
Ferreira et al. (2022) unraveled
some of, or shall we say, a few of the implications of
their early findings, involving examining the morphology
of galaxies in the 1.5 < z < 3 range or
9.405 Gya (supposedly
4.317 Gyr post-BB) < z <
11.550 Gya (supposedly
2.172 Gyr post-BB), where HST neither had the depth nor
resolution to correctly decipher galaxy morphology. They
classified 280 galaxies as spheroid, disk, and peculiar /
irregular in the 1.5 < z < 8 range or up to
13.076 Gya (supposedly
0.646 Gyr post-BB), at rest-frame optical wavelengths for
JWST. Then they ran quantitative parametric and
nonparametric morphology tests on these selected galaxies.
Their findings:
- i) Within the HBBC paradigm, they
concluded that galaxy morpho-types evolve more slowly
than previously believed (on BB terms), based on the
limitations of HST imaging and resolution, i.e., these
preliminary JWST results suggest formation of 'normal
galaxy structure much earlier than previously
thought.'
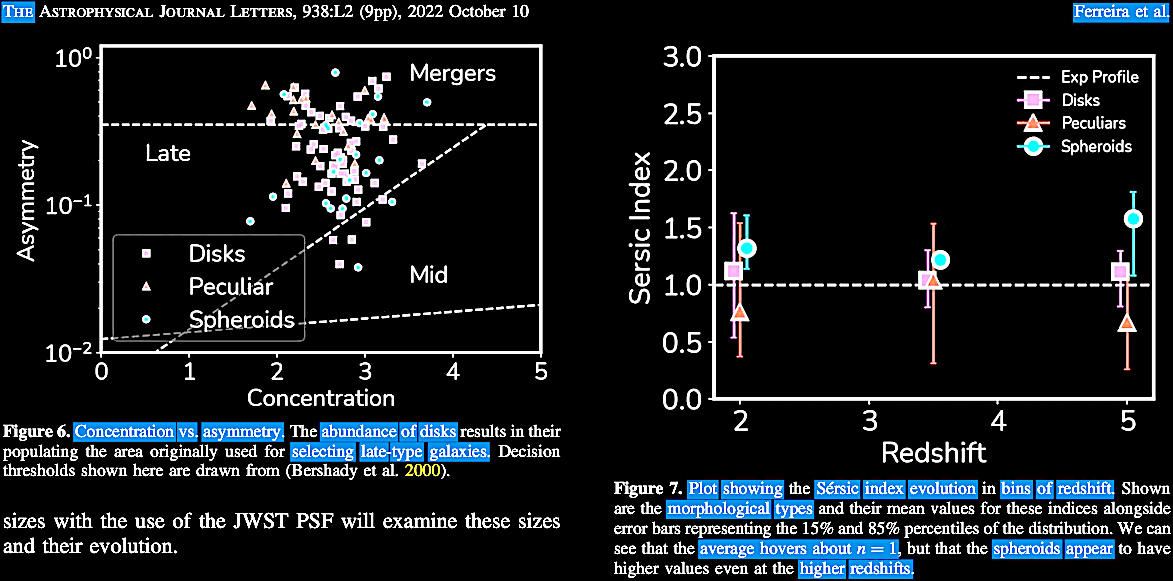
- ii) They discovered that disk galaxies
are common at the z ~ 3-6 range, making up
~50% of the galaxy cohort (subject to JWST depth and
resolution limitations), that is, >10x as high as
suggested by observations under the strictures of
HST's capabilities. They point out that this
z-interval is "surprisingly full of disk galaxies,"
i.e., only surprising in HBBC paradigmatic terms,
given their apparent 'irregularities' under the
limitations of the HST. They don't ask whether their
expectations rather than being a prediction of the
paradigm are actually just the depth and resolution
limitations of the telescopes at hand, namely, HST and
now, JWST, which unlike HST can probe the near IR part
of the spectrum.
- iii) Distant galaxies in optical
rest-frame at z > 3, at UV spectral region
which was all that HST could see at those high
redshifts, seemed much more irregular in morphology,
than they actually are when the actual mass and
morphology can be assayed by JWST in the near IR
spectral region.
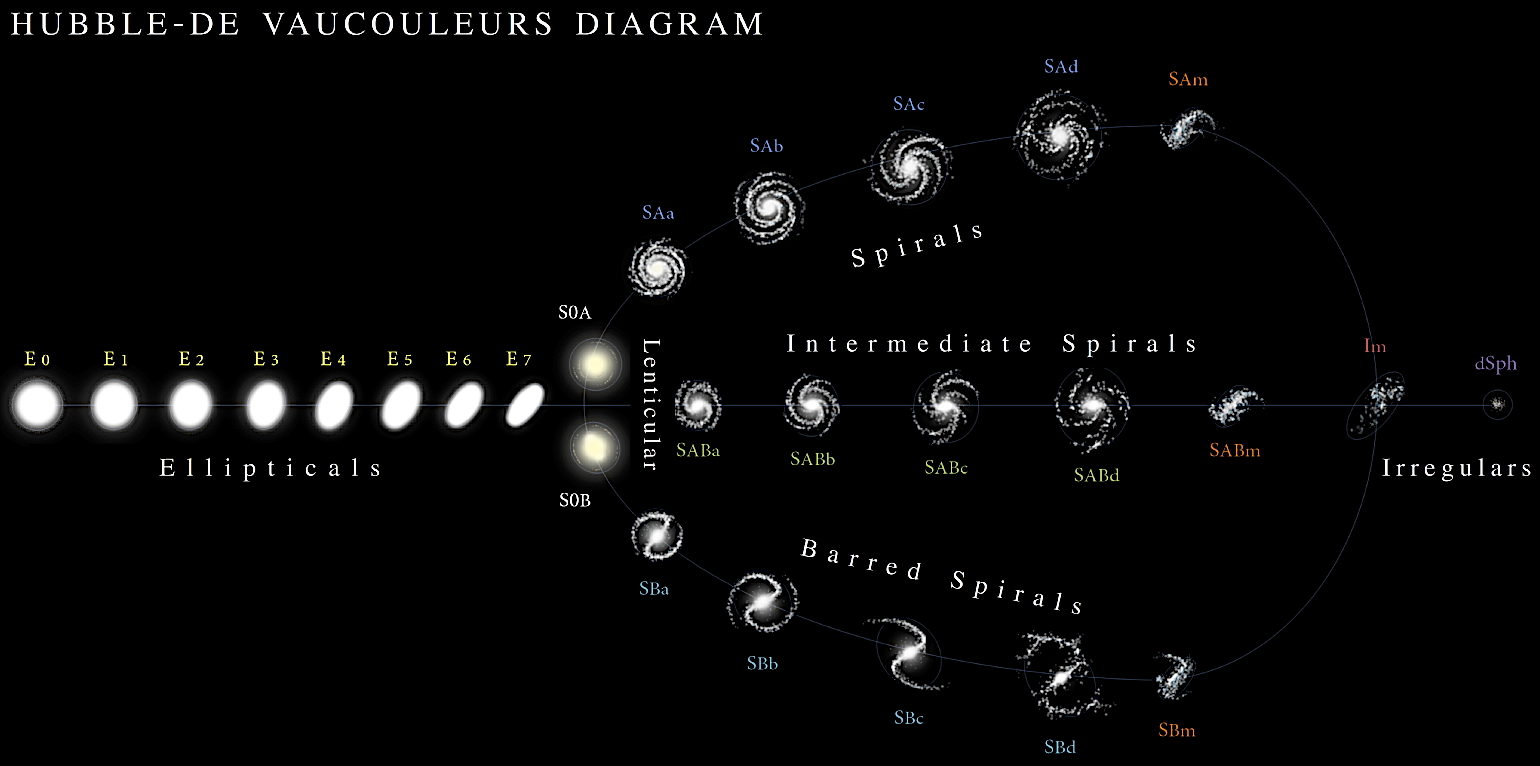
What
became very apparent with the unexpected mass presence of
disk galaxies is that galaxy evolution is expected to take
a long time, just like the Milky Way galaxy has been the
essential barred spiral that it is for ~10 Gy. The
Hubble-de Vaucouleurs morphological classification of
galaxy evolution illustrates, when they were expected to
start very small and grow through mergers and ragged, but
when large, smooth spirals and elliptical galaxies are
present from when they shouldn't be present, they suggest
that the Universe was old then as now with fully mature
and very distant from us galaxies:
 (Wiki Commons link).
Note in prediction. Here's a prediction, the supposed
'evolutionary epochs' in the deep redshift ranges in space
telescope 'deep fields' with supposed differing stages of galaxy
formation, are simply artifacts of the limitations of our
observatories, looking outward, as they may well be, upon an
eternal Universe. Next generation space telescopes will continue
to find enriched cohorts of unexpected mature galaxy
morphologies of all stellar ages as far as the limits of optical
and near IR telescopy can take us.
Of course, when dissident Eric Lerner began to comment on
these findings in August 2022 and before, all hell broke
loose from the august defenders of orthodoxy. (For
discussion from both and from many sides, see videos).
We of course stick with the published papers, which are of
primary importance.
19 July 2022
(Wednesday) released;
revised May 2023: Another paper submitted on
the 19th which got in under the 20th is Adams et al.
2022a. The total rest-frame UV luminosity function from 3
< 𝑧 < 5: A simultaneous
study of AGN and galaxies from -28 < 𝑀UV
< -16. https://arxiv.org/abs/2207.09342v1.
This paper is of especial relevance because of UV luminosity
data and predictions made using data sets
then available by Lerner, E. J., Falomo, R., &
Scarpa, R. 2014. UV surface brightness of galaxies
from the local universe to z ~ 5. International
Journal of Modern Physics D 23 (6). https://doi.org/10.1142/S0218271814500588,
first published on https://arxiv.org/abs/1405.0275.
22 July 2022 (Friday); v2 15 May 2023; published
2023. Adams et al. (2022b; 2023)
released (https://arxiv.org/abs/2207.11217),
Discovery and properties of ultra-high redshift
galaxies (9 < z < 12) in the JWST ERO
SMACS 0723 Field. MNRAS 518 (3),
4755. https://doi.org/10.1093/mnras/stac3347.
In the
Discovery and properties of ultra-high
redshift galaxies 9 < < 12 in the
JWST ERO SMACS 0723 Field
SMACS 0723 field, modelling photometric redshifts,
they were searching for ultra high redshift galaxies
(z > 9) which they hypothesized would be
within the HBBC 'Epoch of Reionization' and they
found 4 previously unidentified galaxies with z
> 9, i.e., look-back times of >13.170 Gya
(supposedly <0.552 Gyr
post-BB) including one galaxy with z = 11.5,
i.e., a look-back time of 13.328 Gya
(supposedly 0.394 Gyr
post-BB), and among them, two possibly paired
galaxies. However, the main purpose of the paper
seems to have been to reign in or domesticate the
redshift measurements of two earlier (than final
version) papers discussed below, Yan et
al. (2022) and
Atek
et al. (2022), which we will discuss in
detail. With model-adjustments, here is Adams et
al. (2022b)'s Table 4, which introduces the
earlier papers' z-measurements and their own
modifications / domestications.
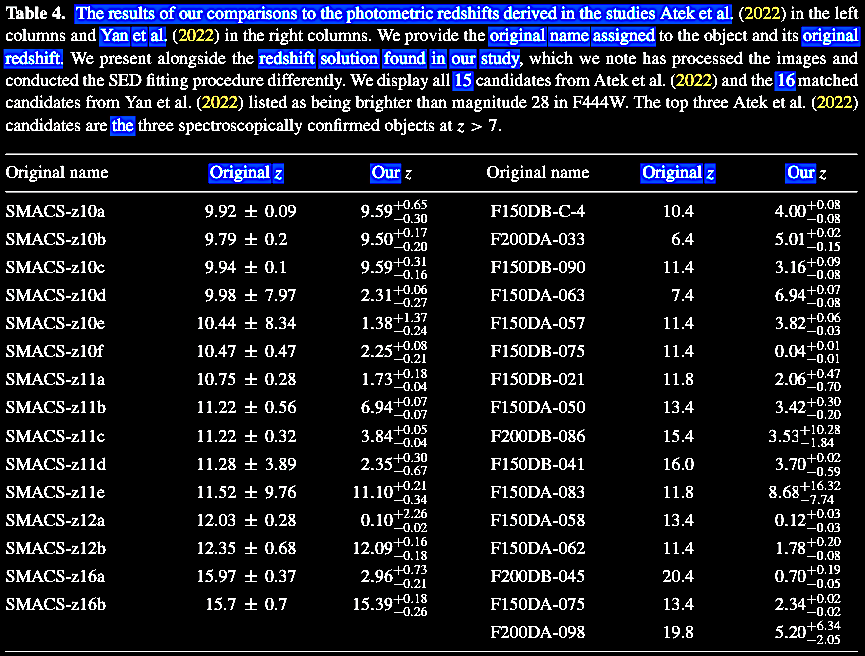 Adams et al. (2022b).
A data display difference between Adams et al.
(2022b) and the earlier Yan et
al. (2022) and
Antek et al. (2022) is
that the both of these cited papers
shared their galactic spectra and
the SED (spectral energy
distributions including the Lyman
and Balmer signatures), whereas
Adams et al. (2022b) did
not. Furthermore, while Adams et al. (2022b) was
publicly
downloadable
through the MNRAS
site (link), Antek et al. (2022) was
not. Yan et al. (2022) was
released on
Iopscience.
23 July
2022
(Saturday) released;
v2 24 November
2022. Yan
et al.
(2022)
released a
preprint v1
and v2 (https://arxiv.org/abs/2207.11558),
First batch of
z ≈
11-20
candidate
objects
revealed by
the James Webb
Space
Telescope
Early Release
Observations
[ERO] on SMACS
0723-73. ApJL
942
(1), L9. https://doi.org/10.3847/2041-8213/aca80c.
This beautiful
paper shares
its data,
6-band JWST
observed
wavelengths
coded, the
redshifts, the
SEDs (spectral
energy
distributions),
and the
images, for a
feast of data.
Candidly, they
write, "The
large number
of such
candidate
objects at
such high
redshifts is
not expected
from the
previously
favored
predictions
and demands
further
investigations.
JWST
spectroscopy
on such
objects will
be critical,"
(Emphasis
added). By the
Wright (2006)
online
calculator, we
have many very
high redshift
galaxies,
ranging
- z ~ 11 or inferred look-back times ~13.303
Gya (supposedly ~0.419
Gyr post-BB).
- z ~ 20 or inferred look-back
times ~13.541 Gya (supposedly ~0.181 Gyr post-BB).
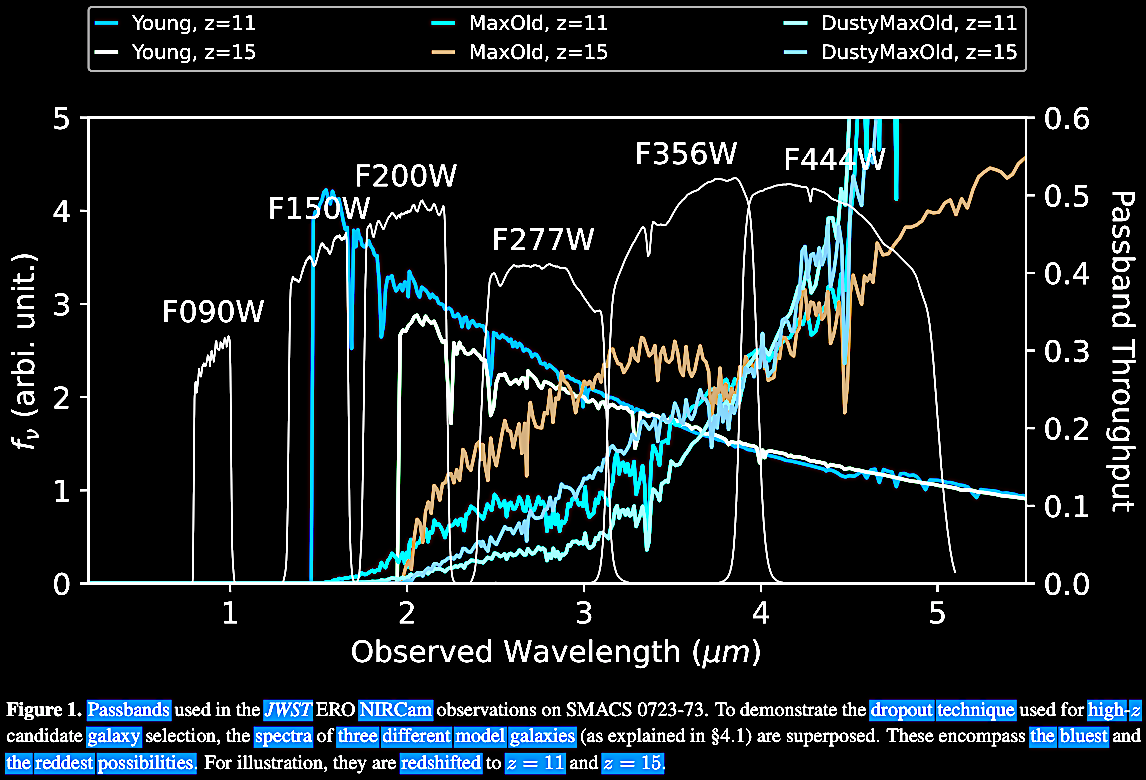
On to the data in detail: For
young, maximum
old, and
maximum old
dusty
galaxies, the
authors show
the expected
spectra across
the wavelength
bands
available to
the JWST's
instruments:
 The additional figures of Yan et al.
(2022), Appendix I.
The additional figures of Yan et al.
(2022), Appendix I.
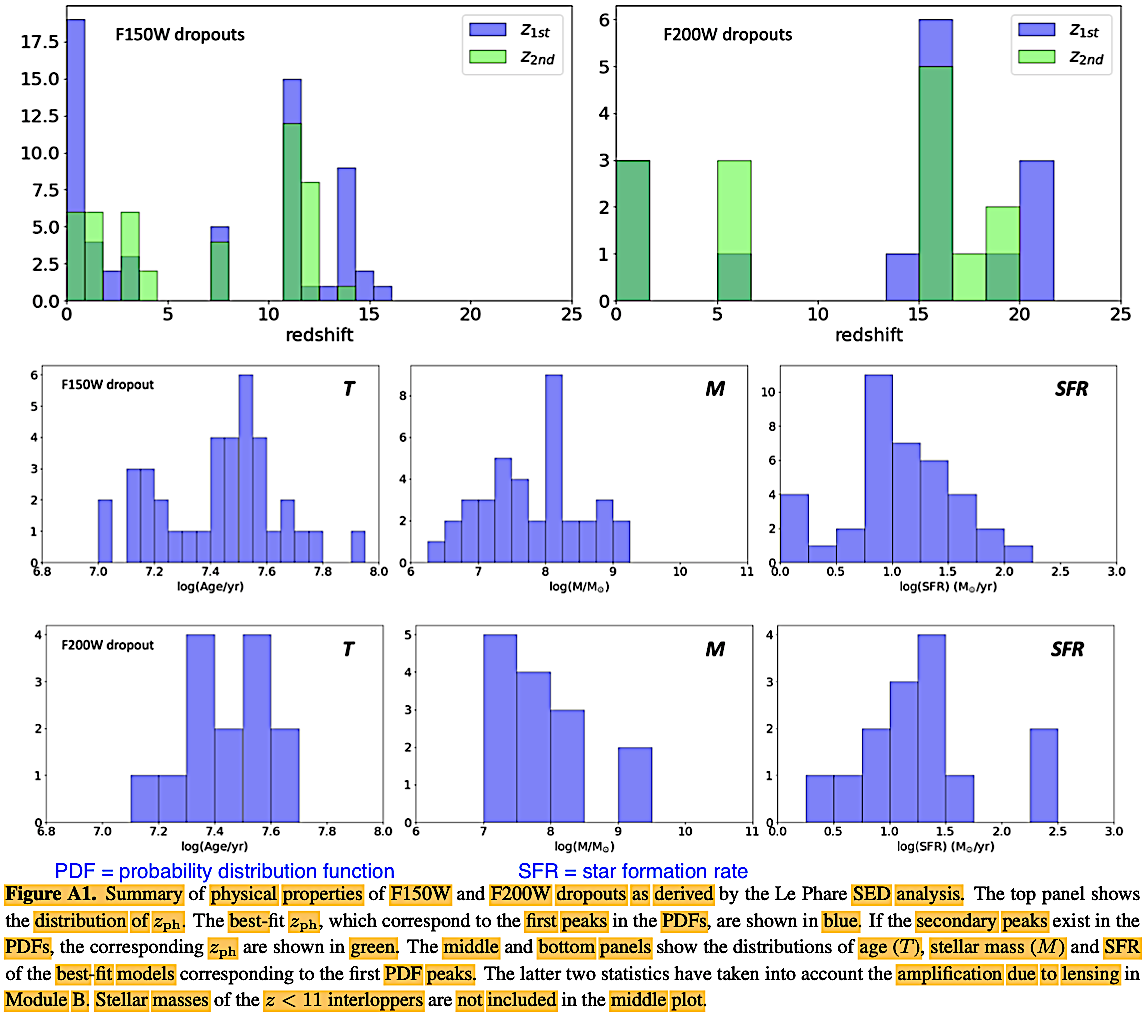
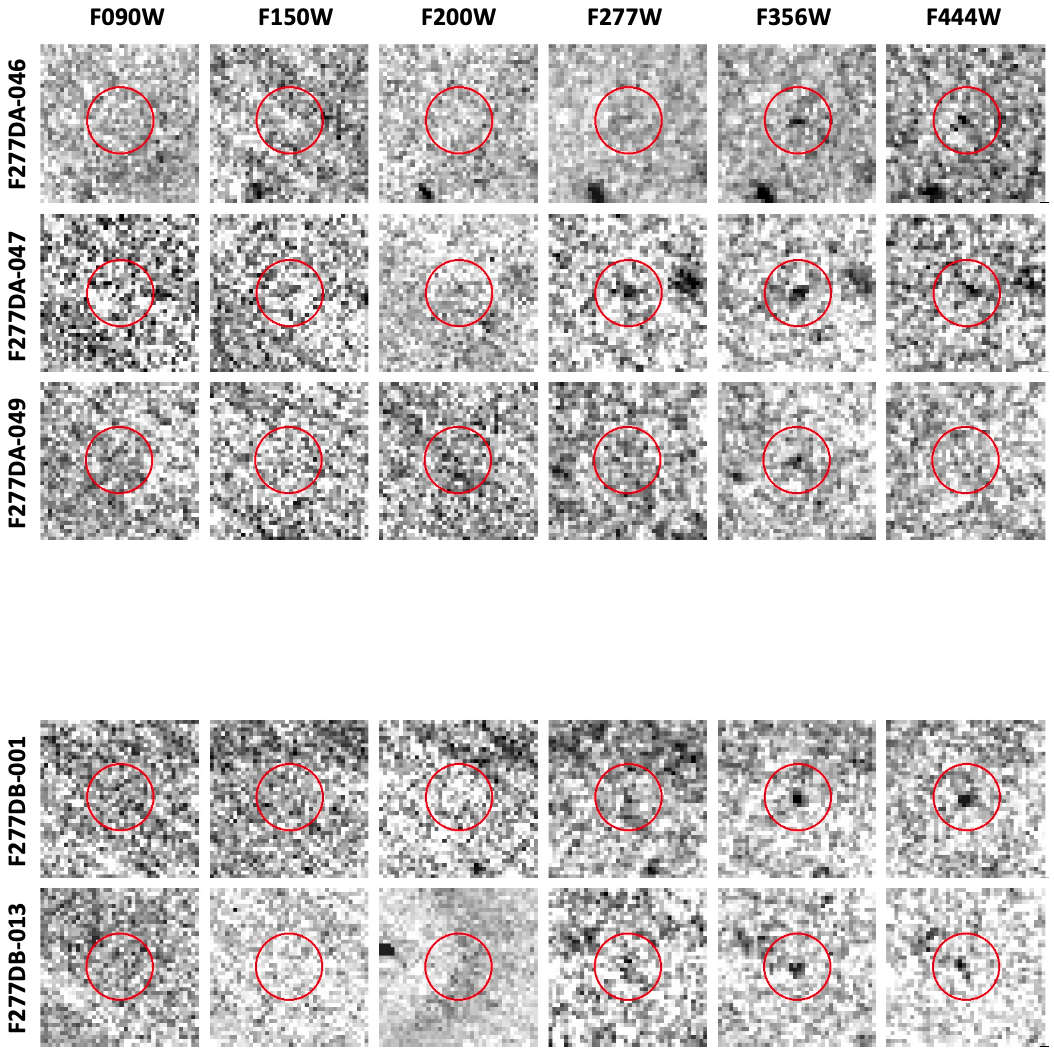
 Fig B1-a. 6-bands of NIRCam
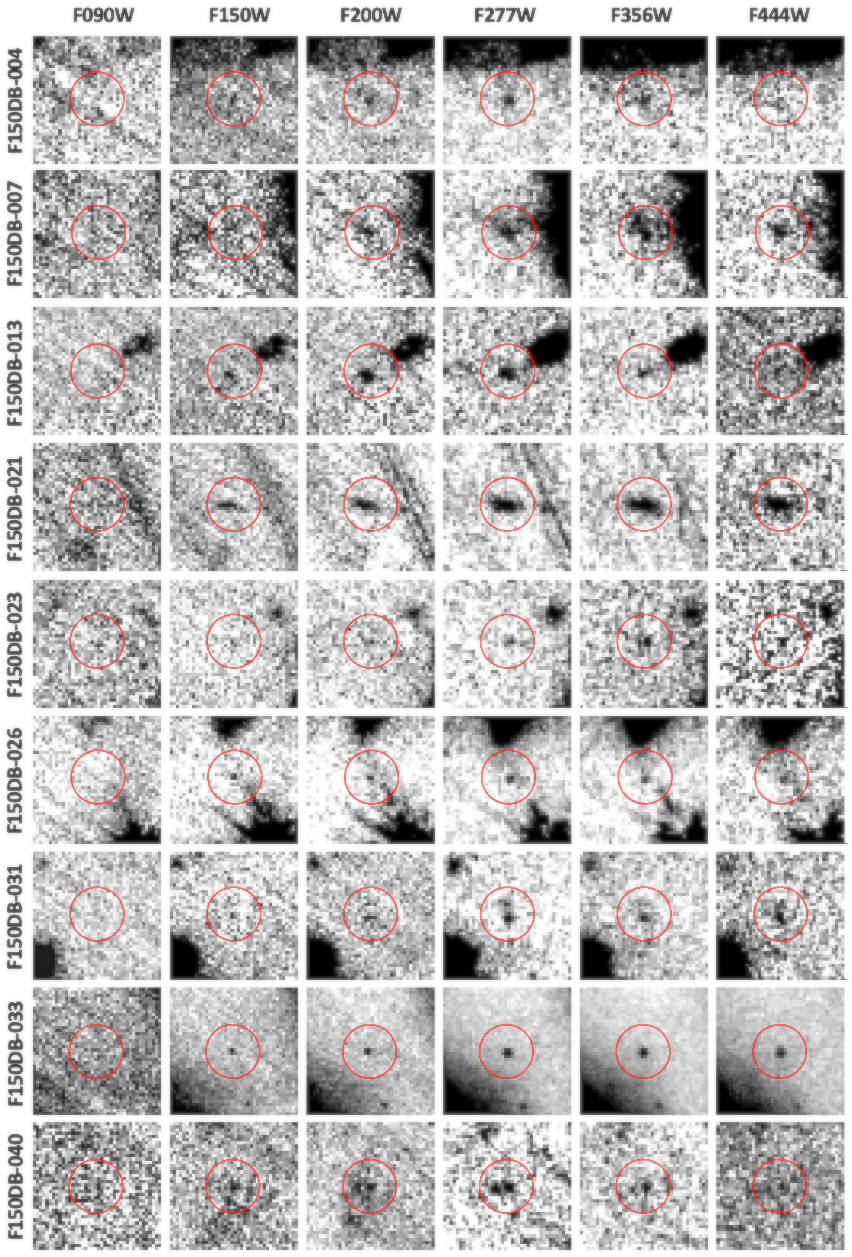
Figure B1-b 6-band
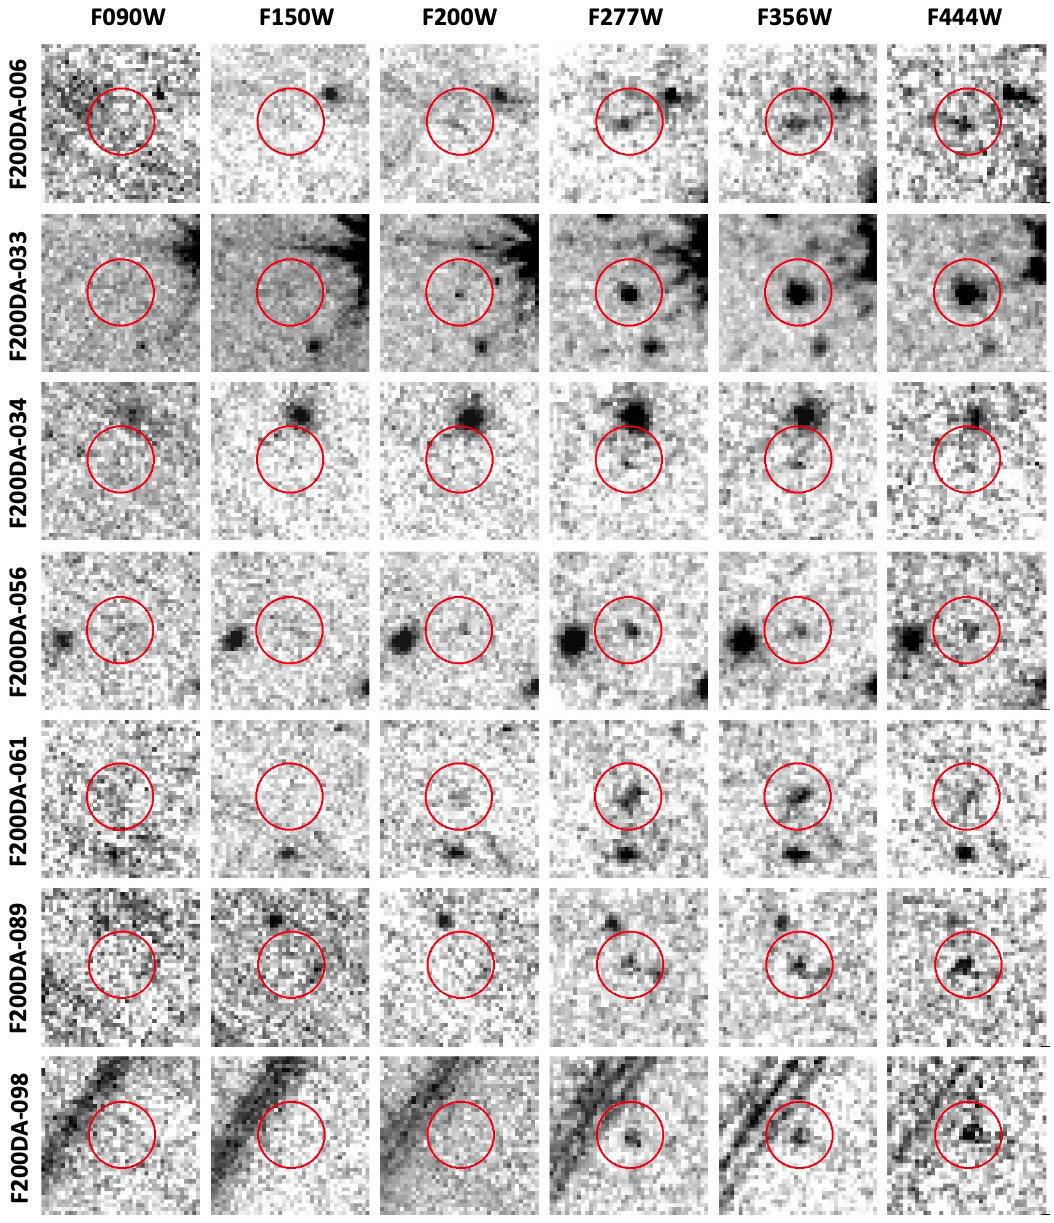
Fig. B1-c 6-band
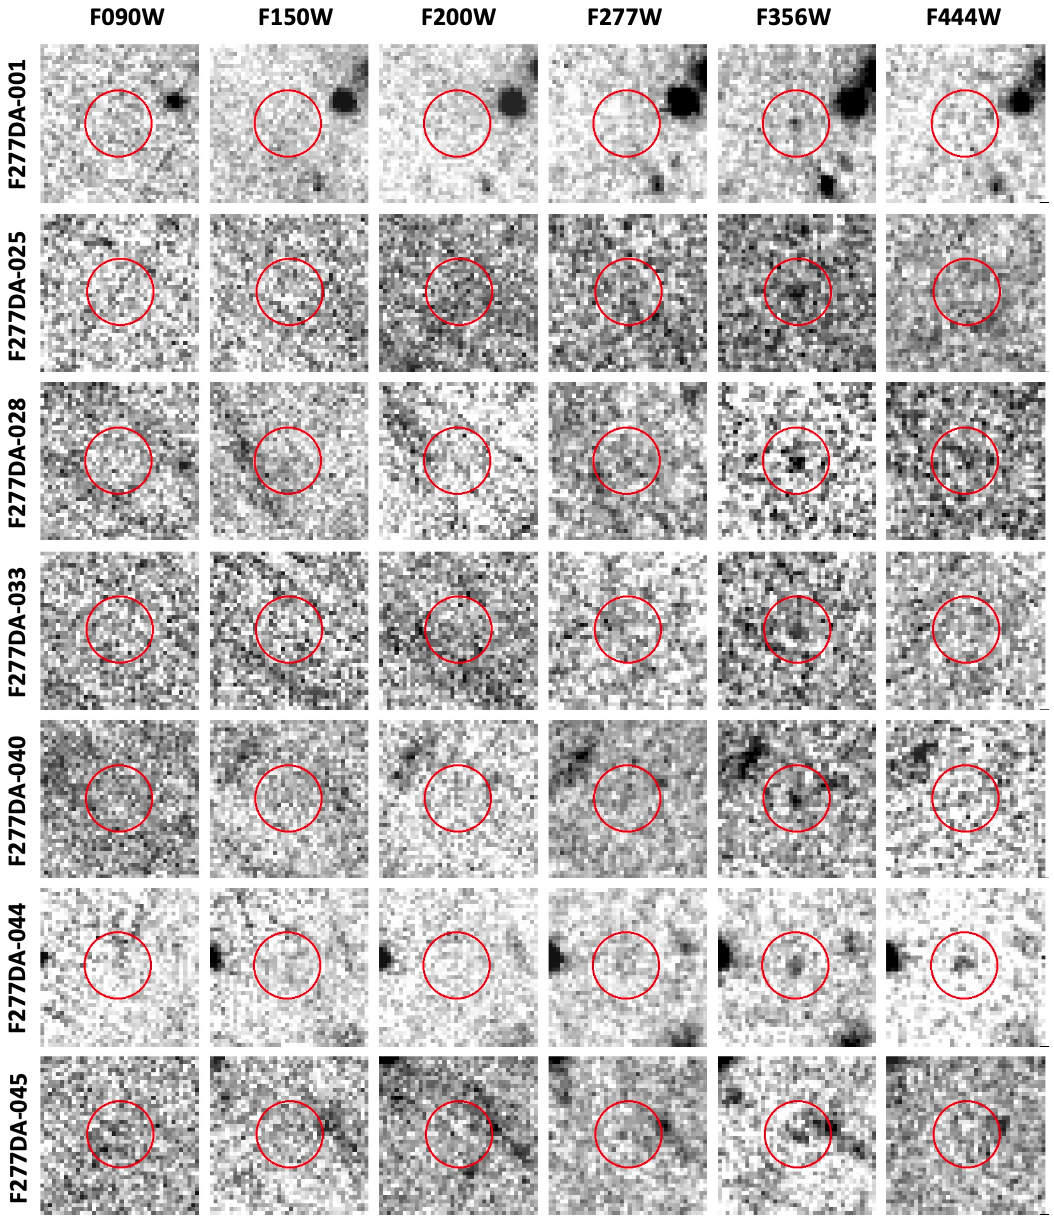
Fig. B1-d (cont.) 6-band
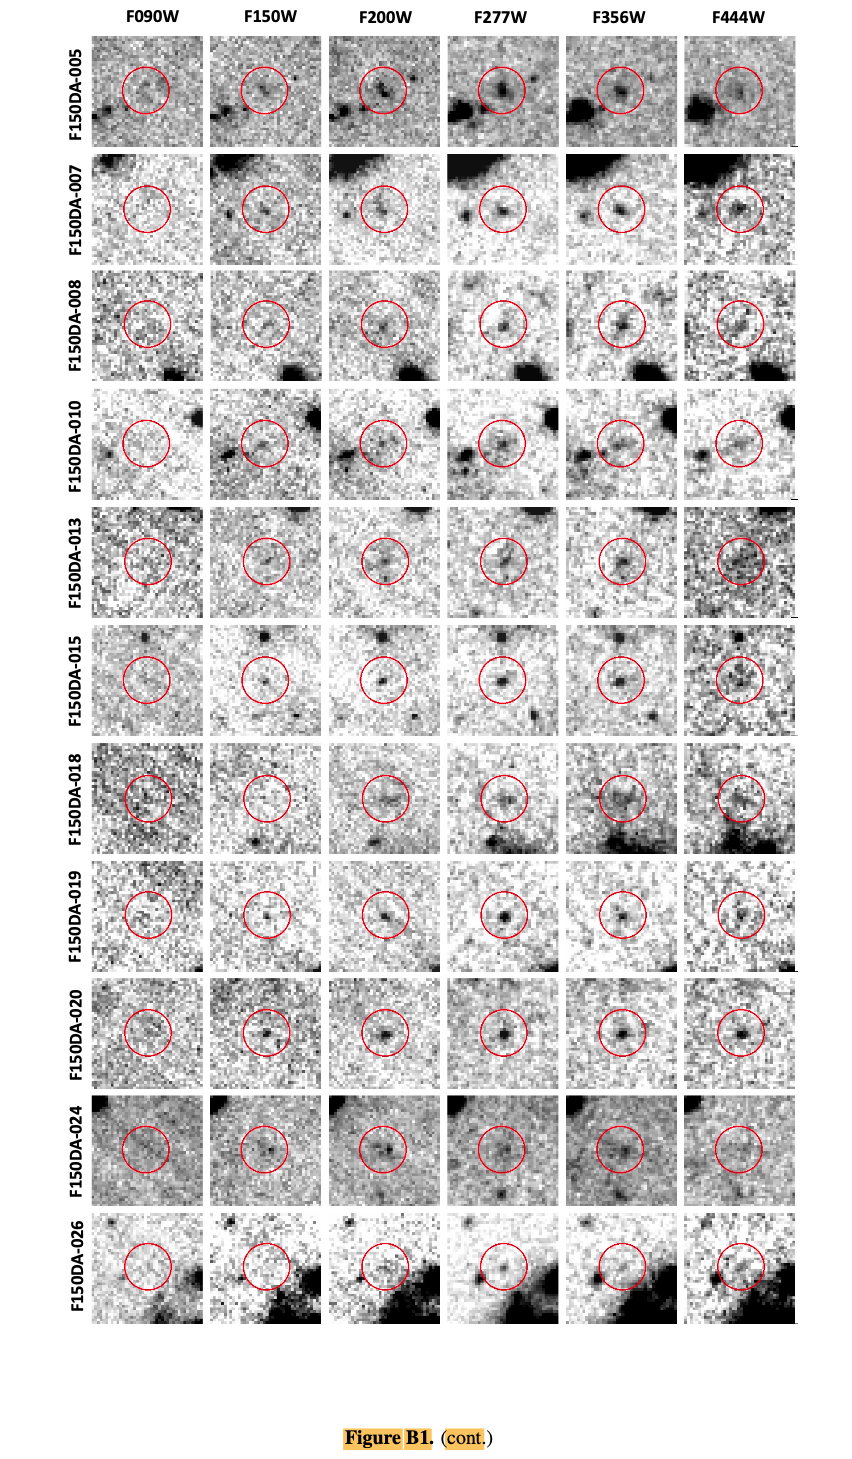
Fig. B1-e. 6-band
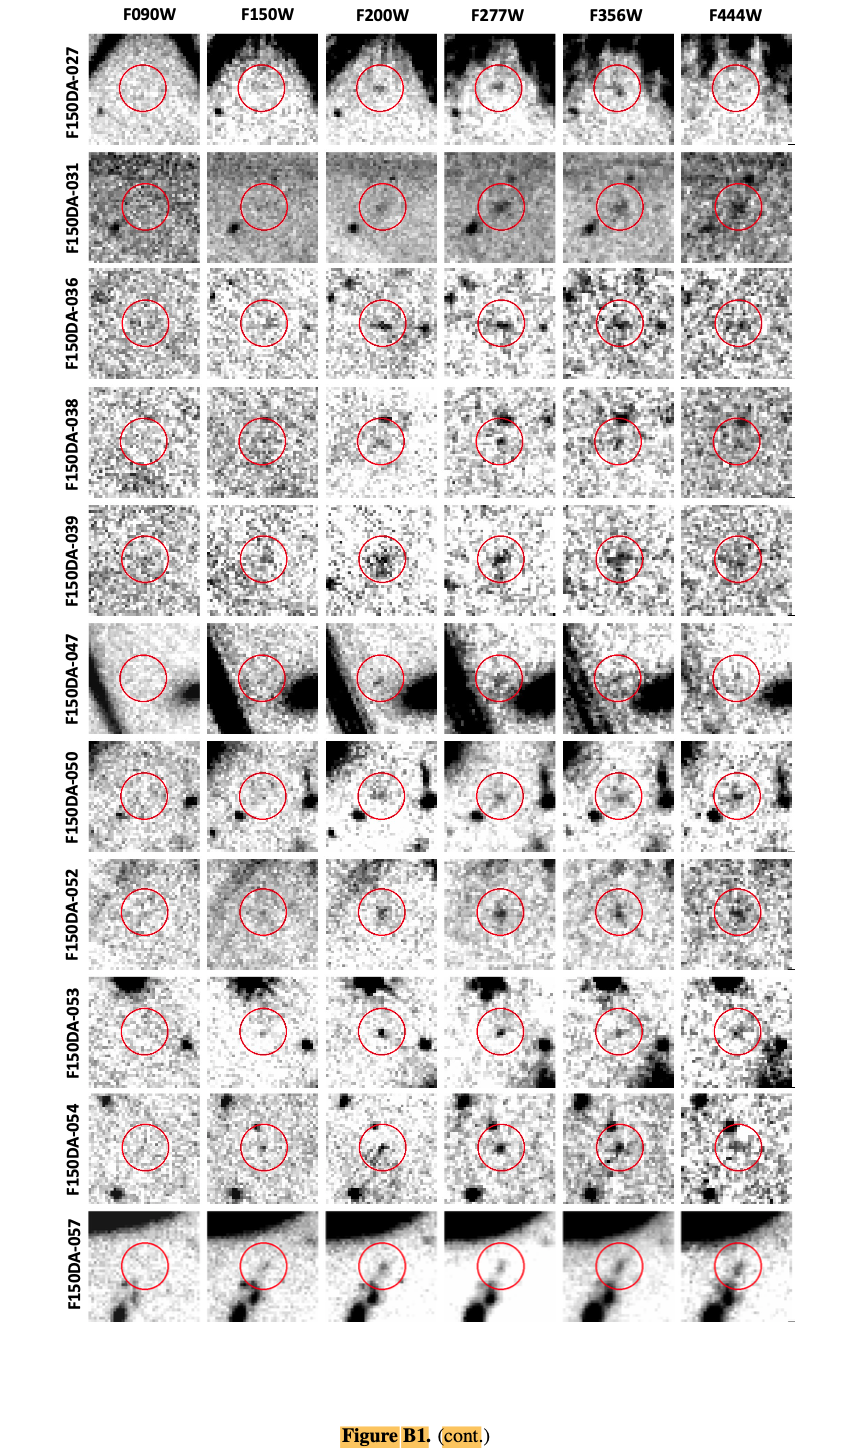
Fig. B1-f. 6-band
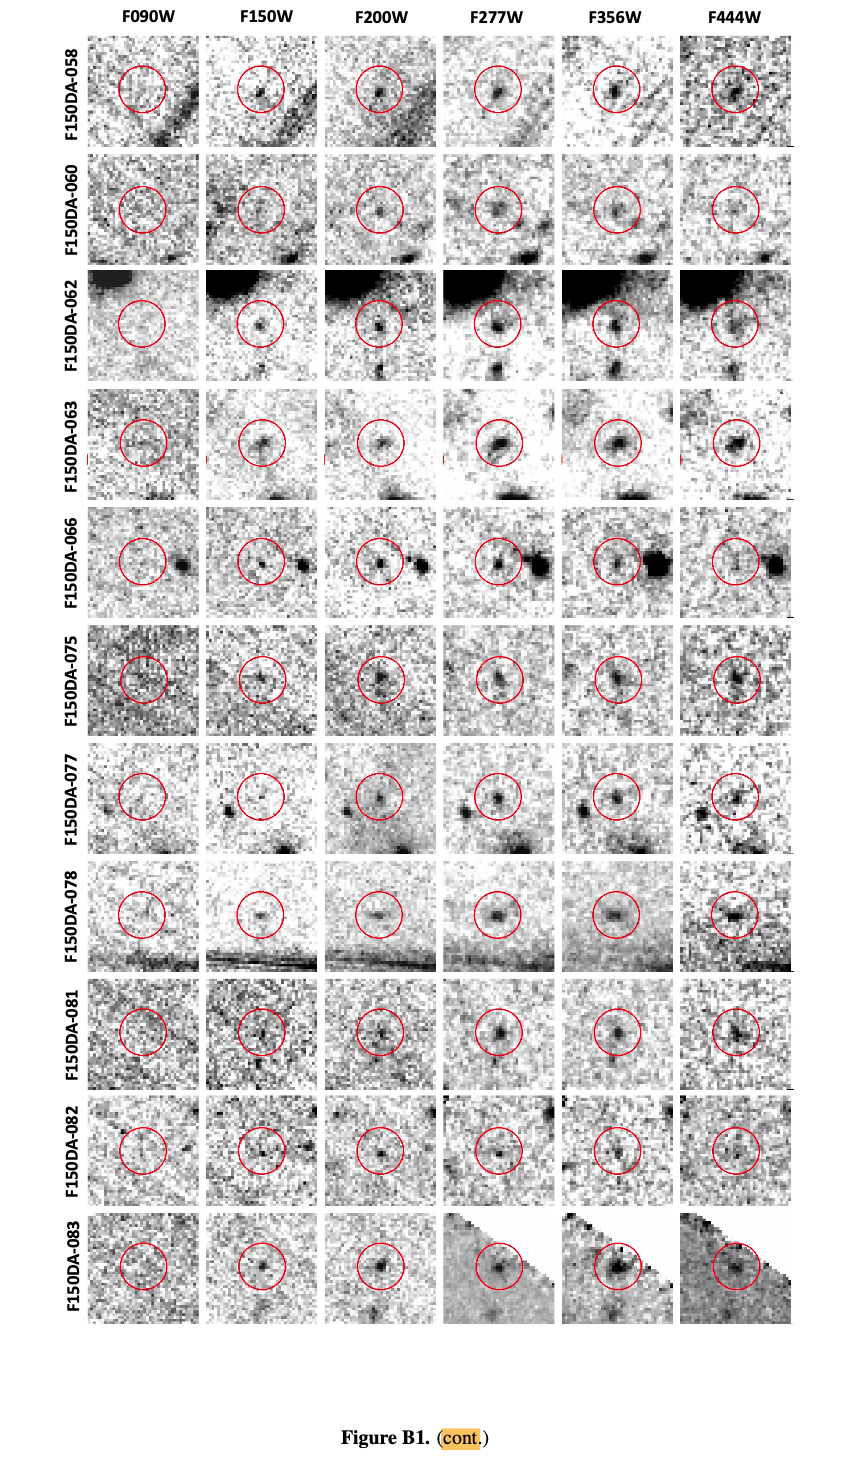
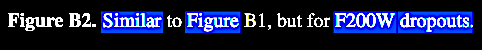
Fig. B2-a. 6-band.
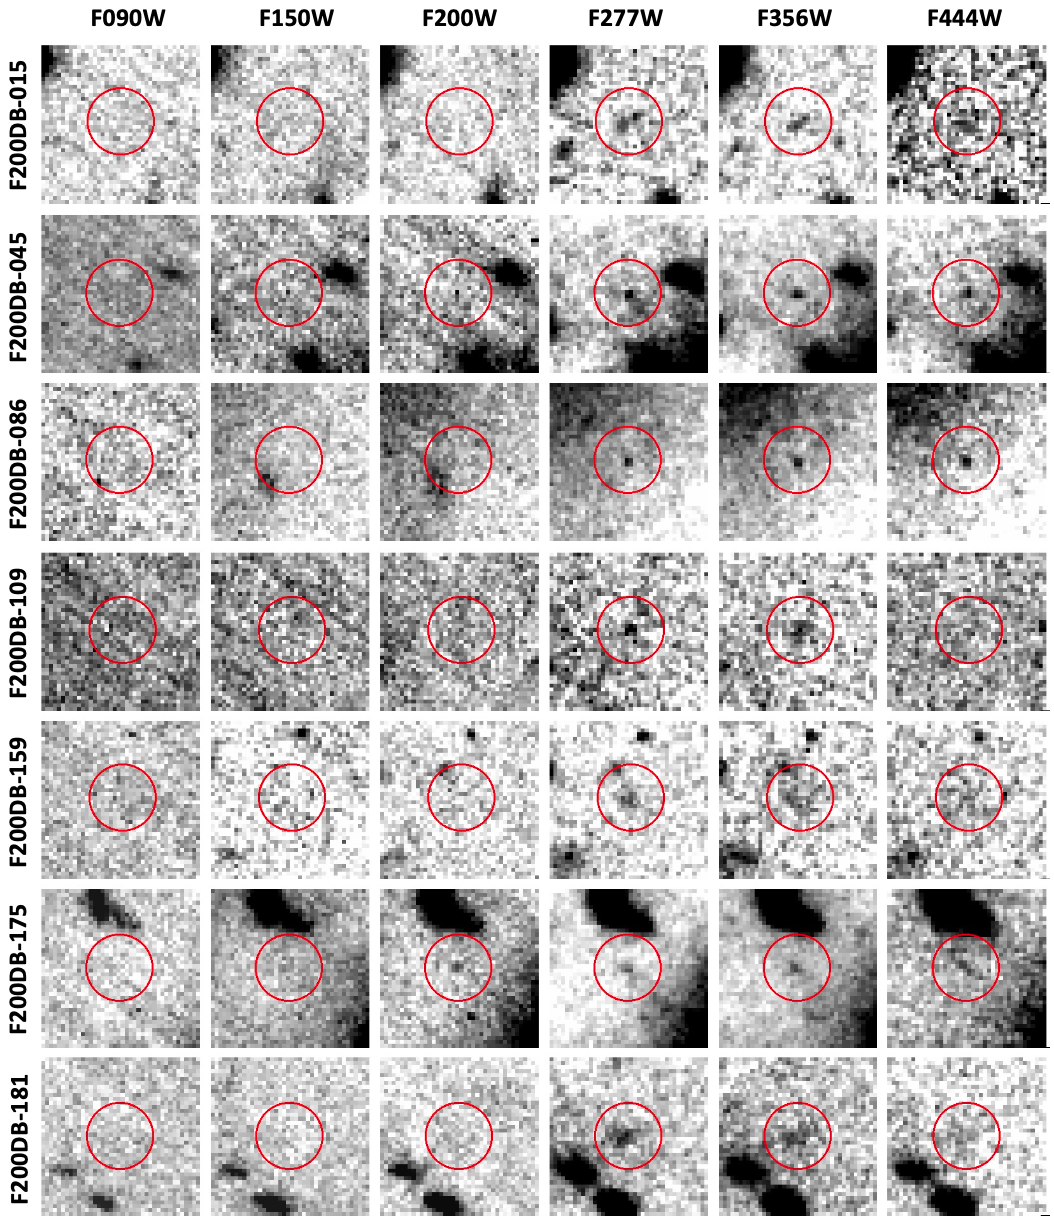
Fig. B2-b 6-band
Fig. B2-c 6-band
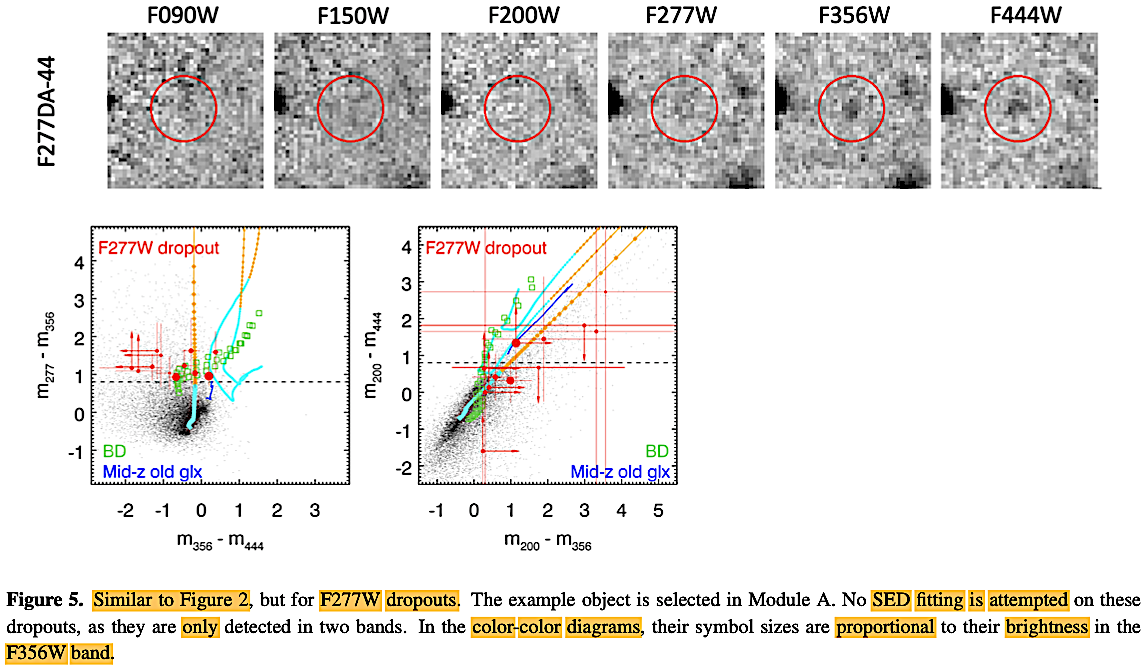
Fig. B2-d F277 band
 End of Yan et al. (2022) Appendix
Figure B.
End of Yan et al. (2022) Appendix
Figure B.
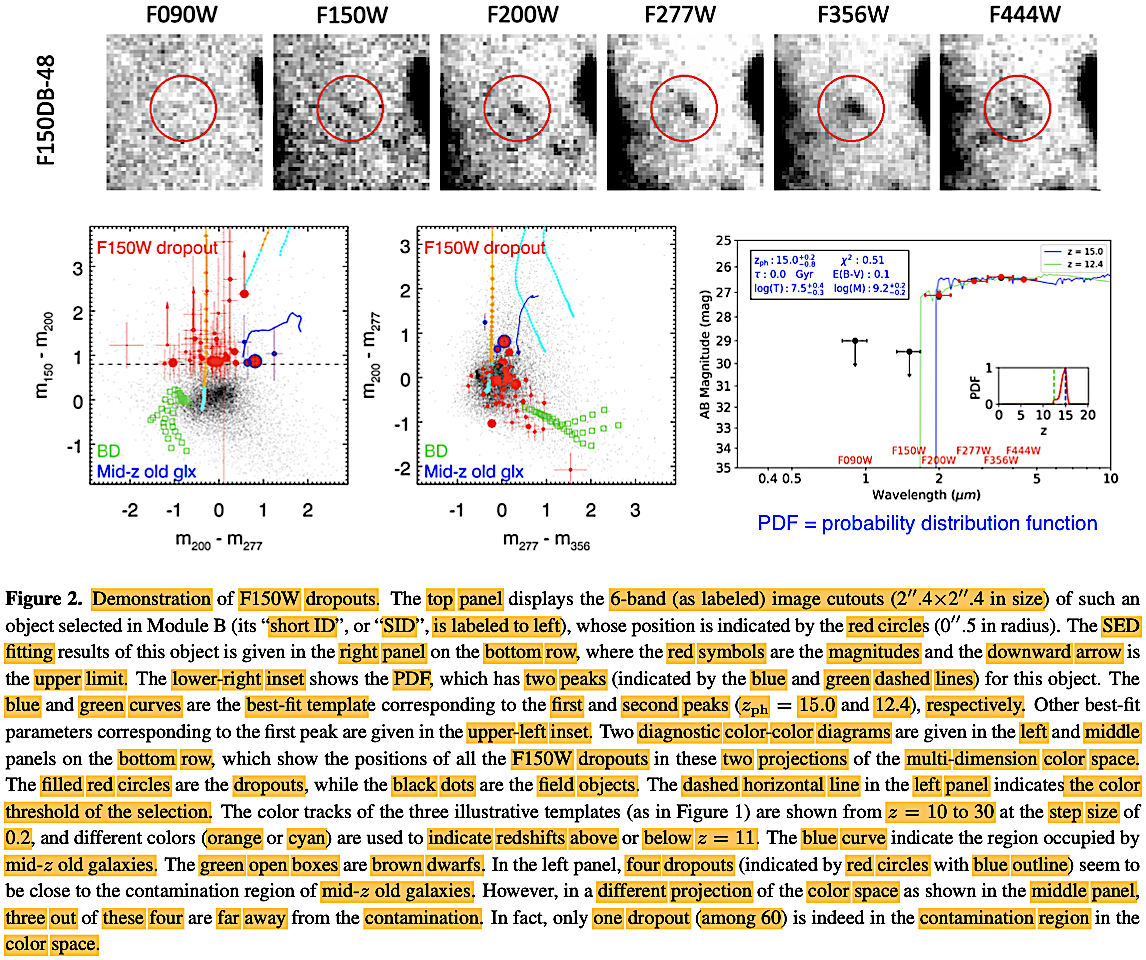
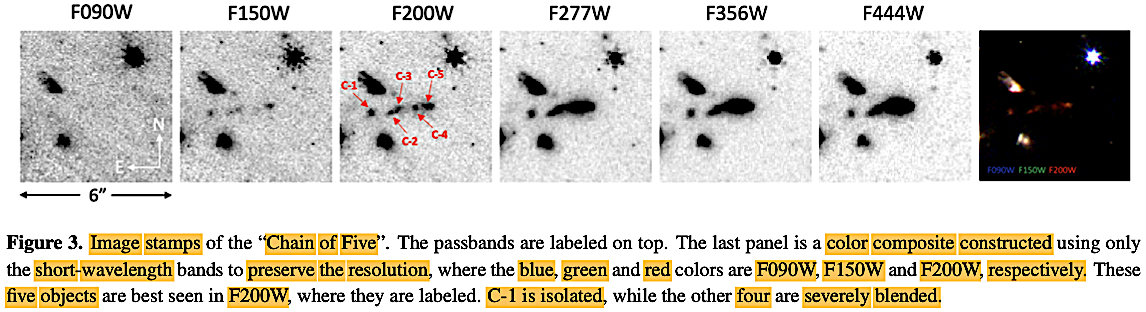
All the
cutout images of distant galaxies in each of 6 wavelength
bands assayed by JWST show differing levels of visible
resolution, in ways dependent on the wavelength.
Furthermore, in many of the bands the images are near, at,
or just beyond the level of JWST resolution. The same may
be said in general about the galaxy images in aggregate
across the bands. The "chain of five" galaxies are in
regular Figure 3, and are not included in this collection
of Appendix collection of cutout images.
The limits of resolution at these wavelength can be
visualized in the Figure B collages, as well as in the
magnitudes of these remote galaxies in the wavelength
bands summarized in Yan et al. (2022) Appendix
Table 1:
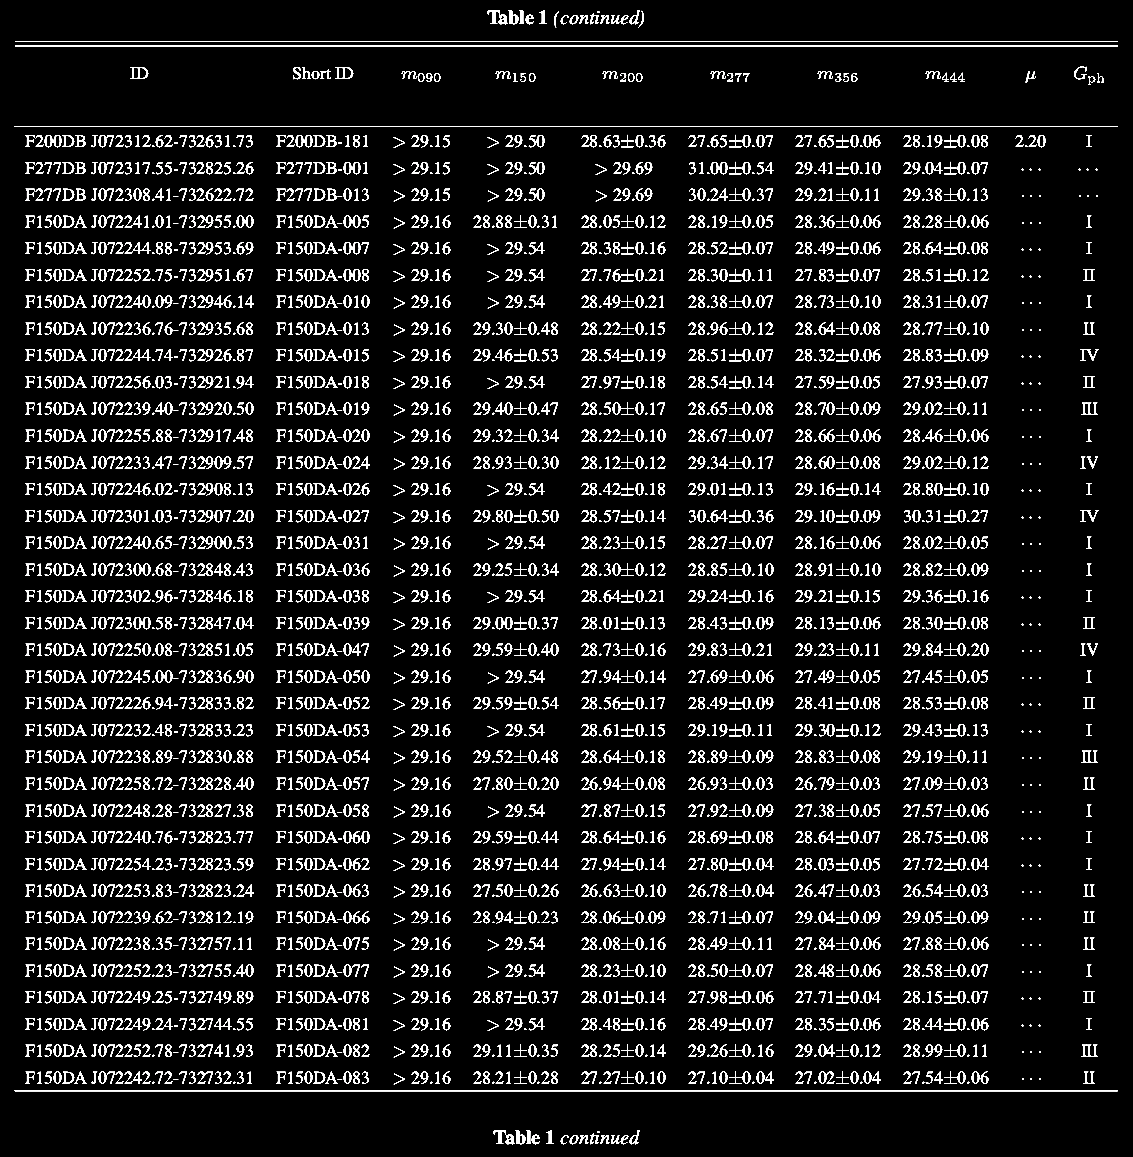
 Yan et al. (2022) Table 1.
These faint magnitudes lay out a range of the near limits of
the JWST resolution across these wavelength bands
available.
Fig. C1-a. Band F150 SED (spectral energy
distribution)-fitting using Le Phare [see Ilbert, O., Arnouts,
S., McCracken, H. J., et al. 2006. Accurate
photometric redshifts for the CFHT legacy surveycalibrated
using the VIMOS VLT deep survey. A&A 457
(3), 841. https://doi.org/10.1051/0004-6361:20065138].
The ubiquitous PDF stands for
"probability
distribution
function."
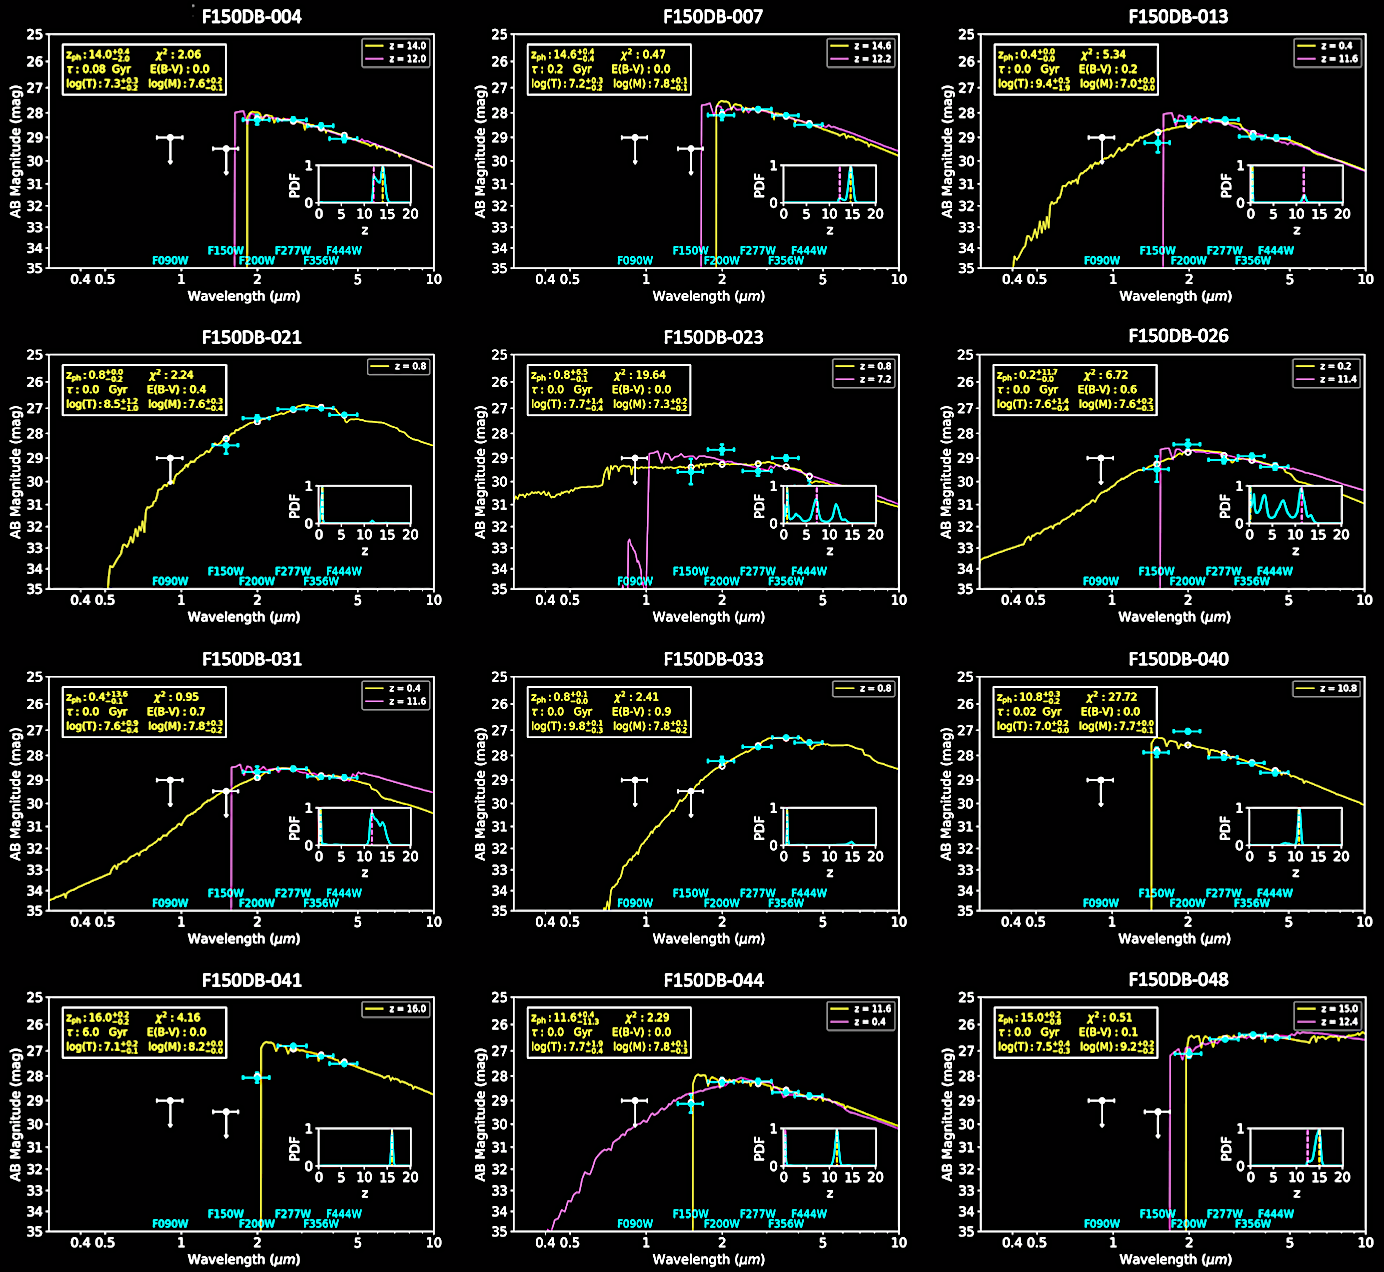
Fig. C1-b. Band F150. Again, coincident low and high redshift
NIR sources. Lots of them called 'contamination' by BBers but
astronomer should let the data speak on their own terms:
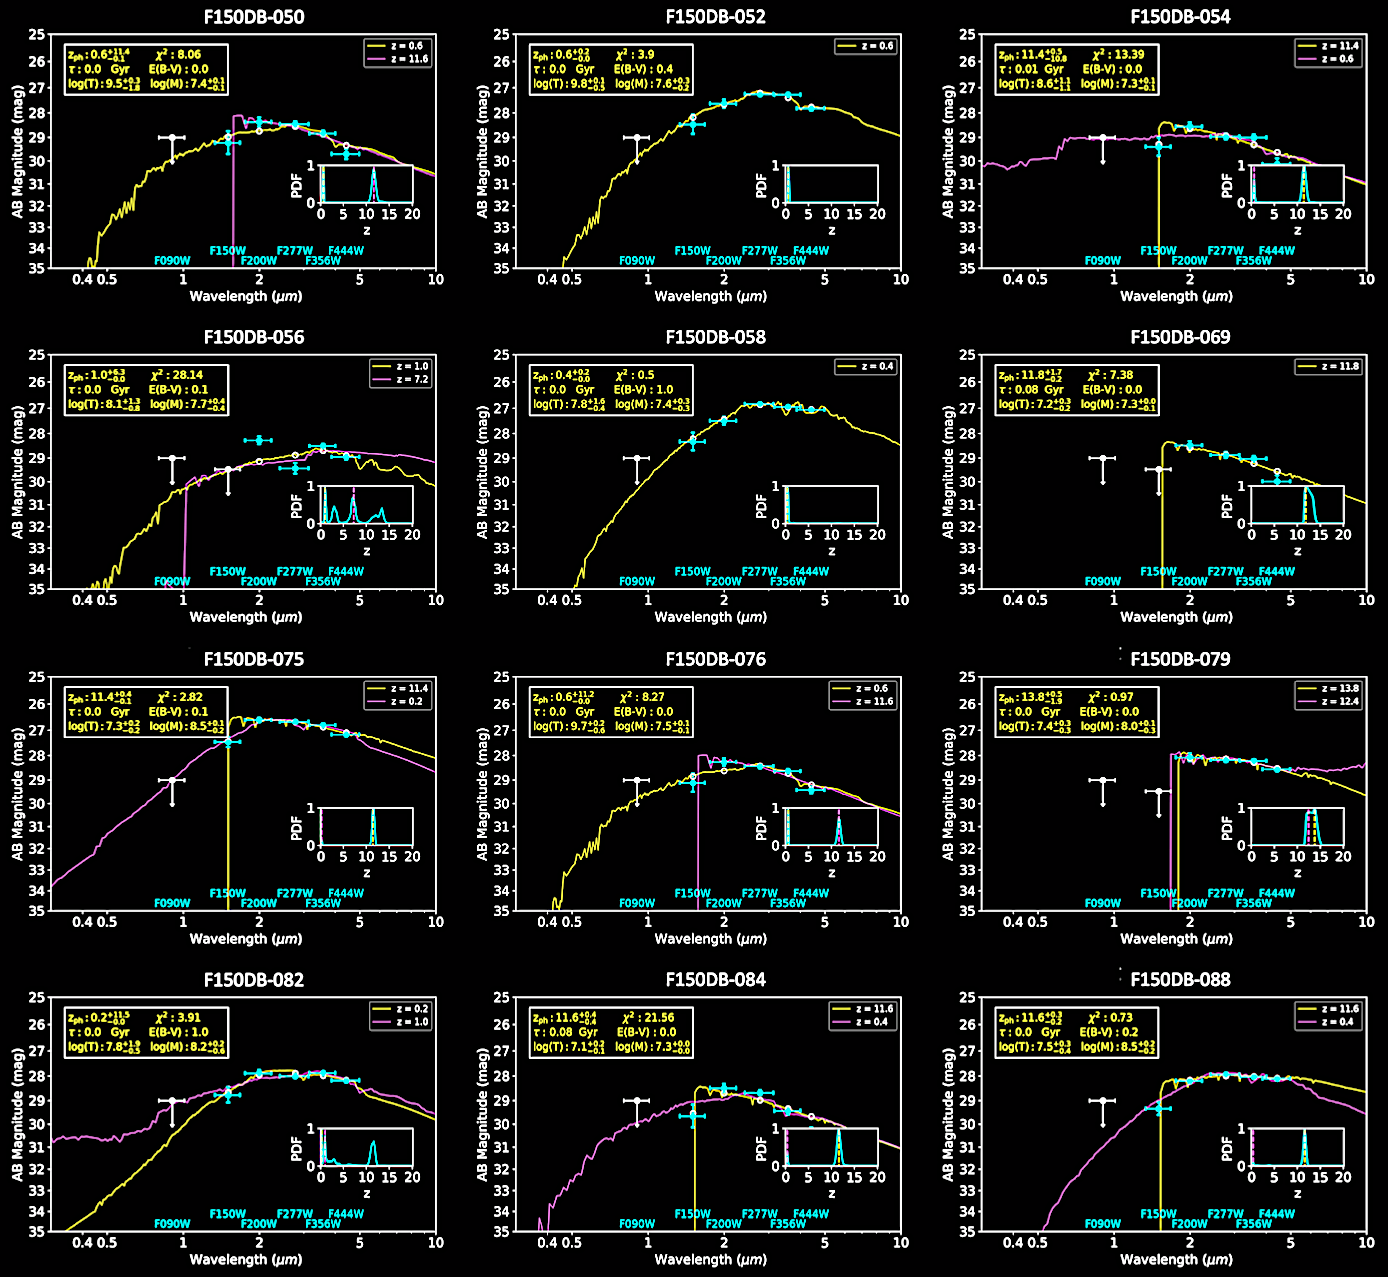
Fig. C1-c.
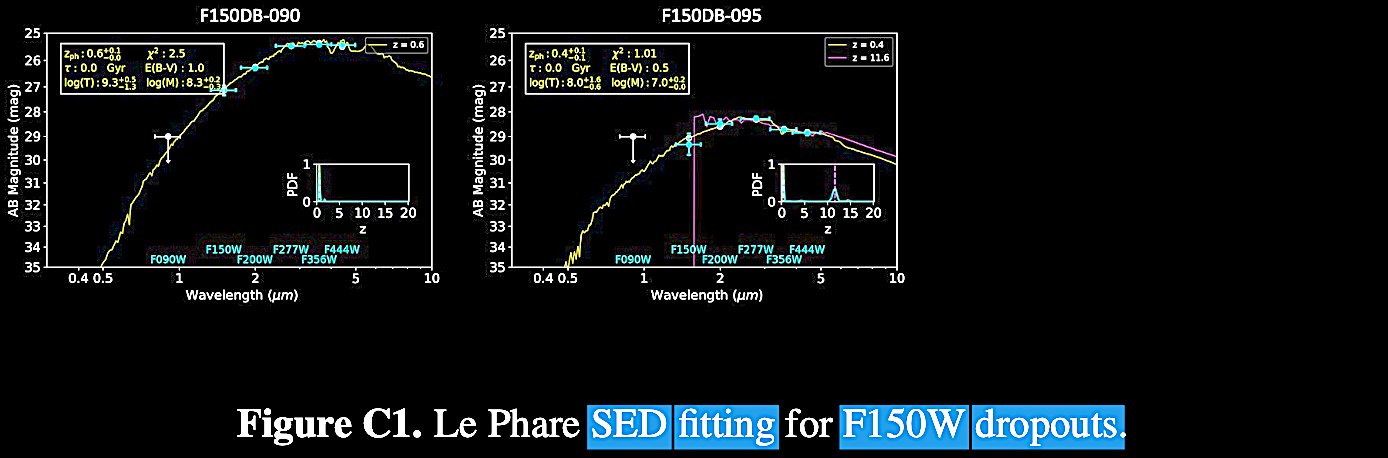 Fig. C1-d. Band F150. More 'coincident
contamination' of close-angular proximity low and high
redshift galaxies in the remote JWST field views of the
Universe.
Fig. C1-d. Band F150. More 'coincident
contamination' of close-angular proximity low and high
redshift galaxies in the remote JWST field views of the
Universe.
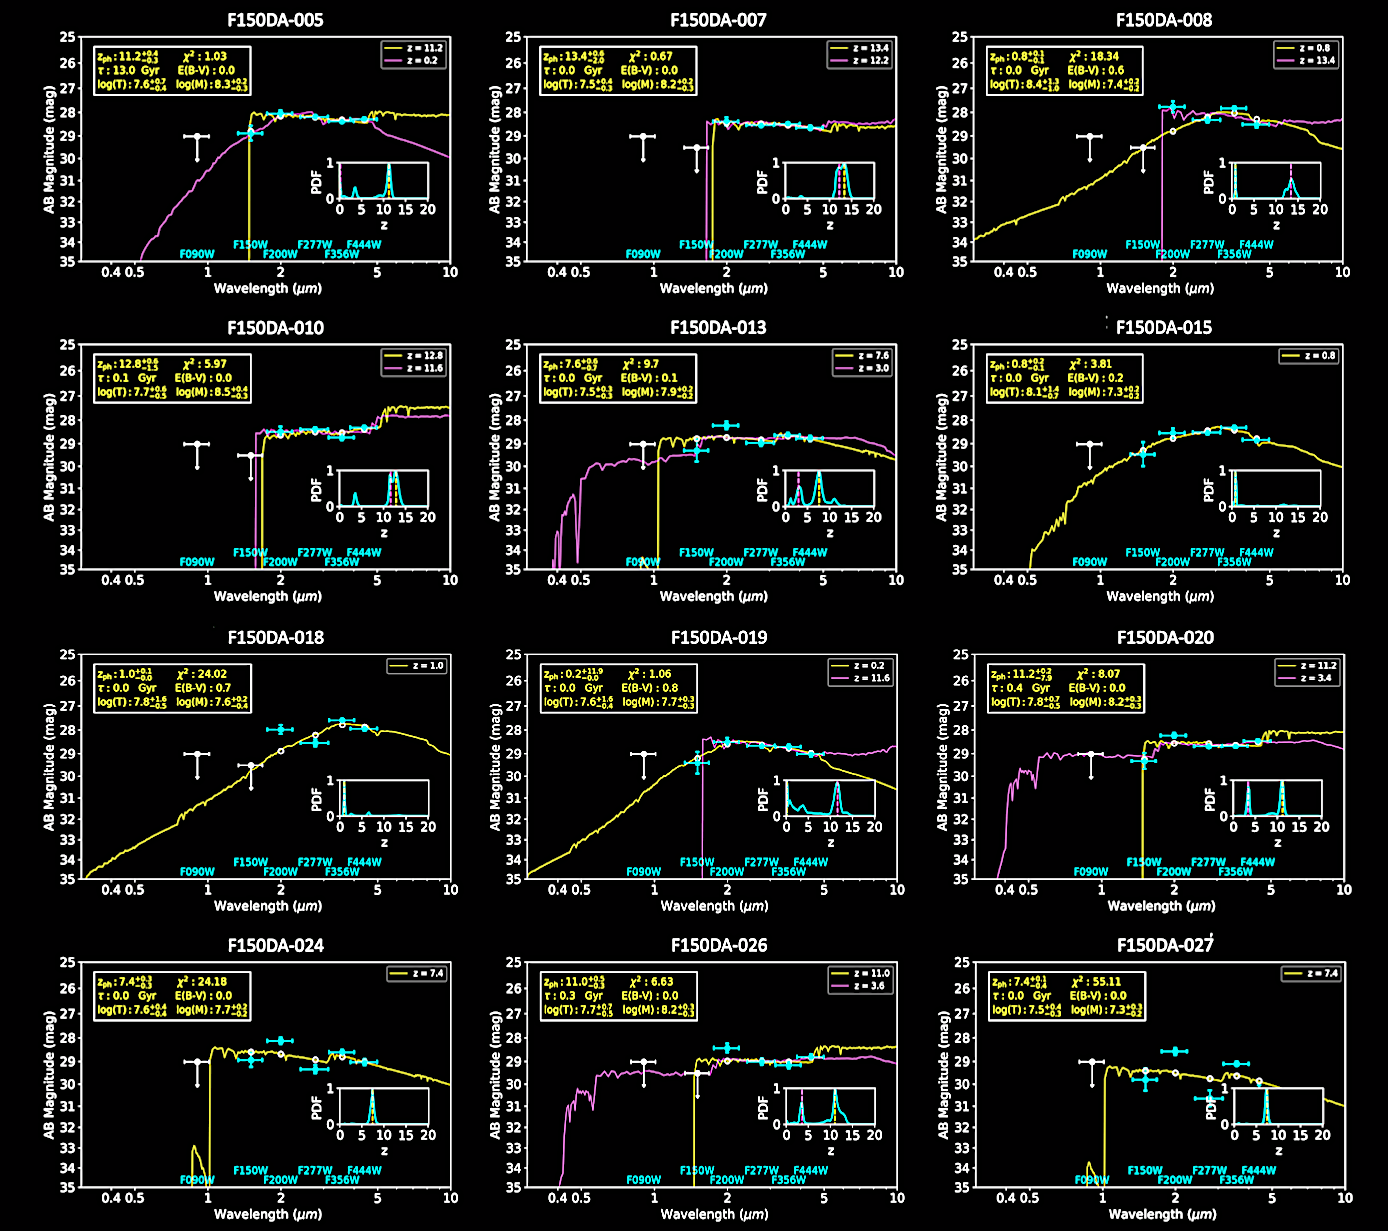
Fig. C1-e. Band F150.
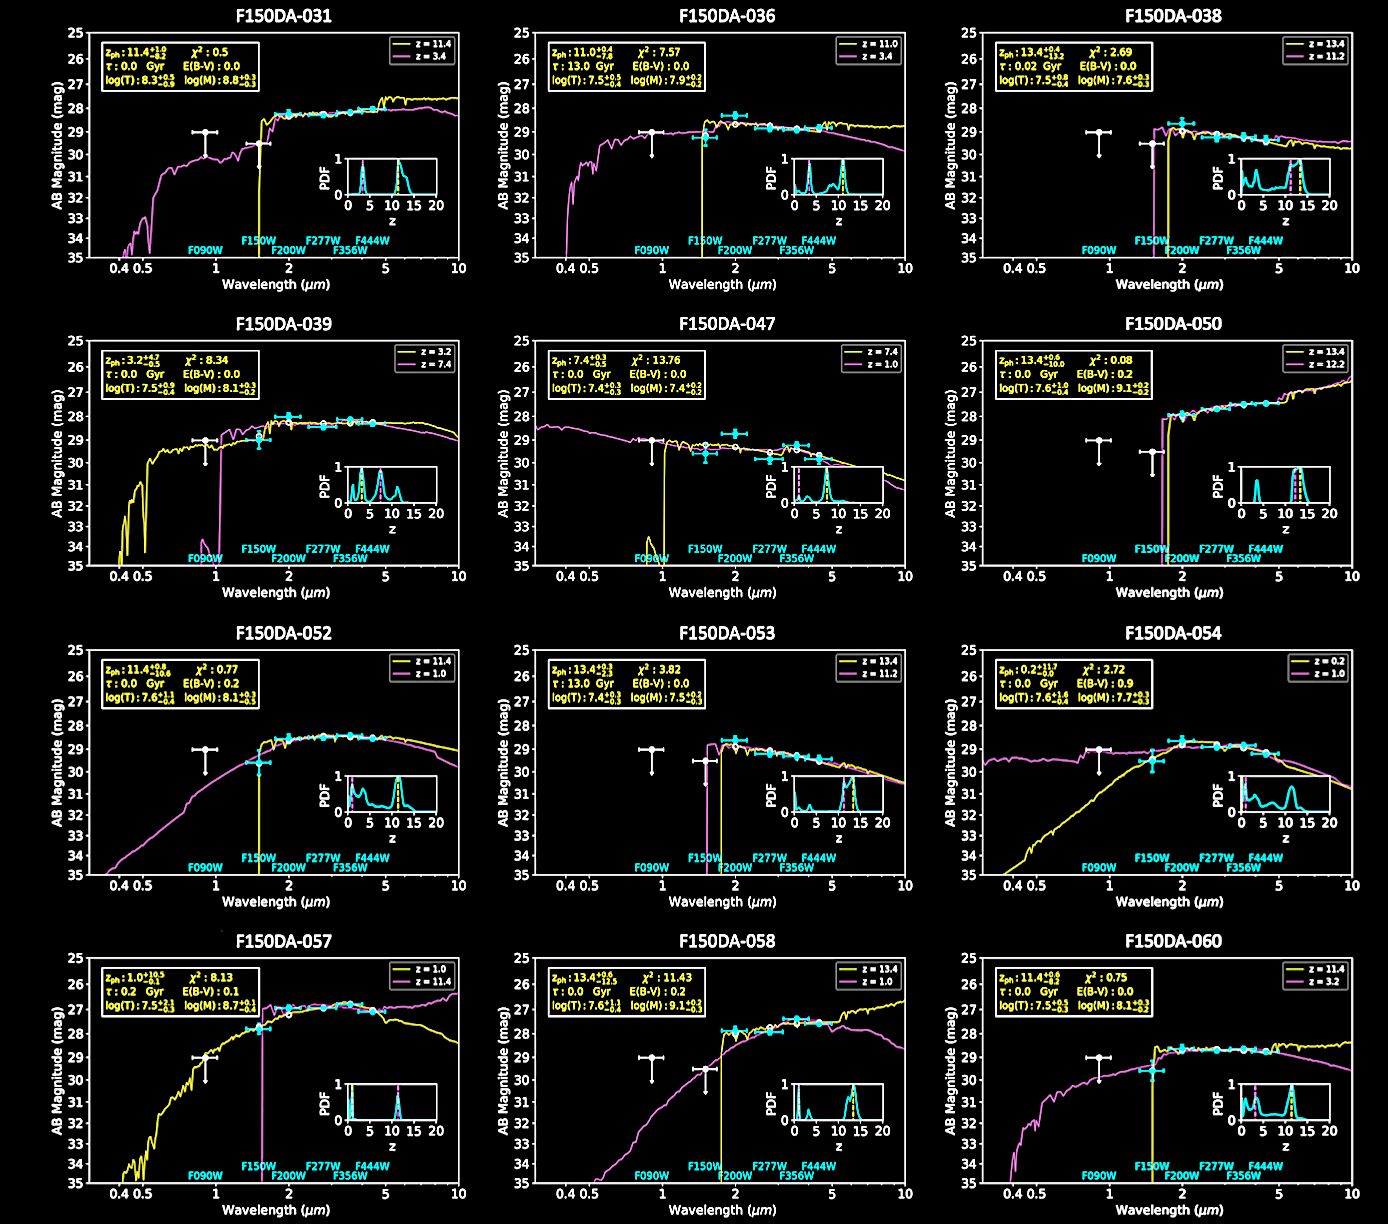
Fig. C1-f. Band F150.
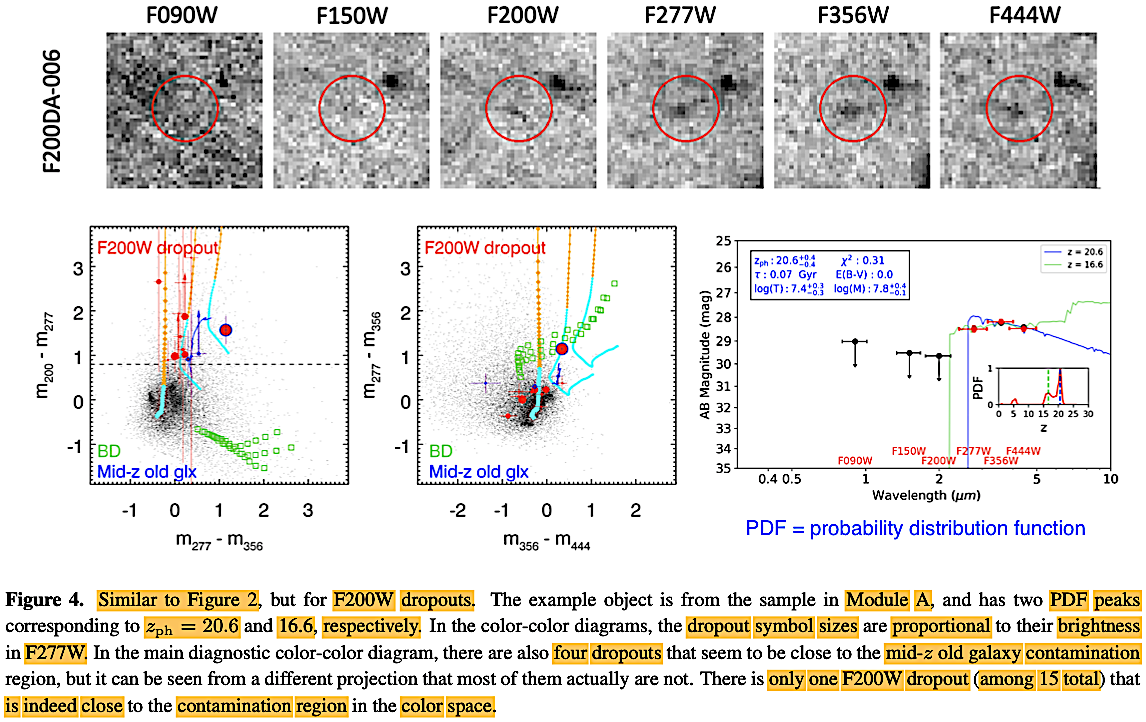
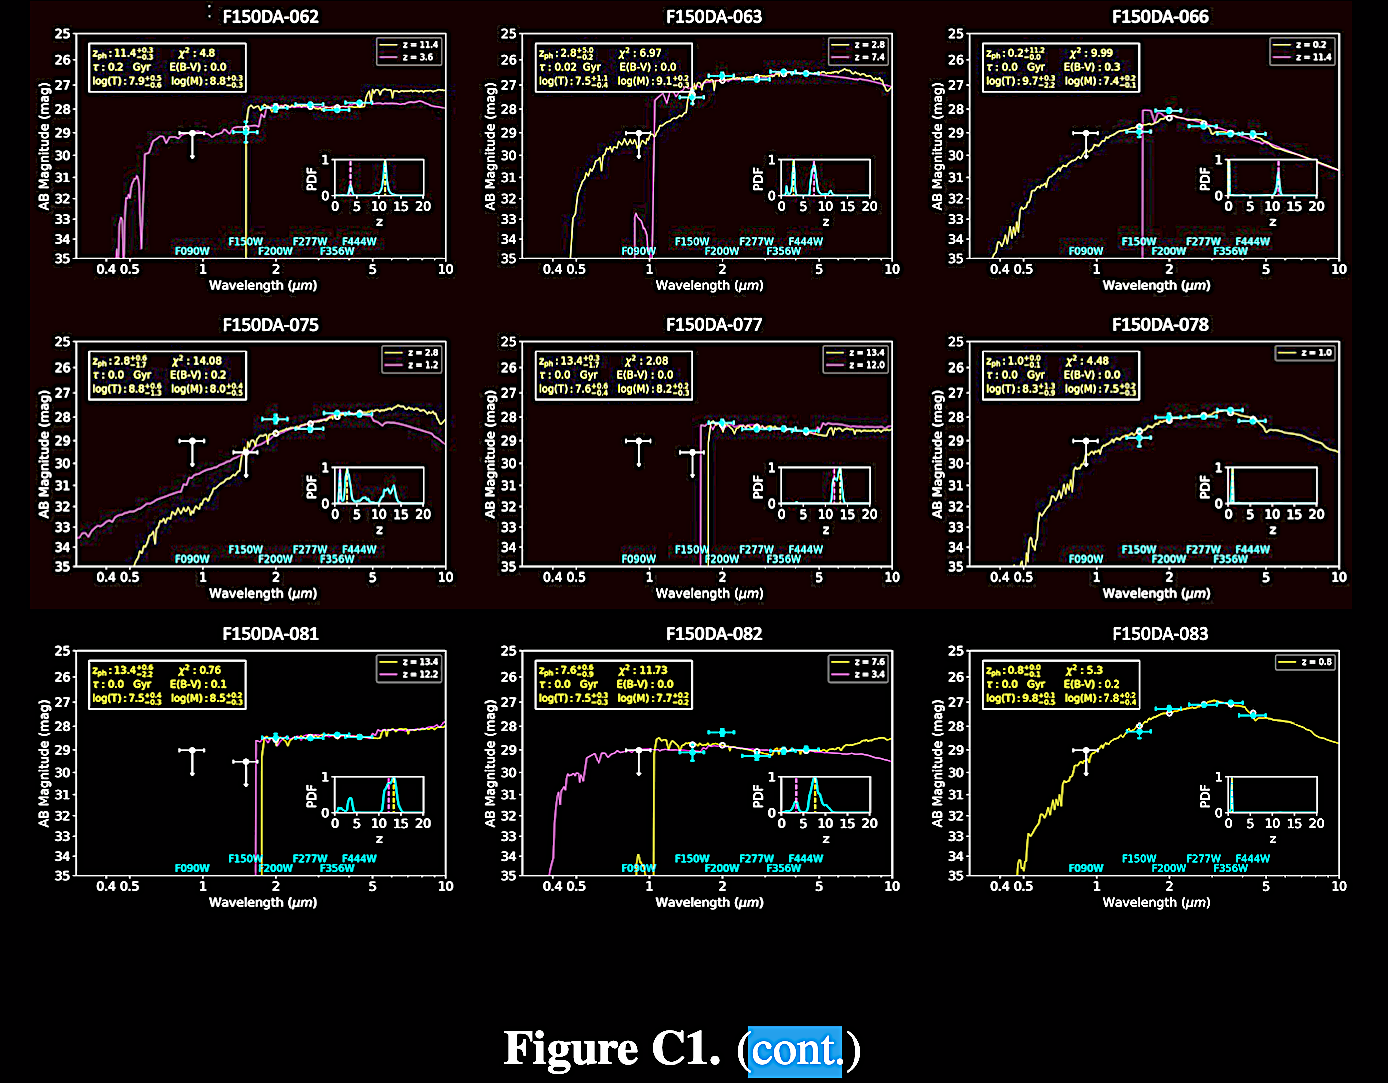 Fig. C2-a. Band F200.
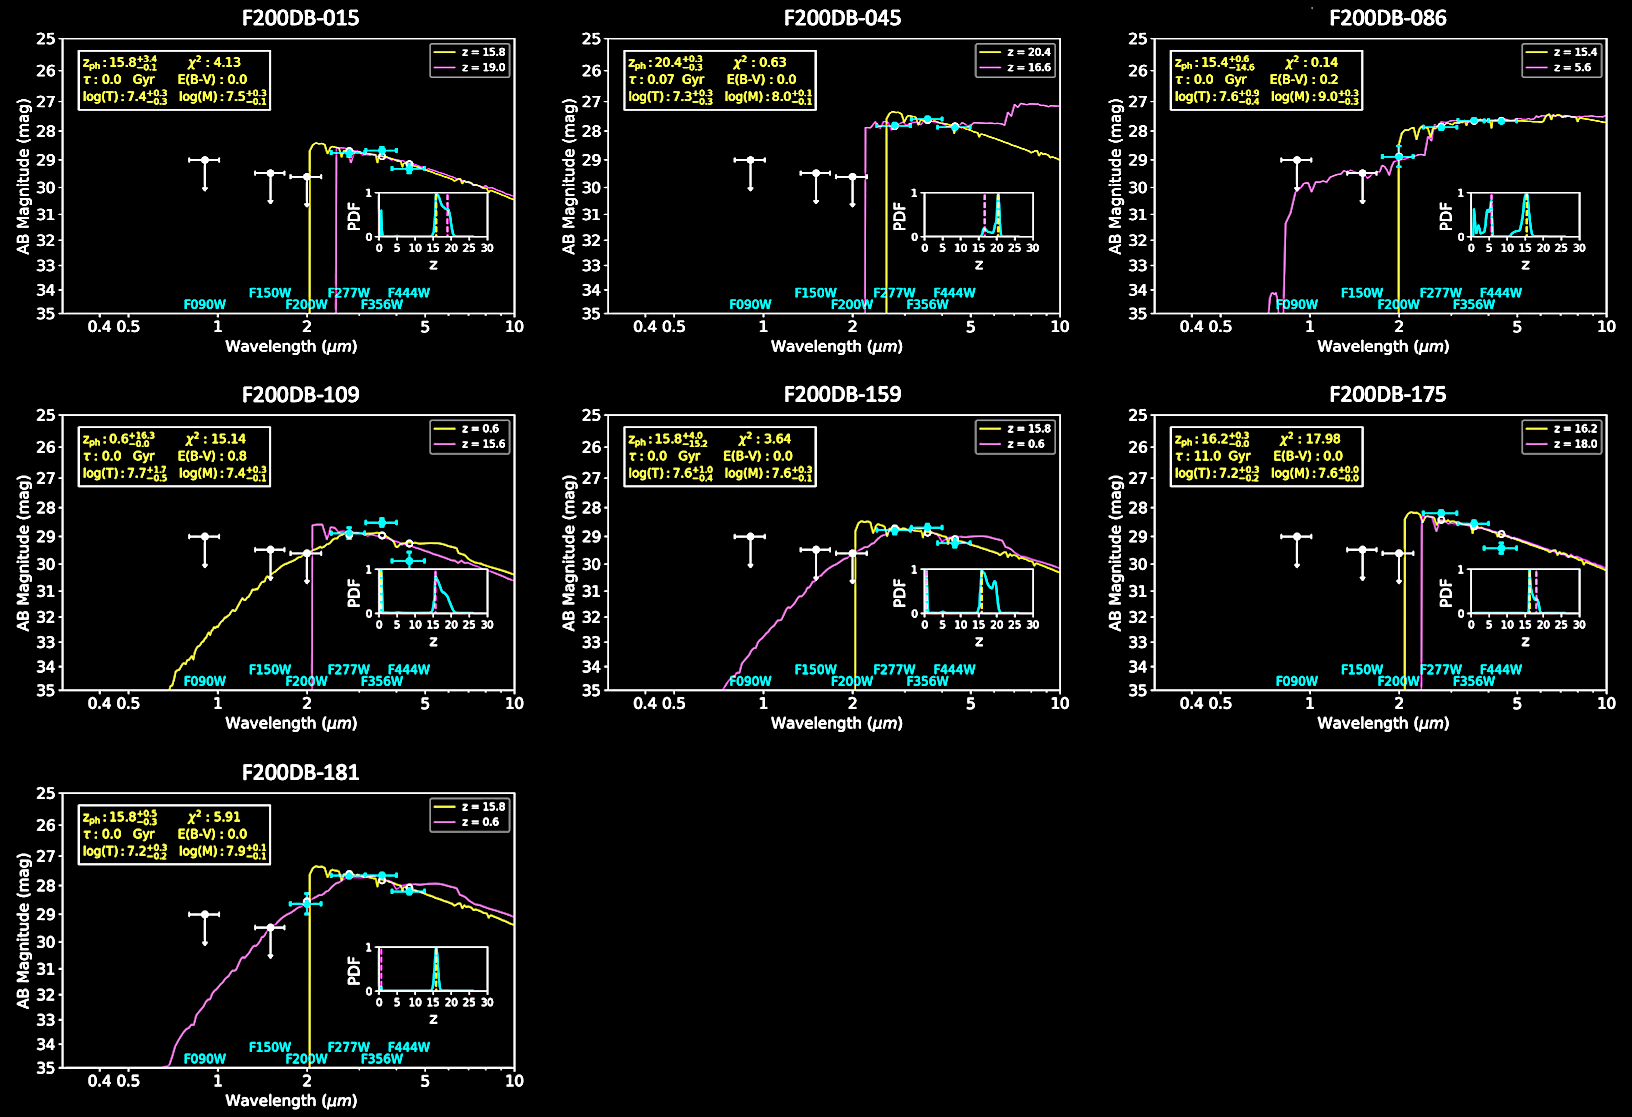 Fig. C2-b. Band F200.
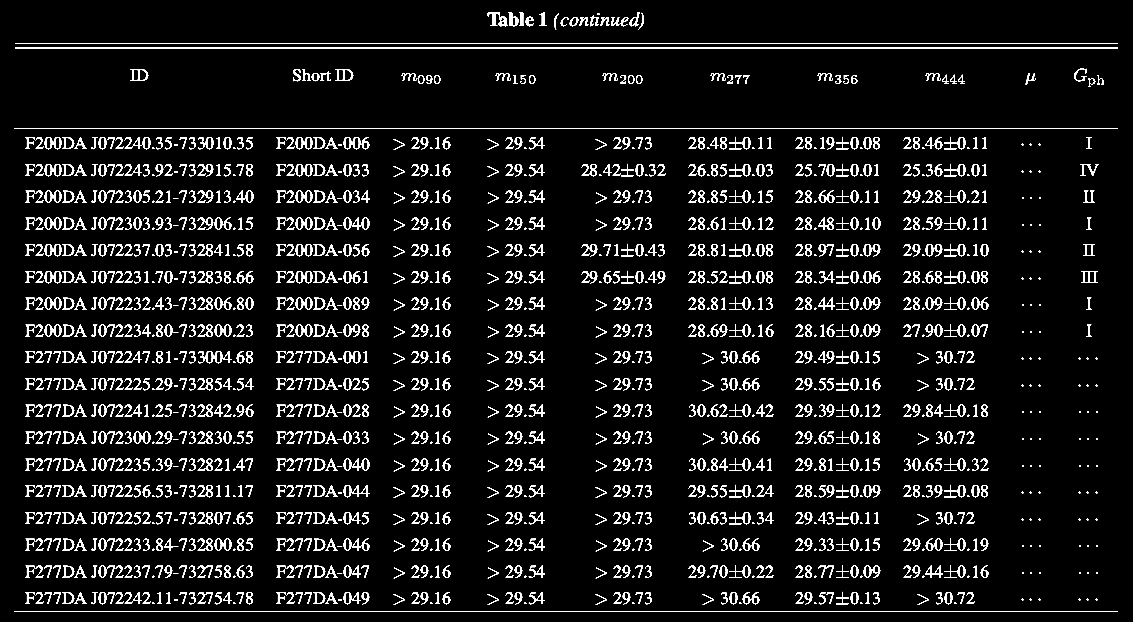
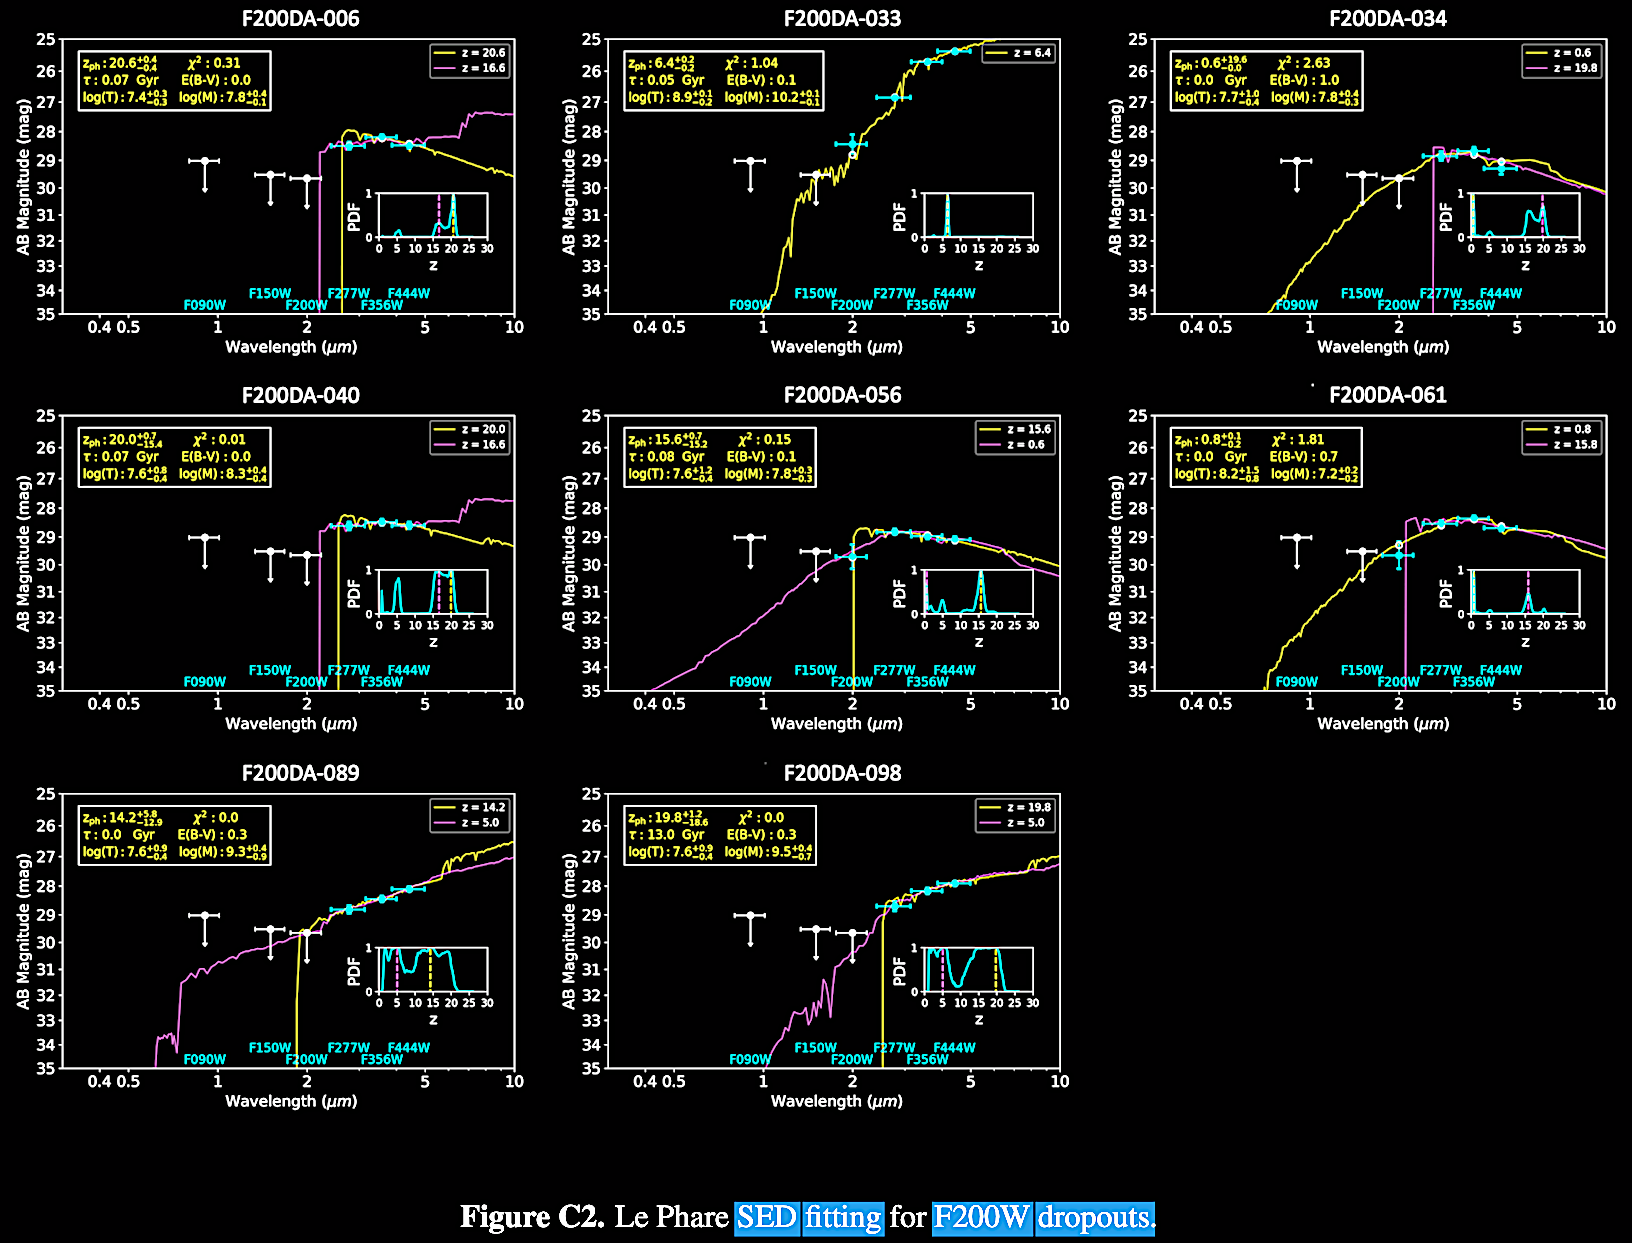 Fig. D1-a. Band F150 SED (spectral energy
distribution)-fitting using the EAZY-py package with templates
including emission lines (https://github.com/gbrammer/eazy-py)
modified to assay upper flux limits. We leave the images very
large in order to show the redshift values near the likely
current limits of JWST resolution. The little cyan circle-dots
are the synthesized flux densities based on best-fit models.
Fig. D1-a. Band F150 SED (spectral energy
distribution)-fitting using the EAZY-py package with templates
including emission lines (https://github.com/gbrammer/eazy-py)
modified to assay upper flux limits. We leave the images very
large in order to show the redshift values near the likely
current limits of JWST resolution. The little cyan circle-dots
are the synthesized flux densities based on best-fit models.
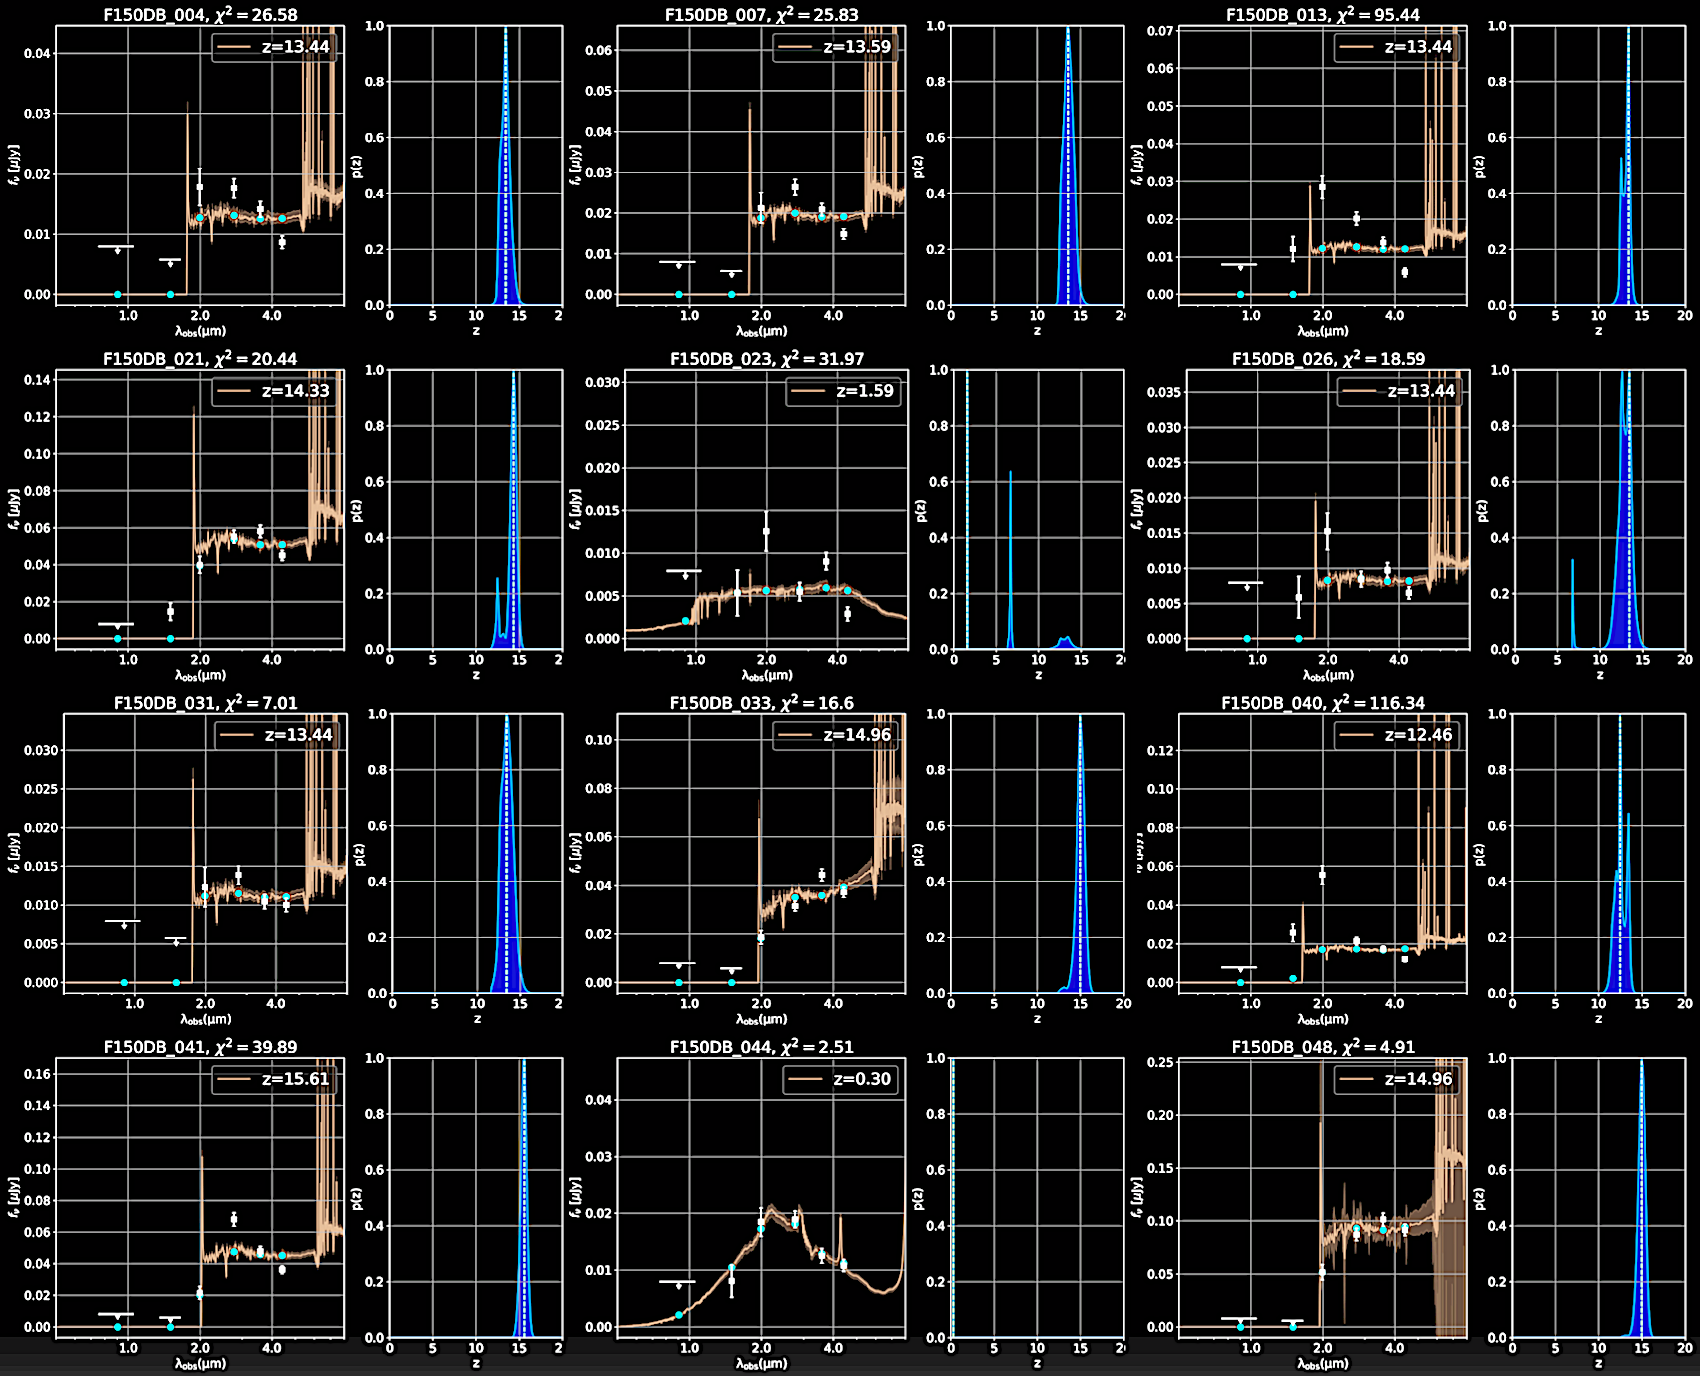
Fig. D1-b. Band F150.
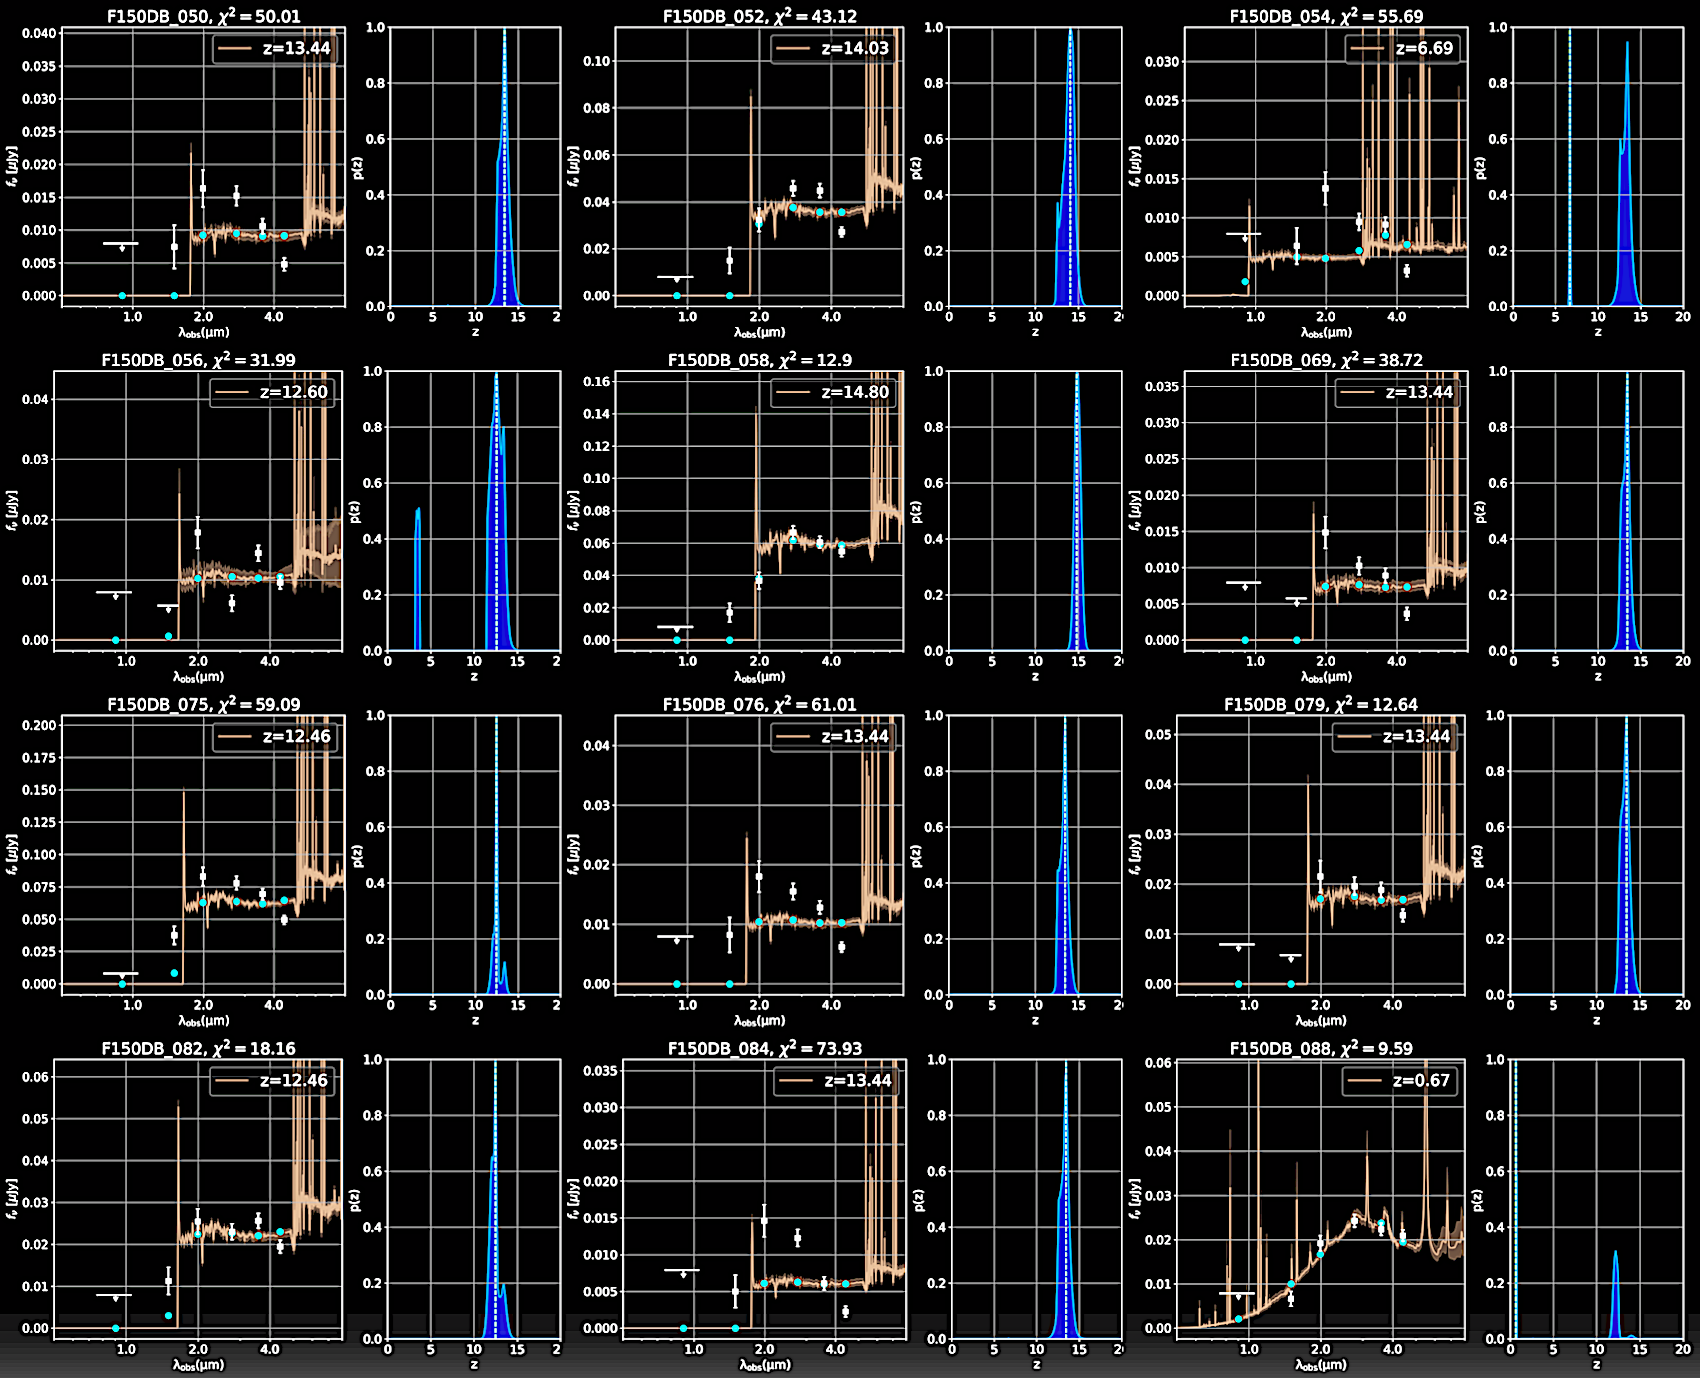
Fig. D1-c. Band F150 (legend).
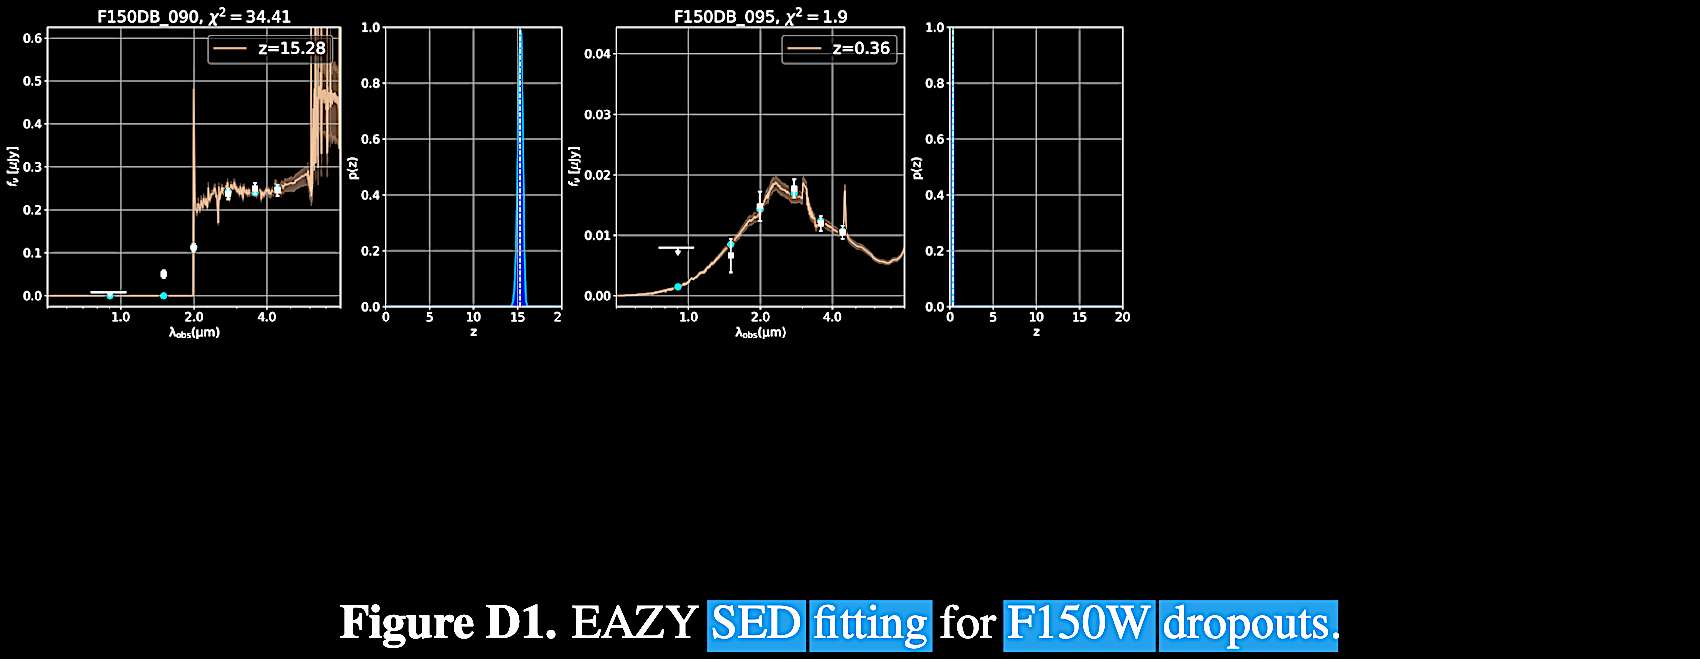 Fig. D1-d. Band F150.
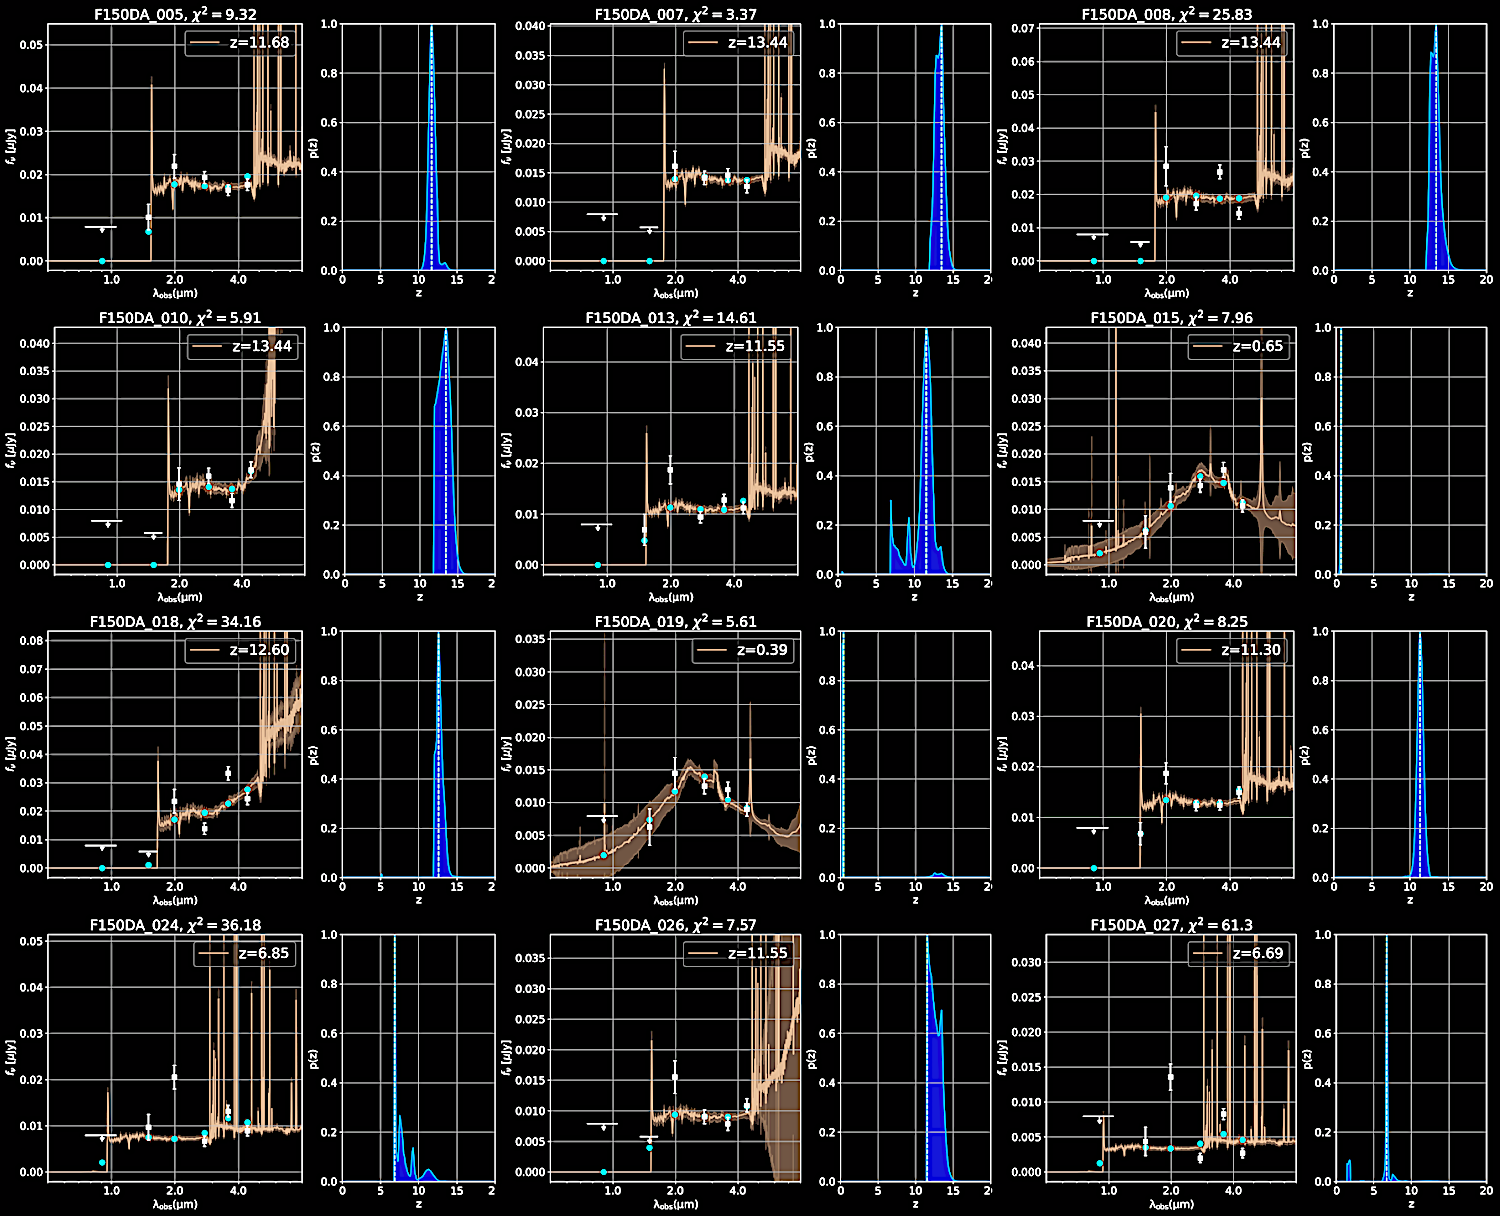 Fig. D1-e. Band F150.
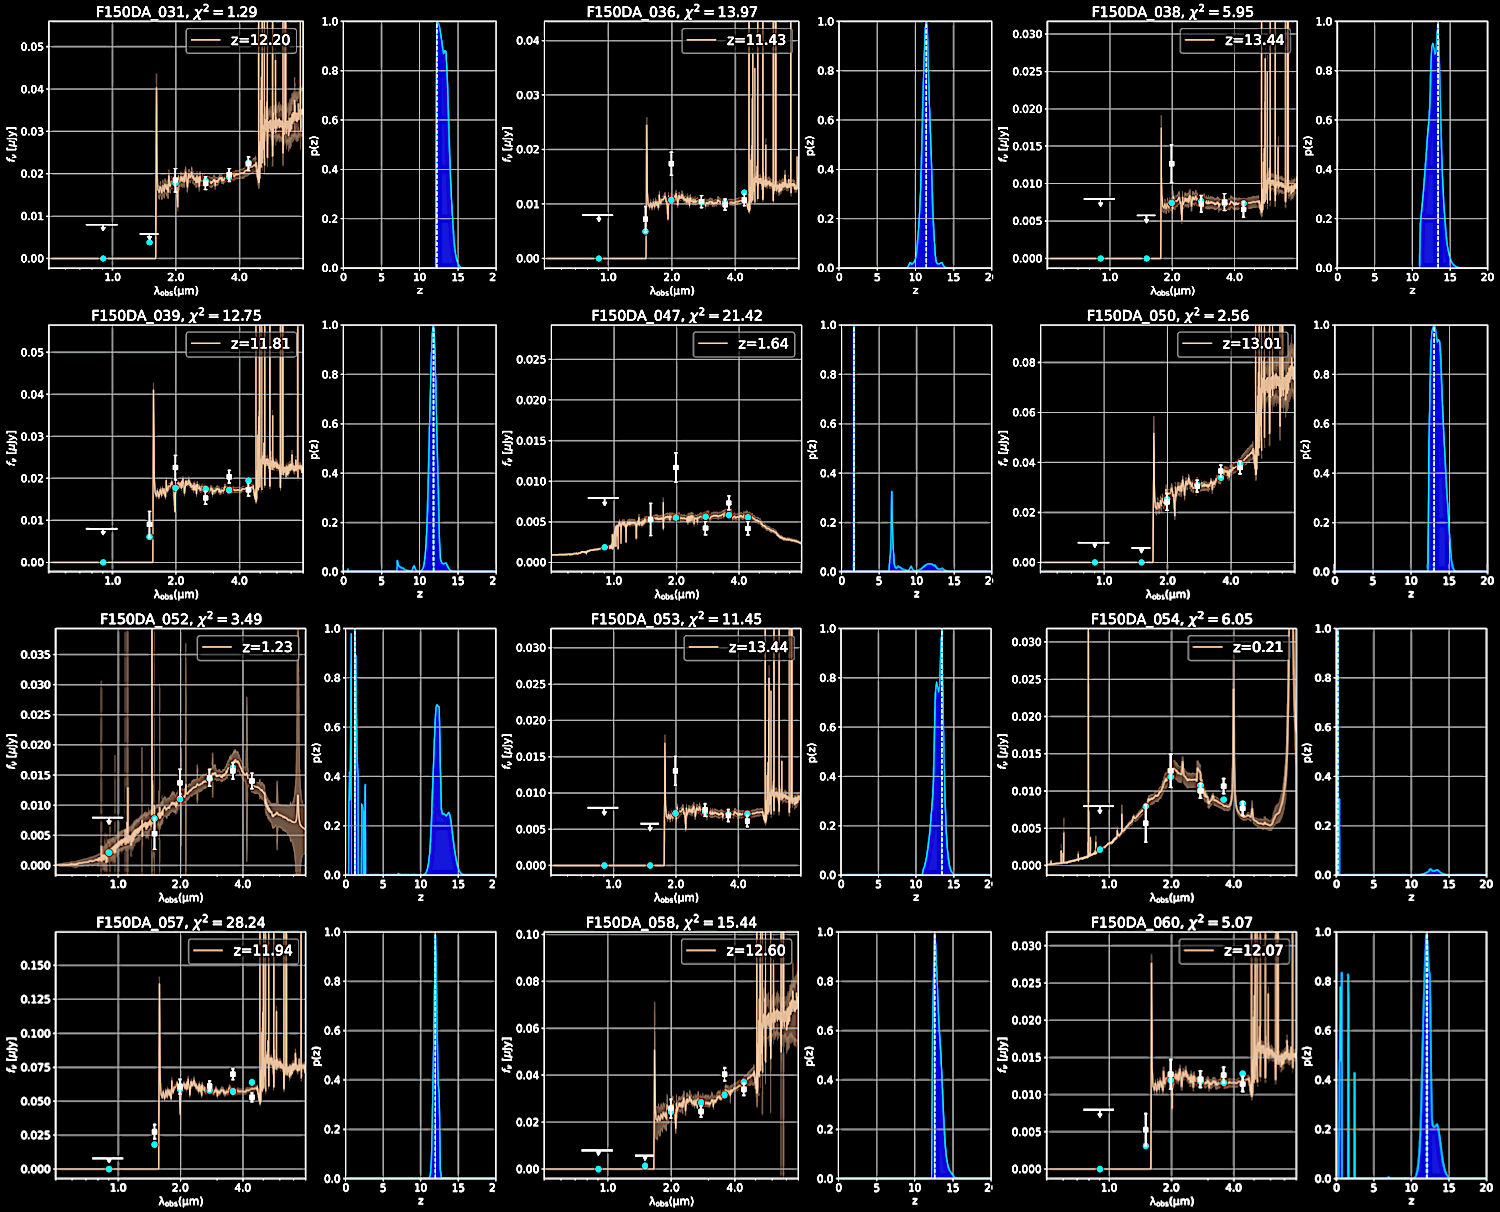
Fig. D1-F150 cont.
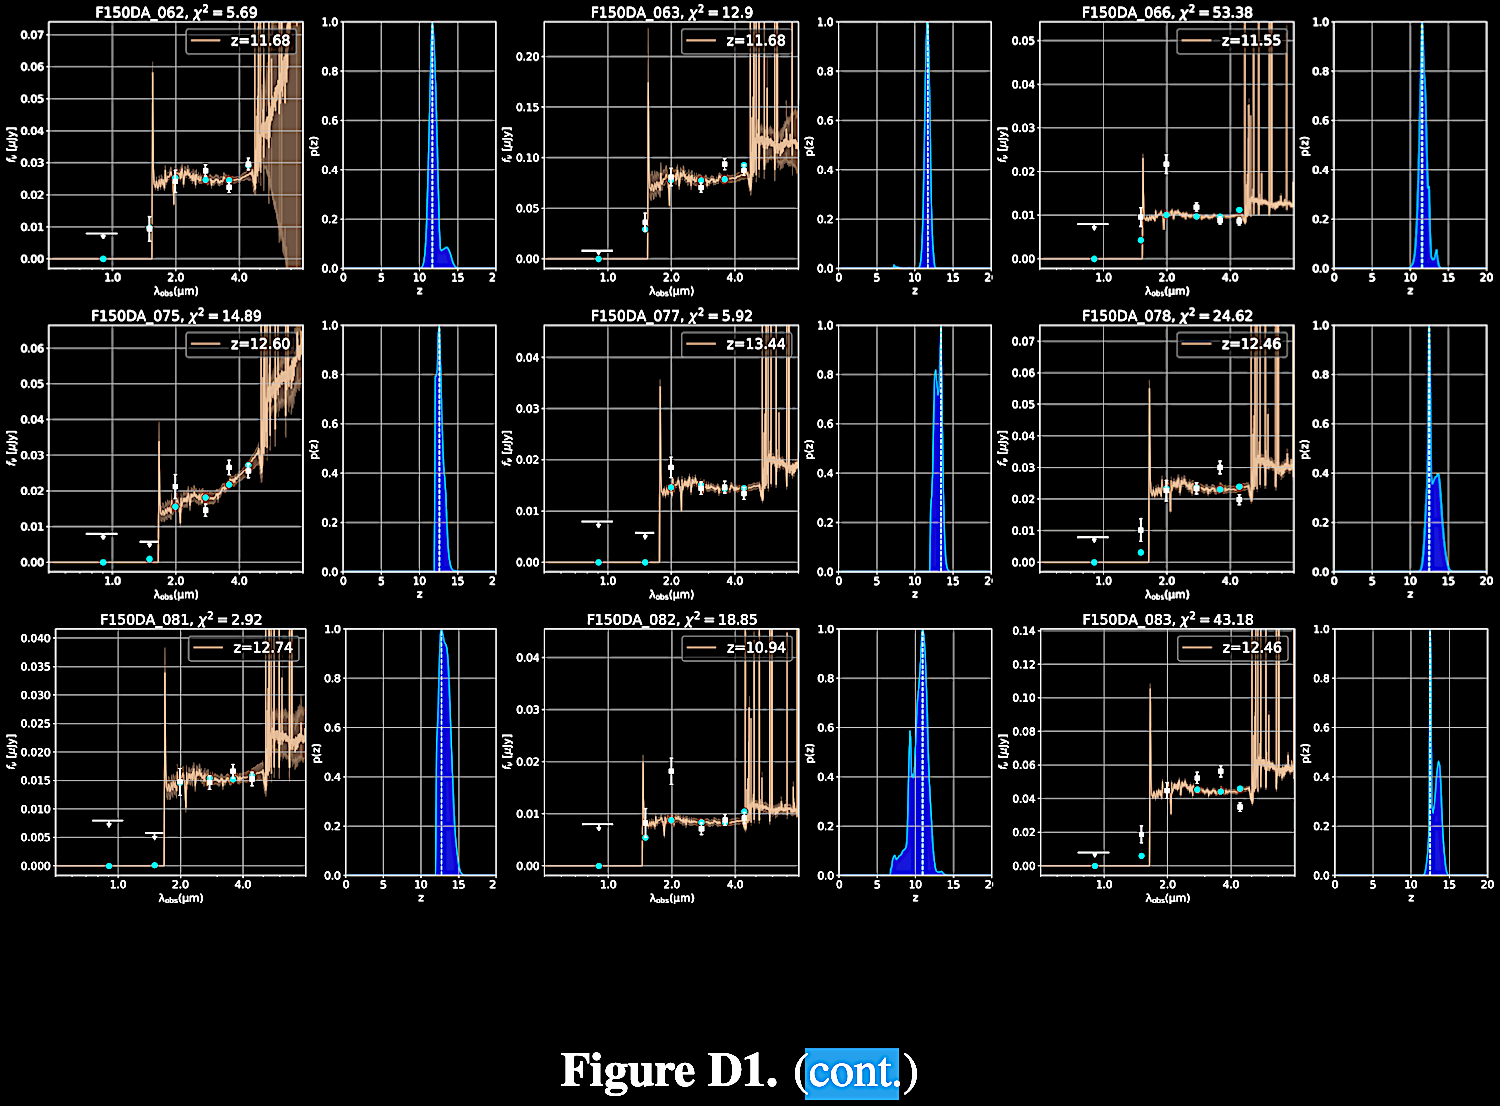
Fig. D2-a. Band F200.
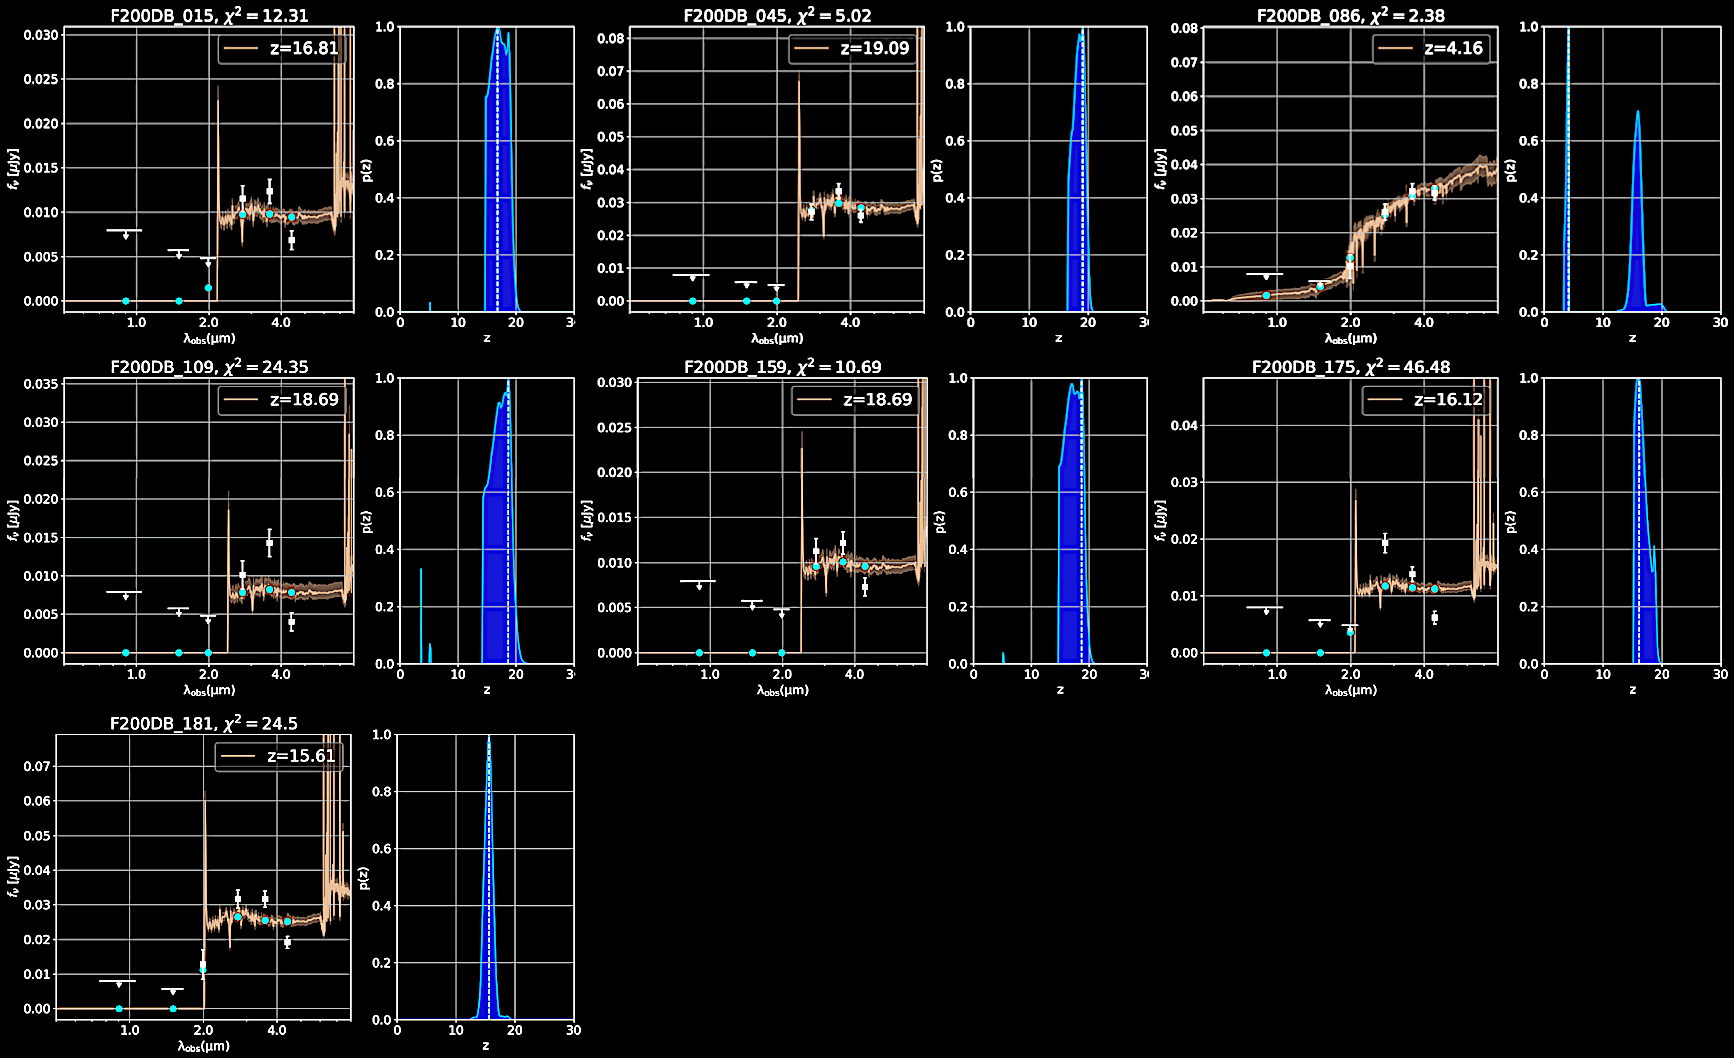
Fig. D1-b. Band F200 (legend).
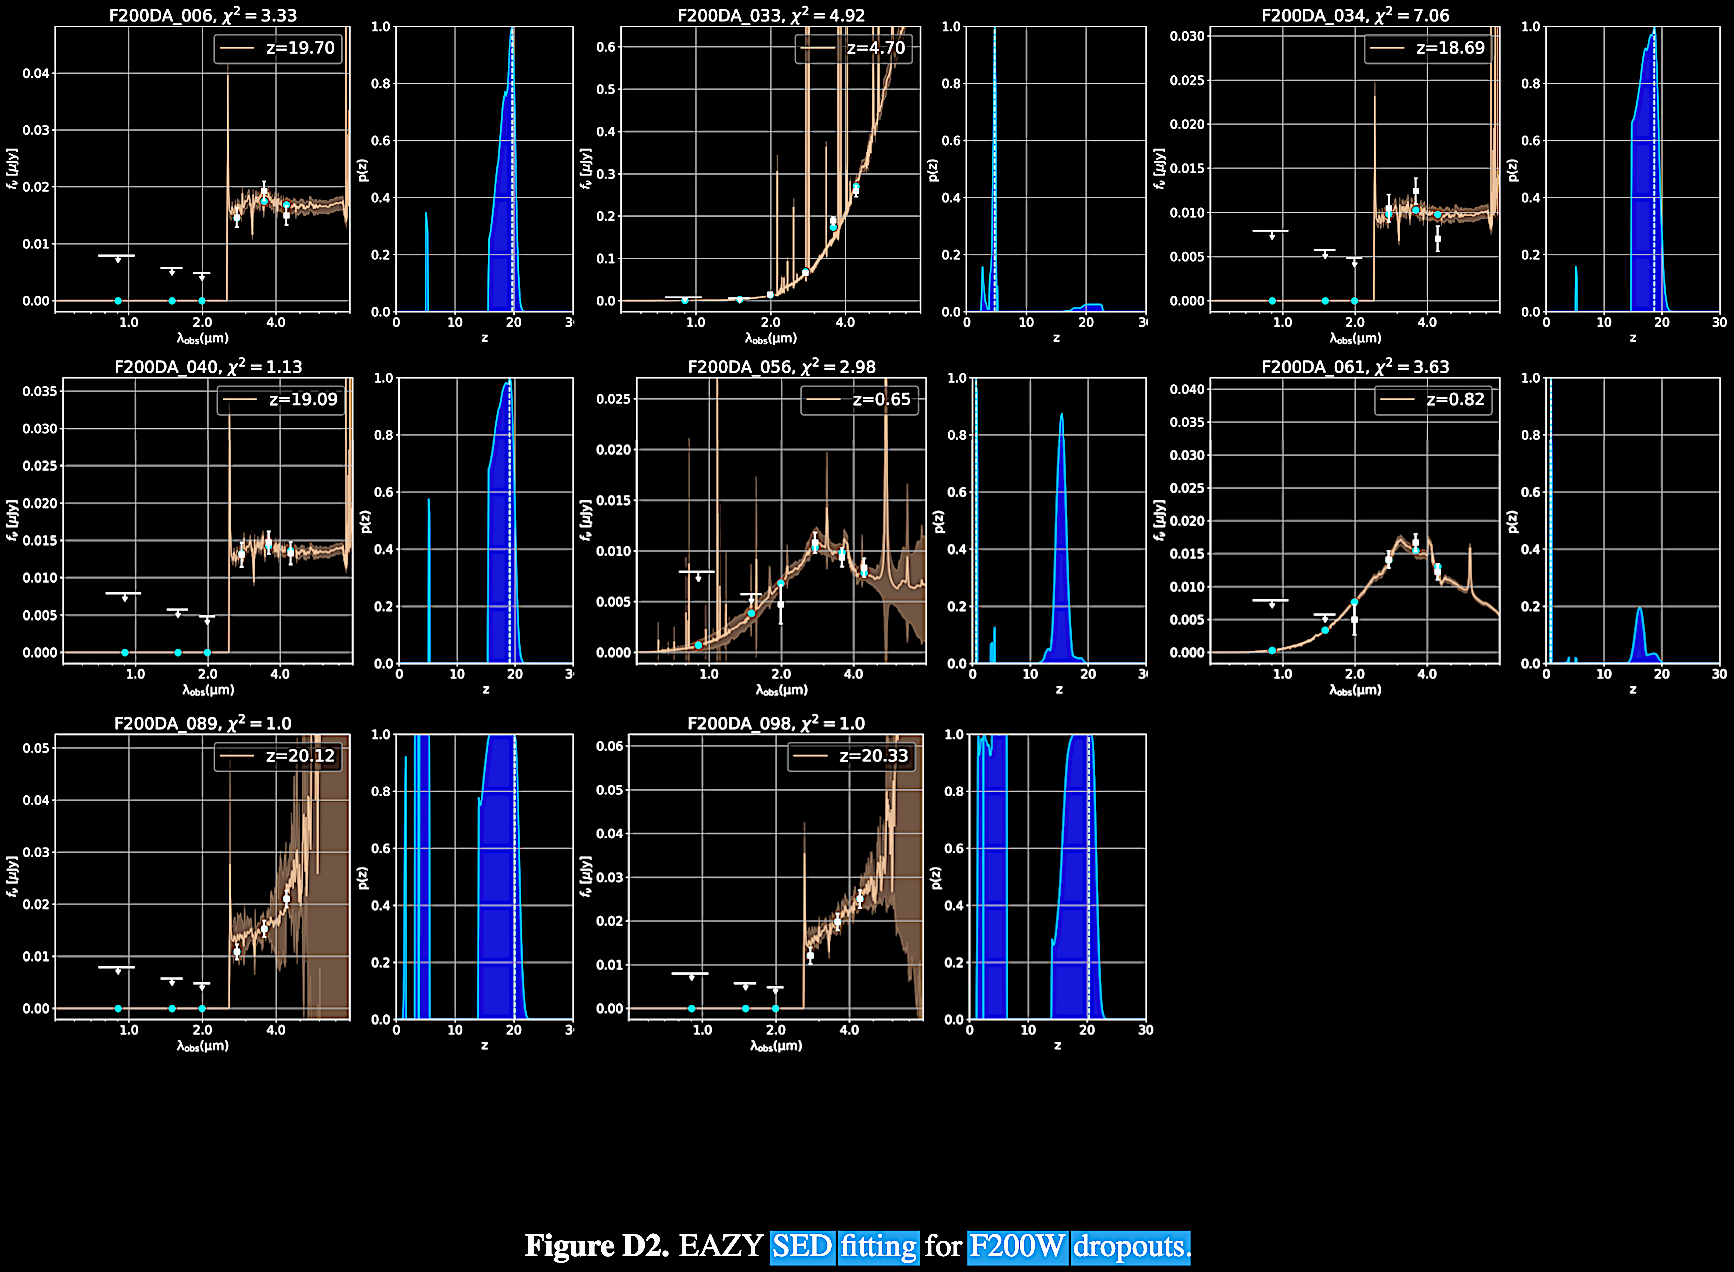 Yan et al. (2022).
A summary of the spectral data
included in
Appendix
Figures C and
D yield some
very
interesting
patterns.
Appendix
Figure C
Le Phare SED analyses
74 total
|
Double z
spectra
59 / 74 ~ 80%
|
Very
Close high zph values (~1-2 z
units)
16 / 59 ~ 22%
Low z & high z 'coincident'
(multiple z units)
(59 - 16): 43 / 74 ~ 58%
|
"
|
Single z
spectra secondary PDF peaks
(74 - 59): 10 / 15 ~ 67%
|
Tertiary
peaks
46 / 59 ~ 78%
|
Appendix
Figure D
EAZY-py SED analyses
74 total
|
Secondary
p(z) =/> 0.80 peaks, including
broad peaks topping threshold
25 / 74 ~ 34%
|
Secondary
& Tertiary peaks (any number)
61 / 74 ~ 82%
|
Yan
et al. (2022) SED spectra summary.
The low
photometric z
measurements
are considered
"contamination"
but they are
also data from
those exact
angular
locations.
What if they
not merely
coincident? it
is interesting
to note how
many assayed
galaxies occur
with low and
high redshift
SEDs, pairs of
high redshift,
and secondary
/ tertiary
peaks. What
if all of
these are
exactly what
would be
expected of
young galaxies
in the
Ambartsumian-Vorontsov-Vel'yaminov-Arp
(AVVA)
cosmogony
model?
Research
recommendation:
Vast and
complete
photometric
redshifts
should be
collected from
all of the
JWST deep
fields and
more deep
fields should
be assayed to
test
(including
away from
intervening
Abell
clusters, such
as SMACS 0723)
whether such
angular
'pairings' are
coincidental
or occur far
beyond the
predicted
threshold for
coincidence.
Such
'associations'
are also
noticeable in
the SEDs of
other papers
cited above.
We will of
necessity
discuss this
more. This
issue is an
important
proposed test
of
cosmological
models,
outside the
New Ptolemaic
paradigm of
the HBBC.
25 July
2022 (Monday) released,
last revised
31 October
2022;
published 23
December 2022
/ February,
2023. On
arXiv was the
first release
of Atek et
al. 2022.
Revealing
galaxy
candidates out
to z ~
16 with JWST
observations
of the lensing
cluster
SMACS0723. https://arxiv.org/abs/2207.12338.
This paper was
then
published:
Atek et al.
2023.
Revealing
galaxy
candidates out
to z ~
16 with JWST
observations
of the lensing
cluster SMACS
0723. MNRAS
519
(1), 1201. https://doi.org/10.1093/mnras/stac3144.
This paper is
also rich with
data and
implications
on high
redshift
galactic
objects.
We will next
consider the
data in Atek et
al.
(2022). They
produced this
wonderful
spectral image
of the 6
wavelength
bands
accessible to
the JWST:
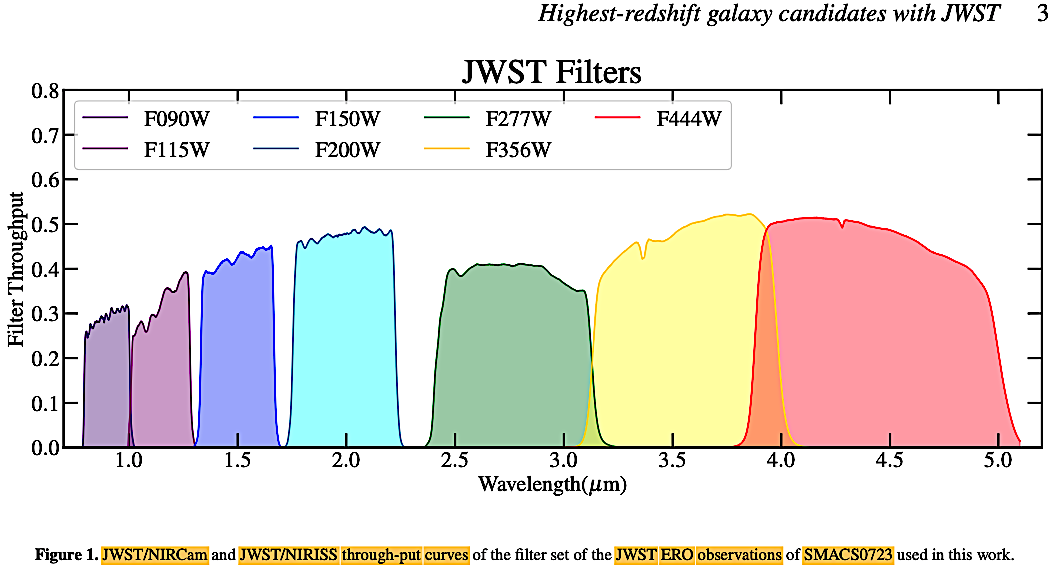
Atek et al. (2022).
Atek and colleagues were explicit about the ΛCDM
cosmology parameters which they were working with H0
= 70 km s−1
Mpc−1, ΩΛ
= 0.7, and Ωm
= 0.3.
An
Excursus on the Tolman (1930, 1934) test
applied to GALEX & HUDF. Lerner
et al. (2014) cited
an old test for an 'expanding universe' hypothesis first
published by Tolman, R. C. 1930. On the estimation of
distances in a curved universe with a non-static line
element. PNAS 16, 511. https://www.pnas.org/doi/epdf/10.1073/pnas.16.7.511,
(developed in Tolman, 1934. Relativity, Thermodynamics,
and Cosmology. Oxford, UK: Oxford University Press)
which showed that the bolometric surface brightness (i.e.,
erg sec-1 cm-2 arcsec-2) as
a function of redshift z for identical extragalactic
sources is independent of whichever expanding model
parameters are used. This means that the Tolman test can
distinguish between expanding and non-expanding universes
thus: In (a) any expanding model the surface brightness
luminosity dims proportional to (1+z)-4,
whereas in (b) any non-expanding model, the surface
brightness luminosity dims as (1+z). When the
astronomical AB magnitude system or VEGA magnitutes are
used, the comparable source surface brightness in flux per
redshift are expected to be constant. For the non-expanding
Universe hypothesis, Lerner et al. (2014) did not
use the Einstein-de Sitter static Universe as did other
workers before, but rather a non-expanding / static
Euclidean Universe (SEU) with a z-distance (H0)
relation not expansion-generated. For near UV low-z
galaxies, the NASA GALEX mission data were used (https://www.nasa.gov/missions/deepspace/galex_mission.html)
and for the UV surface brightness high-z galaxies,
the NASA Hubble Space Telescope HUDF data (https://svs.gsfc.nasa.gov/30946)
were used.
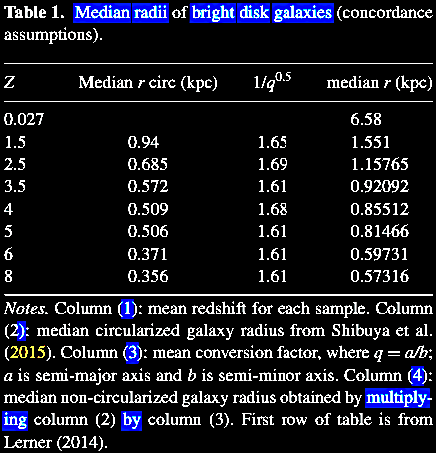
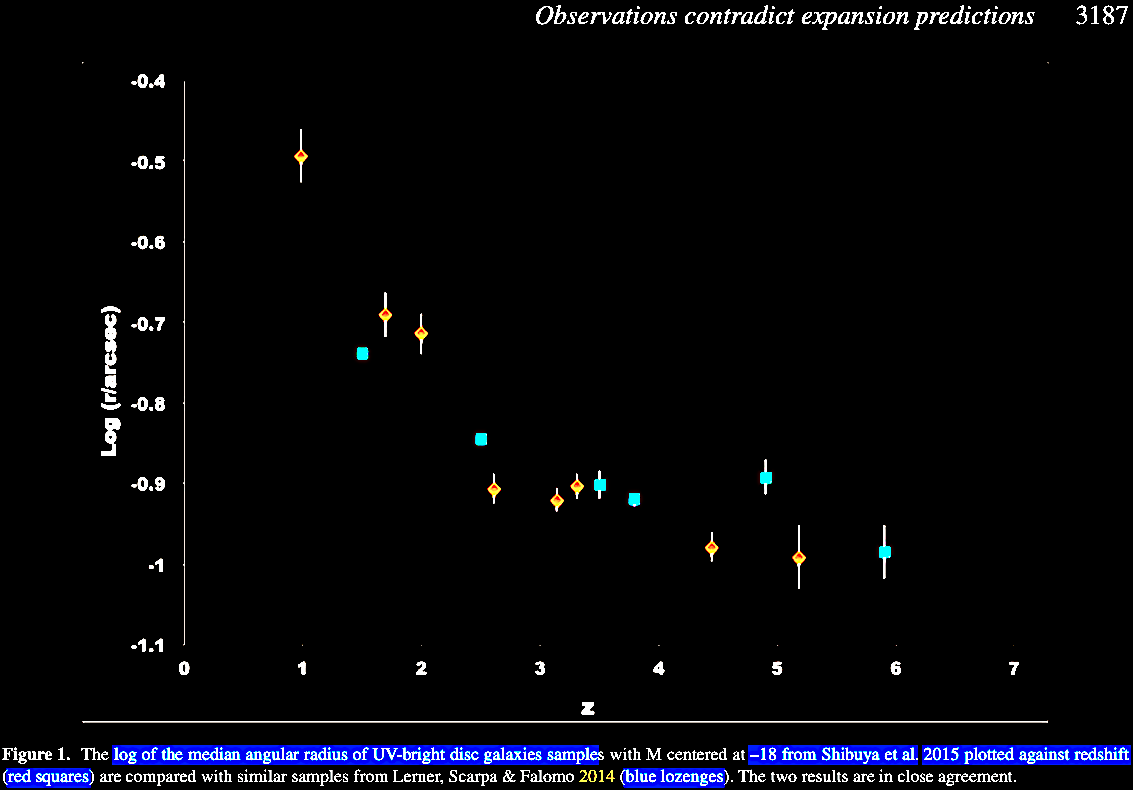
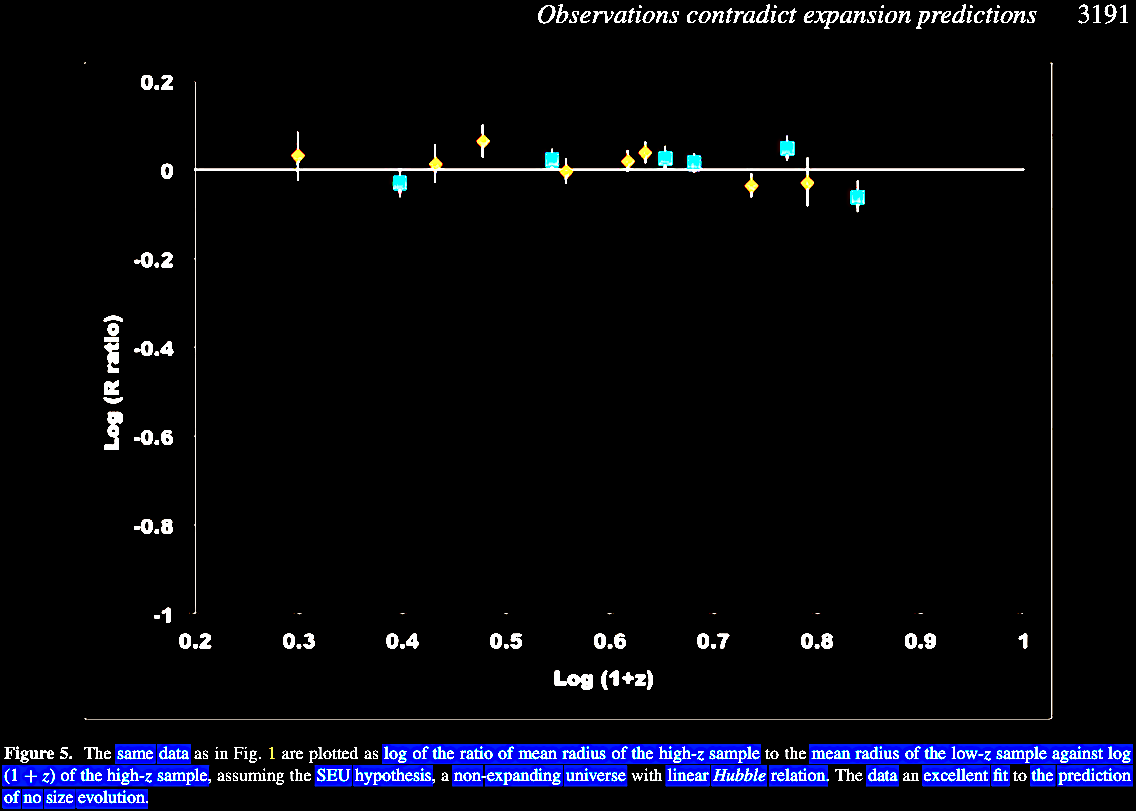
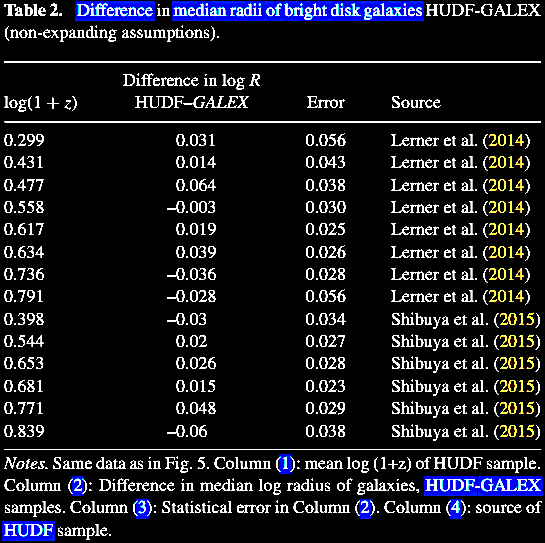
Lerner et al. (2014).
Lerner et
al. (2014).
In short, Lerner et al. (2014) showed that,
based on the GALEX and HST data, the surface luminosity
of both low and high redshift galaxies exhibit that our
observable Universe exhibits Euclidean and steady state
properties.
In August of 2017, Lerner submitted another paper (https://arxiv.org/abs/1803.08382)
which was published, again with the data available pre-JWST:
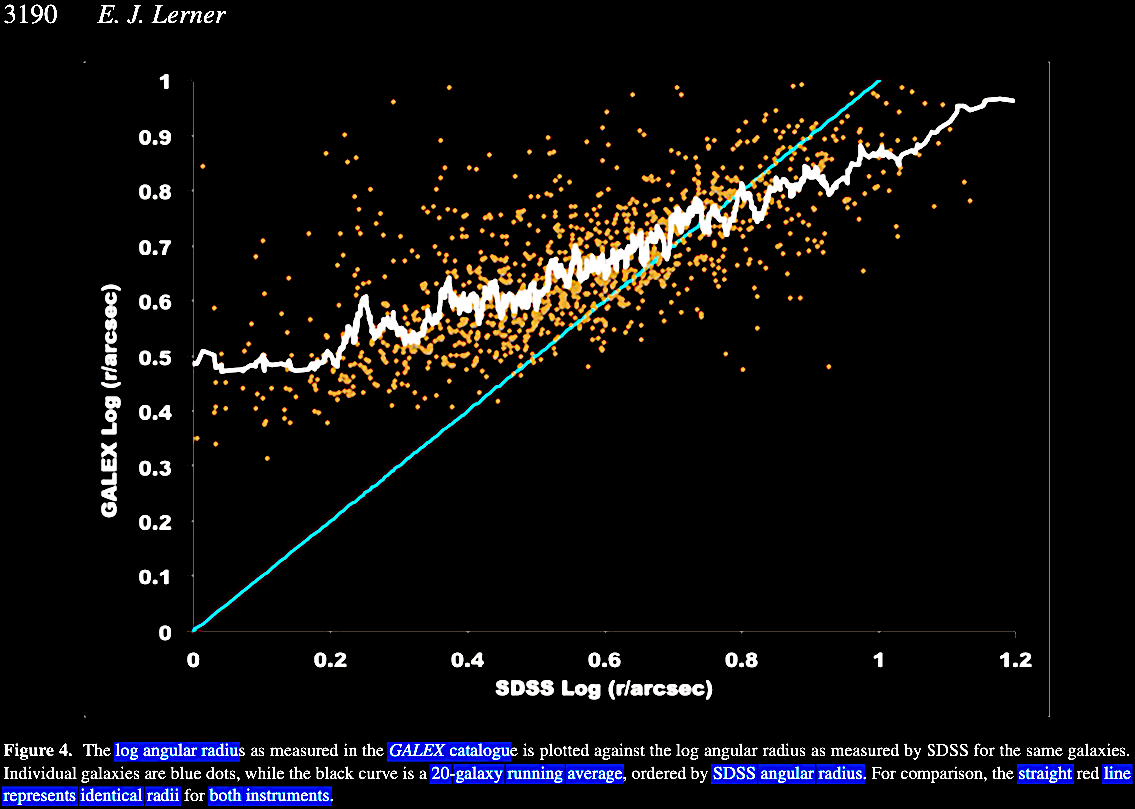
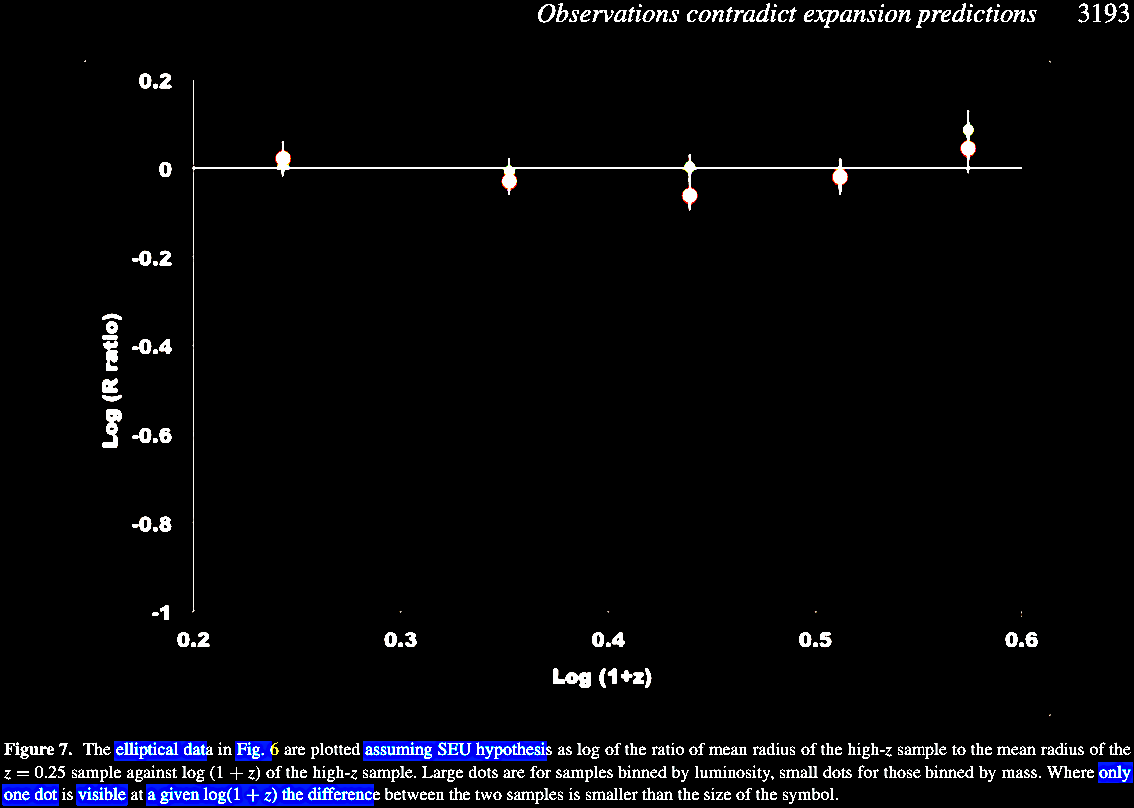
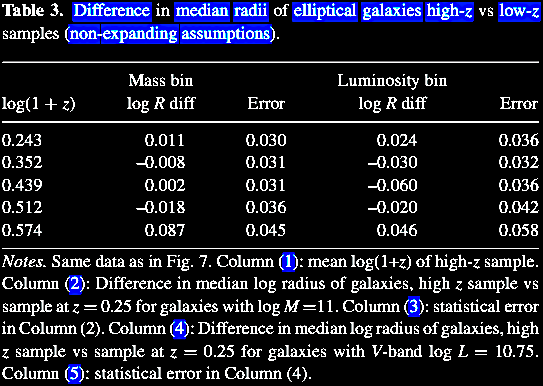
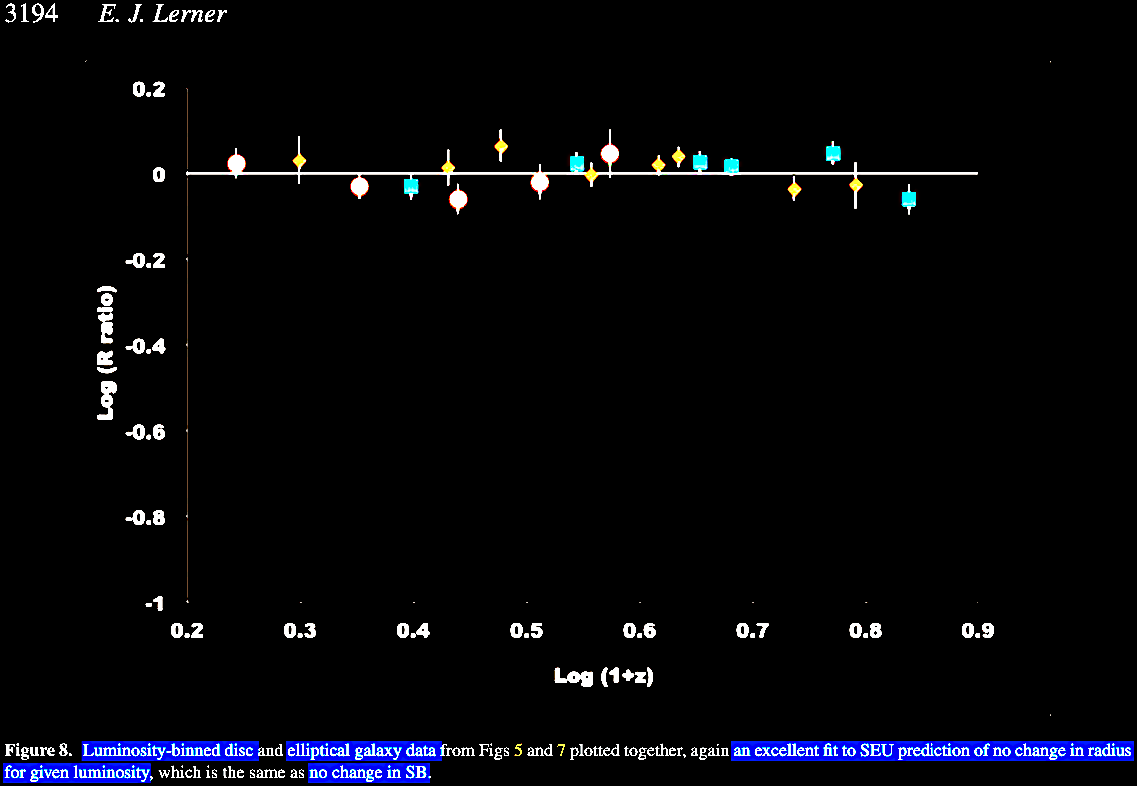
Lerner, E. J. 2018. Observations contradict galaxy size and
surface brightness predictions that are based on the
expanding universe hypothesis. MNRAS 477
(3), 3185. https://doi.org/10.1093/mnras/sty728.
Starting with the Tolman (1930, 1934) test which predicts
that in an expanding cosmos, the galactic / object surface
brightness (SB) is expected to decline rapidly with redshift
z in proportion to (1 + z)-3,
where SBs are measured in AB magnitudes, Lerner tested
whether the disk and elliptical galactic radii evolve as
predicted in expanding cosmos models. Just as Lerner et
al. (2014) had shown that the SB / luminosity data was
compatible with a static, Euclidean universe (SEU), Lerner
(2018) tested to see if an expanding universe model with
galaxy size evolution scenarios could produce the same fit
of results. He summarized how none of the so far published
models for galaxy growth make predictions fitting the data.
One of the sources of data is the Sloan Digital Sky Survey
(SDSS) / Skyserver: https://skyserver.sdss.org/dr7/en/.
In a non-expanding universe, SB is independent of z,
so for any galactic luminosity, disk radii should be
constant.
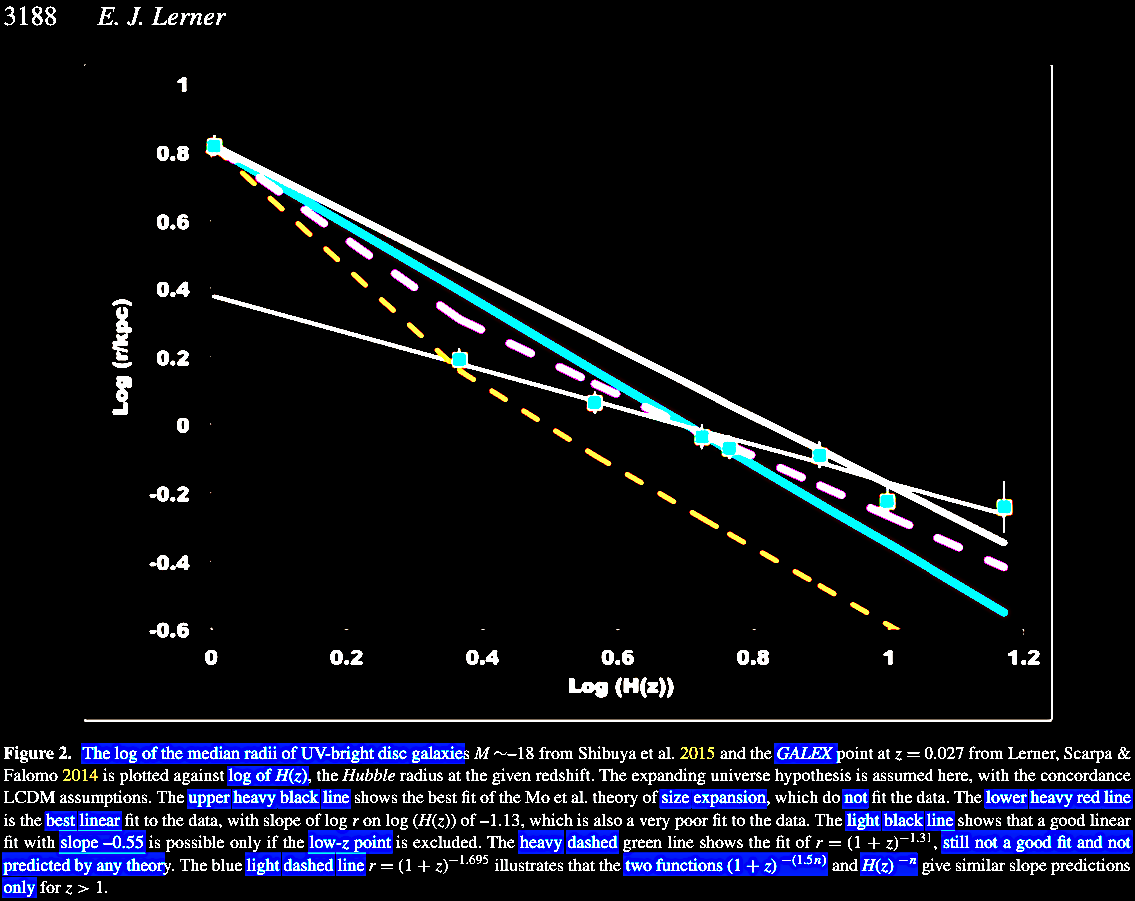
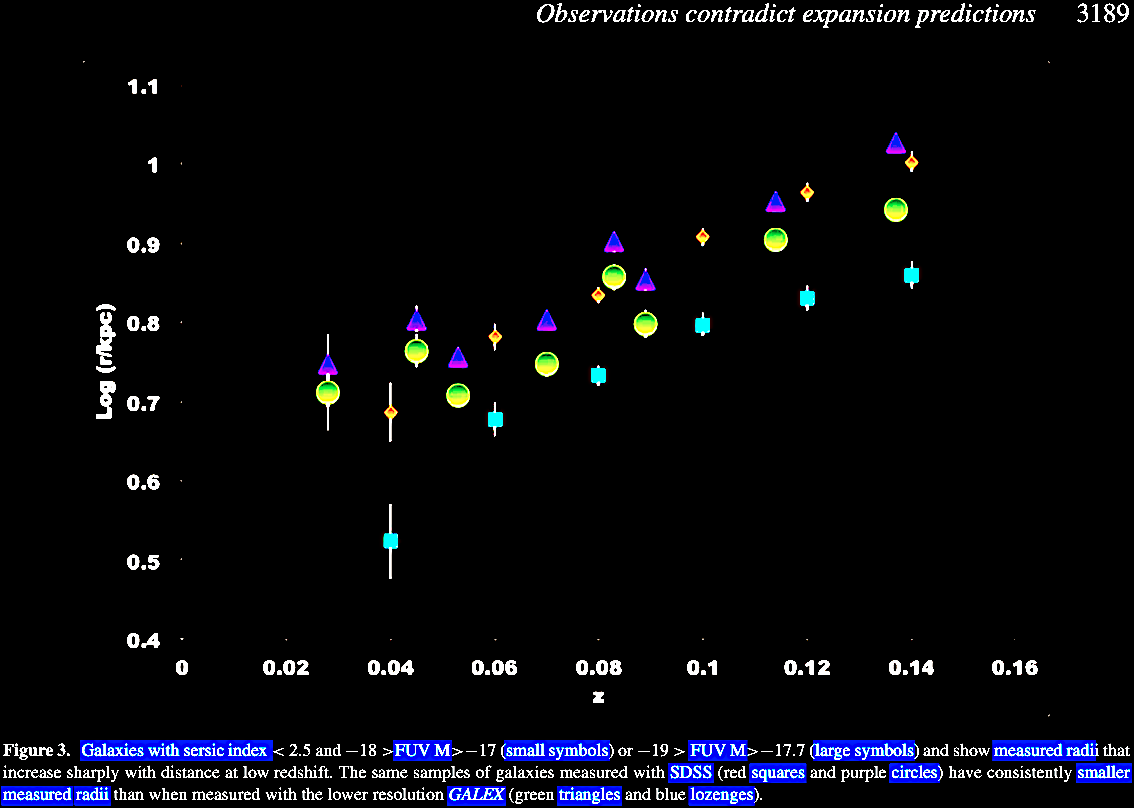
Lerner (2018).
|
|
|
|
|
|
|
|
|
|
|
Findings & Conclusions:
- None of the galaxy
growth models such as (a) the 'puffing up' scenario
from early quasi-stellar winds, (b) the 'major axis'
mergers, and (c) the 'minor axis' mergers, can
account for why these data sets do not fit the
expanding cosmos models, other than its just by a
sheer and massive coincidence.
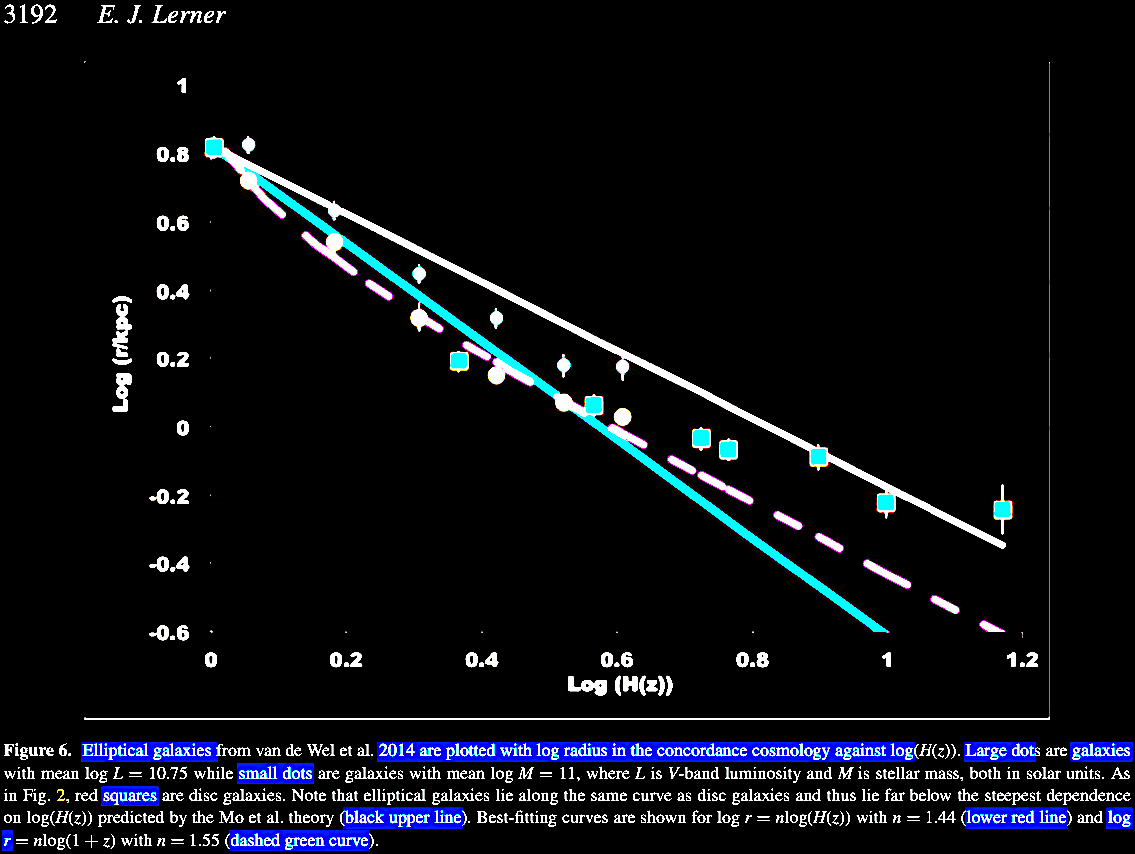
- However, the
predictions of the SEU are met in that disk &
elliptic galaxy radii are z-independent.
- The SEU does not
venture an explanatory mechanism for the linear z-distance
relation within a non-expanding Euclidean Universe.
- These conclusions apply
only to the z-radial size relation.
- These data are
empirically consistent to great statistical
strengths with an SEU, and robustly inconsistent
with any standard expanding cosmos scenarios.
|
| In
terms of cosmology, a Euclidean Universe would exhibit
an angular-size / redshift relation such that θ = l
/ d, where θ = angular size in
milliarcseconds (mas), l = linear size l,
and d = distance from Earth.
|
Once an expanding Universe is
introduced, then the distance from Earth becomes a
function of redshift such that, d = (c/H0)
{q0z + (q0
- 1)[(1 + 2q0z)1/2
- 1]} / [q02(1
+ z)2], where q0 =
(4πG
ρ
/ 3) / H02 is the
deceleration parameter derived in an equation of
standard cosmology (link).
- In order to achieve this with a negative
q0
deceleration parameter such as q0
= –1, one should either turn to a Euclidean
non-expanding Universe, or conjure up all of the
epicycles and invisible entities of the standard
ΛCDM concordance cosmology, which still does not
reconcile the data.
- The only expanding universe cosmological
approach that even comes close to the actual data
discussed here, minus a multitude of epicycles and
adjustable parameters, are the classic steady
state cosmologies (CSSC, or a variant of the same)
which directly predict a q0
= –1, as discussed in chapter III, "The Hubble
Relation and the expanding Universe: 'The
War of the World-Views'." However, one
does not need the CSSC or variant either. It
is critical to note that the Hoyle-Narlikar
Machian theory (Hoyle & Narlikar, 1962,
1964a-e, 1966, and 1974, &c.) need not
have the constraints of either the HBBC, the
CSSC, or the QSSC, but simply may be Euclidean
in a steady-state or episodic steady-state
exhibiting the
Ambartsumian-Vorontsov-Vel'yaminov-Arp (AVVA)
cosmogony with redshift periodicities (see chapter
IX), and still be in harmony with these
data and observations cited in this Lerner
(2018) paper.
- Another factor in all
of these data sets and their implications are
the limits of resolution of the telescope /
observatory utilized.
- Additional data sets
from the JWST can take us farther than the
HDF, the SDSS, and the GALEX data sets.
Prediction:
Even the JWST will have similar resolution
limitations which will still not bring us to a
beginning, especially if we indeed live in an
eternal Universe. |
Lerner (2018).
25 July 2022 (Thursday)
released.
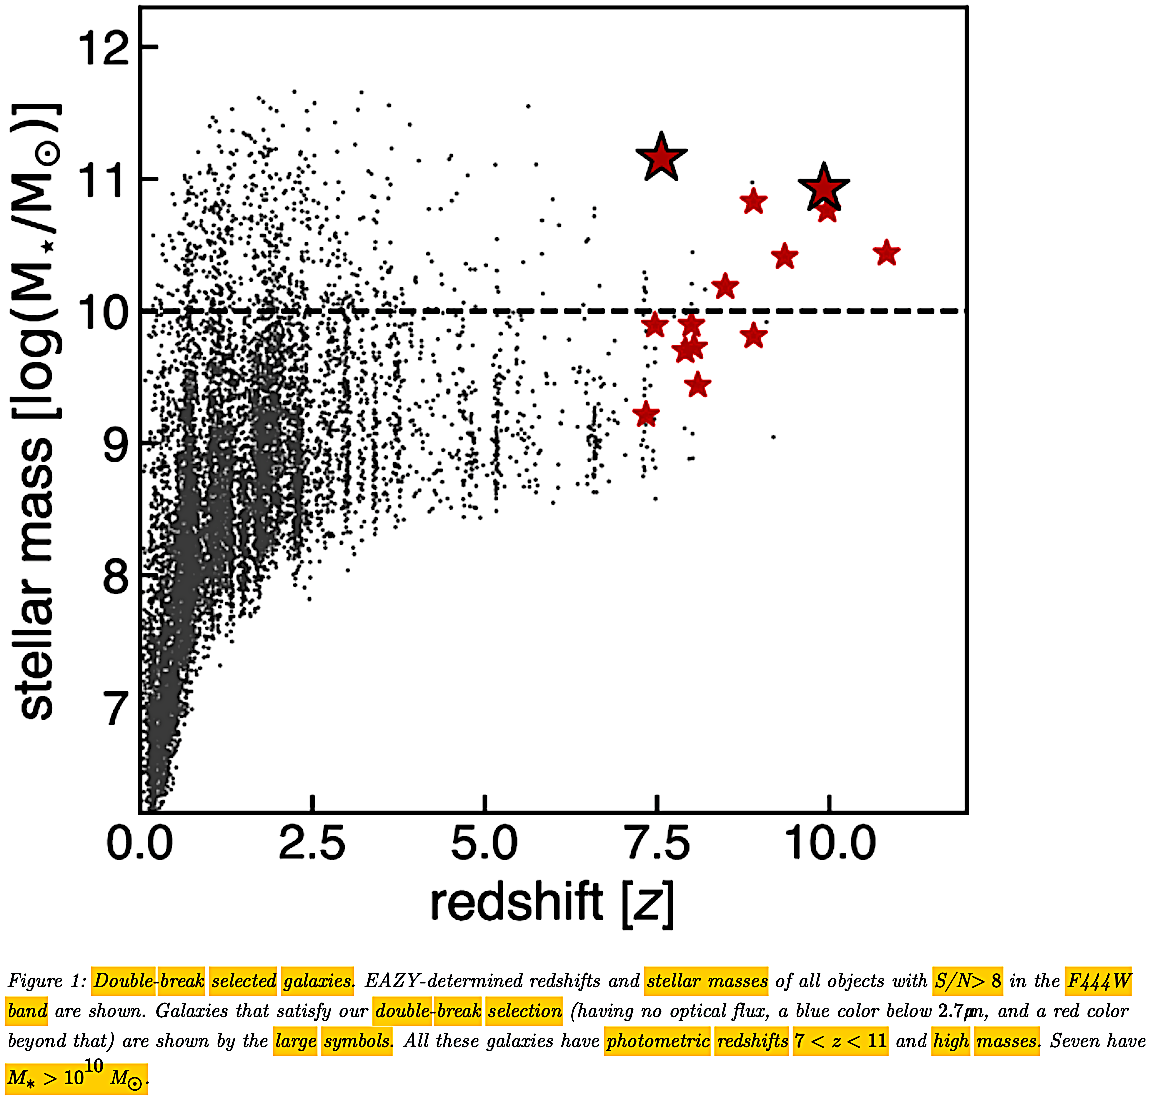
Labbé et al. (2022) released a paper under the
title, A very early onset of massive galaxy formation (https://arxiv.org/abs/2207.12446;
also at https://www.arxiv-vanity.com/papers/2207.12446/)
which was eventually published (2023) as, A population of
red candidate massive galaxies ~600 Myr after the Big Bang.
Nature 616, 266. https://doi.org/10.1038/s41586-023-05786-2.
It is exceedingly interesting and illuminating both the peer
reviewers' comments and the often contrite author responses,
gently acknowledging the instrumental limitations and yet
arguing for the publication-worthiness of their data results
and analyses in Nature (https://static-content.springer.com/esm/).
They acknowledge how their results depart from the more
conservative UV luminosity studies they cite, including ones
above, and exhibit an acknowledged tension with the confines
of the ΛCDM. Yet, they argue, their own redshift and mass to
light (M-L) estimates are based on also published models and
data analysis pipelines using photometric redshift and
fiducial (standard reference point) mass extrapolations, so
they express confidence in the more full and broad coverage
in the color detection bins of the JWST. Fortunately, their
data has been published, even despite reviewer reluctance.
Since Rocca-Volmerange et al. (2022) submitted a
manuscript in December of 2018, Lyman and Balmer breaks
reveal mature z = 8 galaxies (equivalent to 13.067
Gya look-back time, supposedly 0.646 Gyr post-BB) with
the code Pegase.3. https://arxiv.org/abs/1812.04283,
along with their ages, star formation history (SFH), and
their masses in solar units using evolutionary code modeling
dust and metallicity damping of the UV signal, using data
from the HST and the Spitzer / IRAC as well as Monte Carlo
simulation data, and data from libraries of spectral energy
distributions (SEDs). This helped provide a test would be to
find higher redshift galaxies with discernible Lyman and
Balmer breaks in the then future, next generation JWST data.
Here is their data and analysis summarized before we turn
again to Labbé et al. (2022).
Let's look at what they
found keeping in mind the model and instrumentation
uncertainties. They found 13 galaxies with a Lyman break (λrest
= 1216 Angstroms. Å
) and a Balmer break (λrest ~ 3600 Angstroms, Å
), at photometric redshifts
of 6.5 < z < 9.1, equivalent to look-back times of 12.872 Gya (supposedly
0.850 Gyr
post-BB) to 13.179 Gya (supposedly
0.543
Gyr post-BB). The first image from the preprint was
represented thus.
What is so troublesome
about fitting in these data is that such are not expected
nor predicted within the limits of the ΛCDM Big Bang, and
yet there they are, even in the model-laden analyses.
Without the limitations of the ΛCDM Big Bang, these data are
well-accommodated within what is known about our Universe.
The prediction continues to be borne out: At the farthest
limits of resolution of our best instruments, galaxies of
varying ages and masses continue to appear, just as expected
if the Universe is indefinitely or infinitely old.
Also on 25 July 2022 (Thursday) another bombshell paper
dropped by Donnan et al. (https://arxiv.org/abs/2207.12356)
which was eventually published on 21 November of 2022:
Donnan, C. T. et al. 2022. The evolution of the
galaxy UV luminosity function at redshifts z ≃ 8 -
15 from deep JWST and ground-based near-infrared imaging. MNRAS
518 (4), 6011. https://doi.org/10.1093/mnras/stac3472.
These are staggering look-back times according to the
calculations: z ~ 8 is equivalent to 13.076 Gya (supposedly
0.646 Gyr
post-BB) and z ~ 15 is equivalent to 13.450 Gya (supposedly
0.272 Gyr
post-BB). The authors even found a distant CEERs galaxy with
a
<i>The evolution of the galaxy UV luminosity
function at redshifts  – 
from deep JWST and ground-based near-infrared
imaging</i>
z ≃ 16.4 which is equivalent to a 13.482 Gya look-back
time (supposedly only 0.240 Gyr post-BB).
Their data combined COSMOS field ground-based data with the
very deep JWST data. Here are some figures representing this
astonishing data set. The spectral energy distributions
(SED), the UV luminosity function (LF), and the stellar
populations with no primordial Population III stars
(BB-model star populations with only hydrogen), and smaller
galaxies expected in a non-expanding Universe all come
together in this study.
SED = spectral energy distribution, in this case of
4 chosen representative high redshift galaxies.
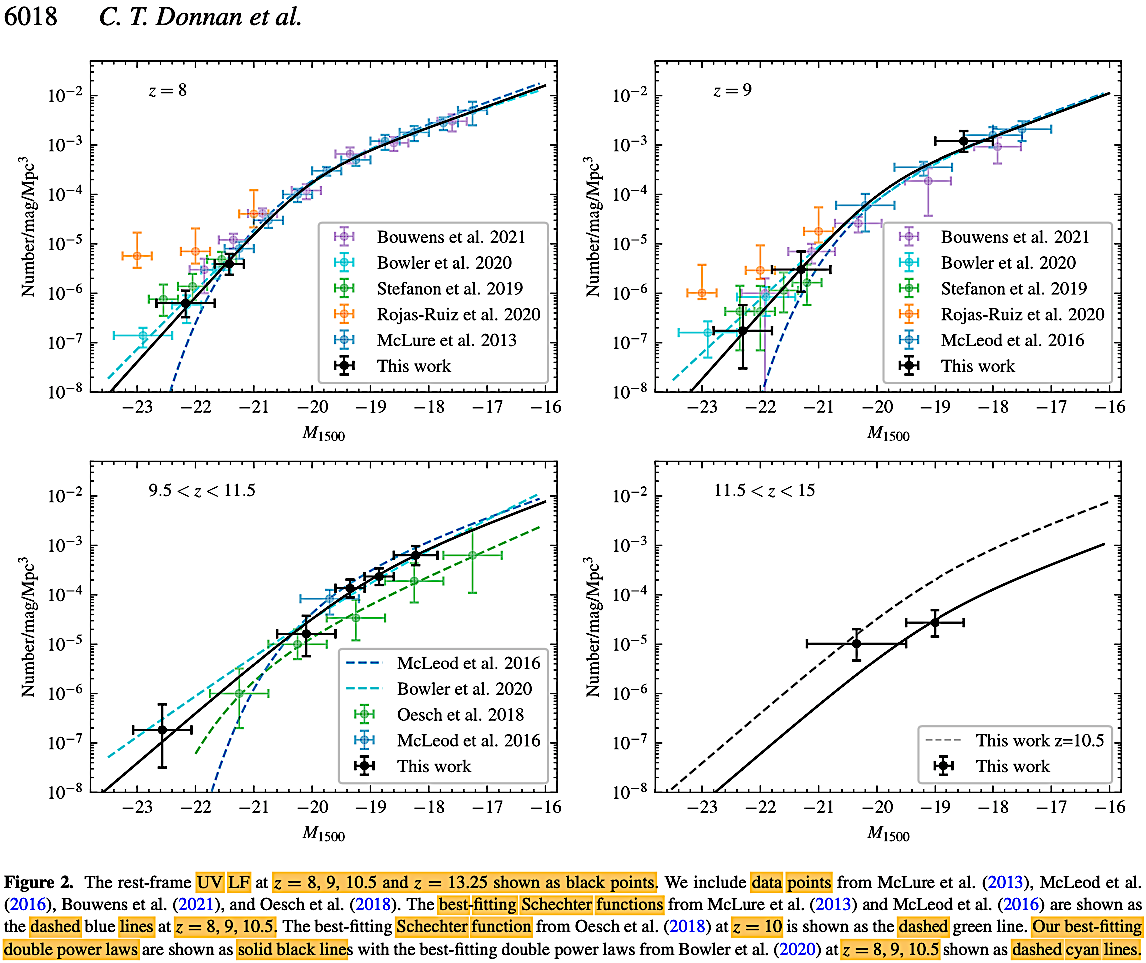 The UV LF refers to the UV luminosity function.
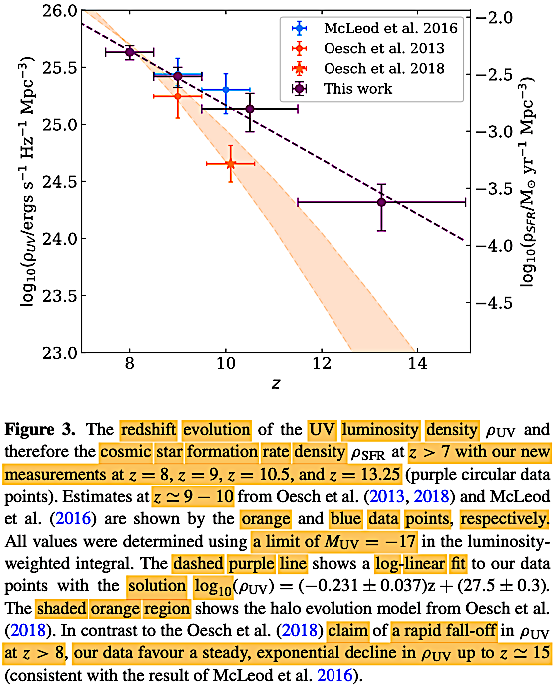
Contrary to the claims of Oesch et al. (2018), the
so-called 'halo evolution model' (related to the star formation
rate) did not drop off, but 'followed a steady, exponential
decline,' as expected we might say, in an eternal Universe.
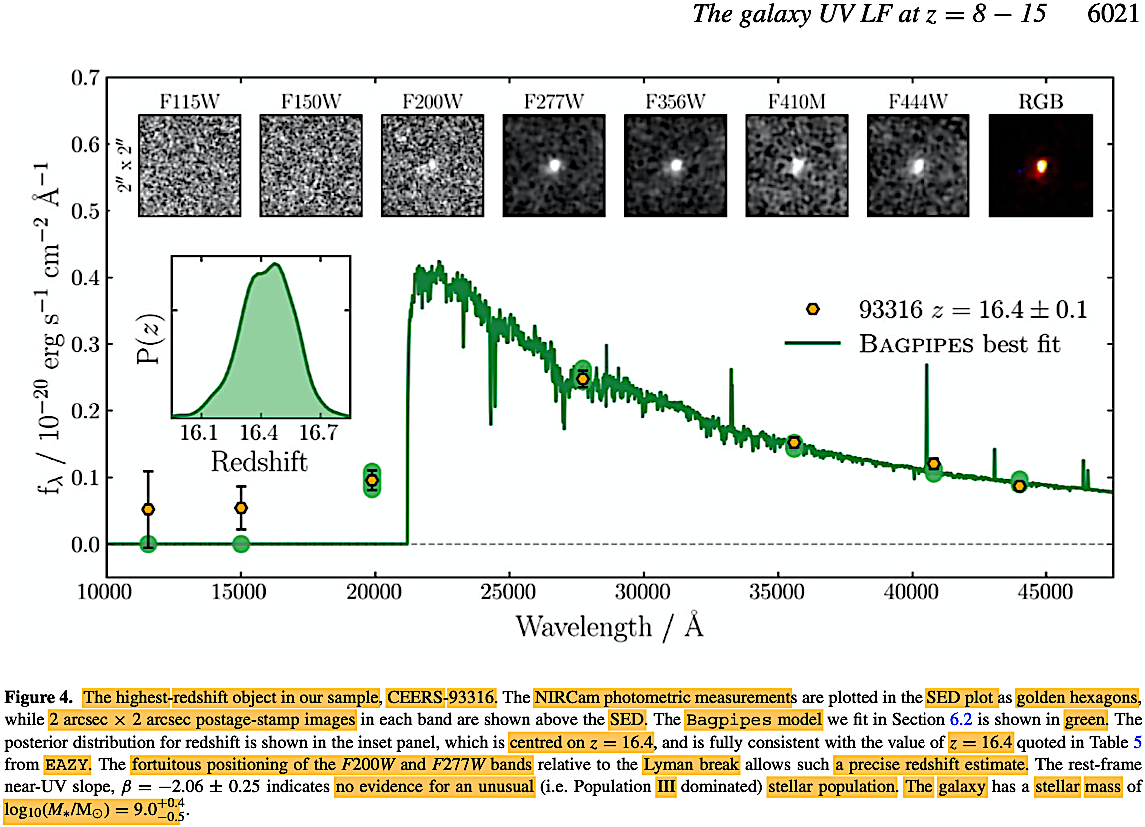
Even the highest redshift galaxy in this study, CEERS-93316,
followed a SED of a normal galaxy, and there were no primordial
Population III stars found.
In order to maintain the expanding cosmos illusion, this
galaxy had to be a fraction of the size of our Milky Way
galaxy, impossibly dense. This paper on multiple points did
not yield data in harmony with the Big Bang predictions.
Metallicity in high redshift objects. Below is
a galaxy which JWST found with a look-back time of 13.1 Gya
in the SMACs Abell Cluster so-called gravitationally-lensed
background. This galaxy has a redshift of z ~8.7 or
a look-back time of
13.145 Gya (supposedly
0.577 Gyr post-BB), and yet, the galaxy shows high
metallicity in its emission spectrum.
An excellent comparative resource is the "Table of Galaxy
Emission lines from 700A to 11,000A" (link)
summarized by
Drew Chojnowski (link).
These emission spectral lines emerge from various ionization
processes which have been
historically observed in galaxies, AGNs, and QSOs (along with their
quantum orbital configurations and other tabulated details,
including the astronomers' references for observation),
about which he wisely states,"
This page does not theorize on lines that could
or should be observed in such
objects - only lines that have been
observed are listed" (italic emphasis his). In
so doing, he takes a cosmology-model neutral and actualist
empirical position. The atomic spectral data are sourced
from the National Institute of Standards and Technology
(NIST) Atomic Spectra Database: Kramida, A., Ralchenko, Yu.,
Reader, J. and NIST
ASD Team (2022). NIST Atomic Spectra Database (version
5.10), [Online]. Available: https://physics.nist.gov/asd
[Tue Jun 06 2023]. National Institute of Standards and
Technology, Gaithersburg, MD. DOI: https://doi.org/10.18434/T4W30F.
30 October
2022 (Sunday) released.
In another major surprise of a galaxy with
unexpected metallicity, Bo Peng and colleagues
dropped a paper (https://arxiv.org/abs/2210.16968)
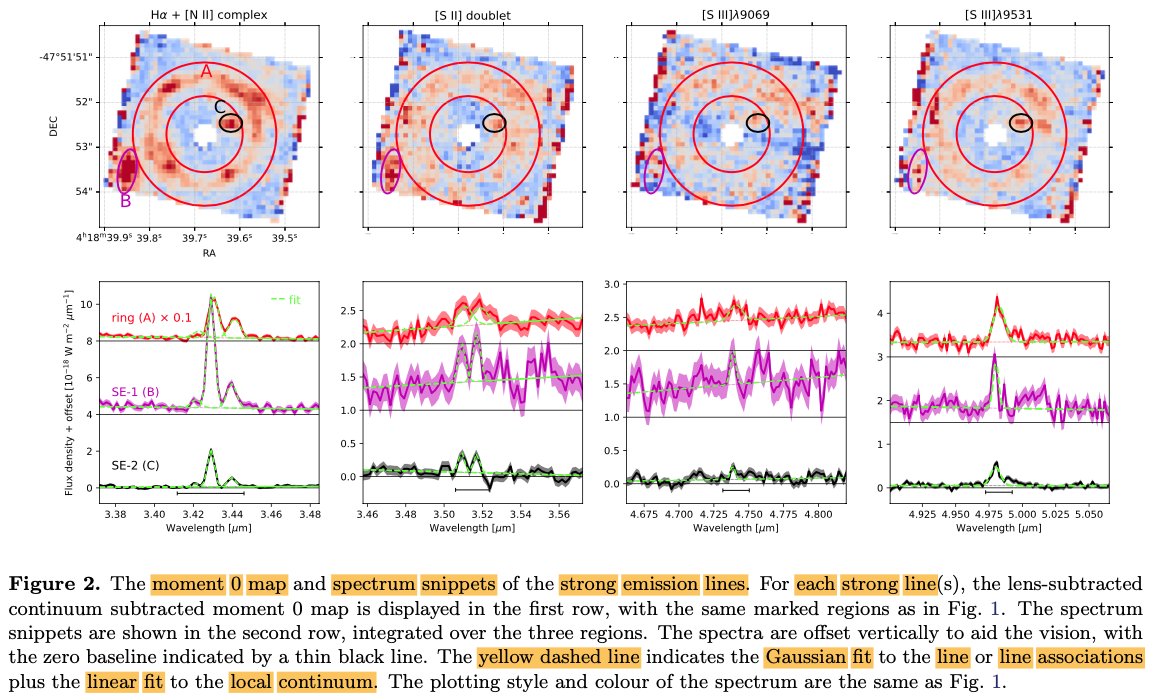
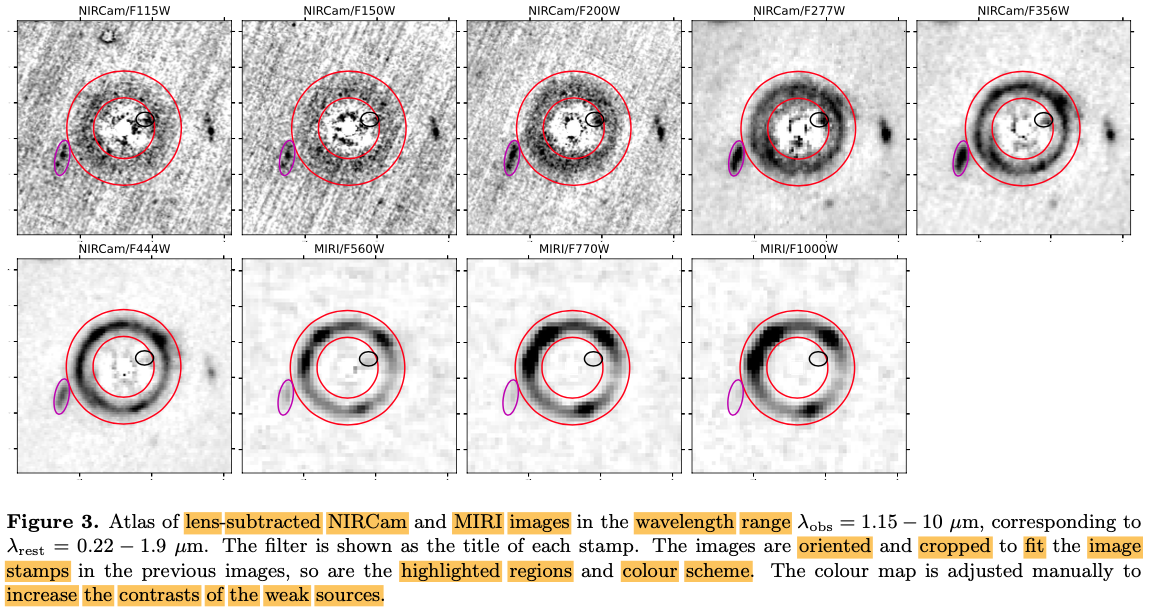
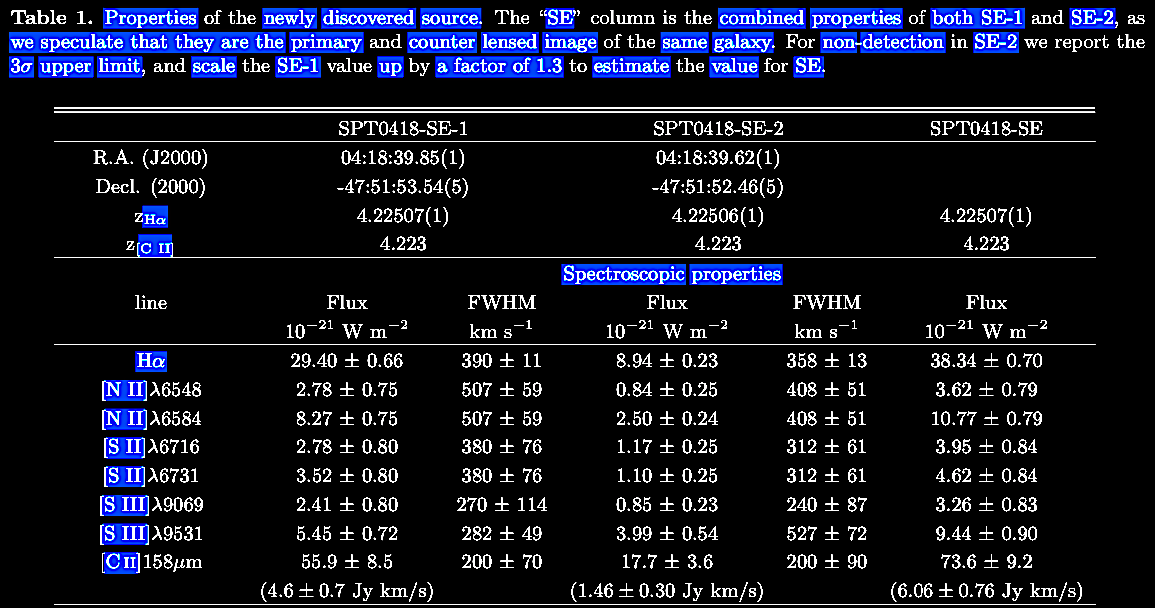
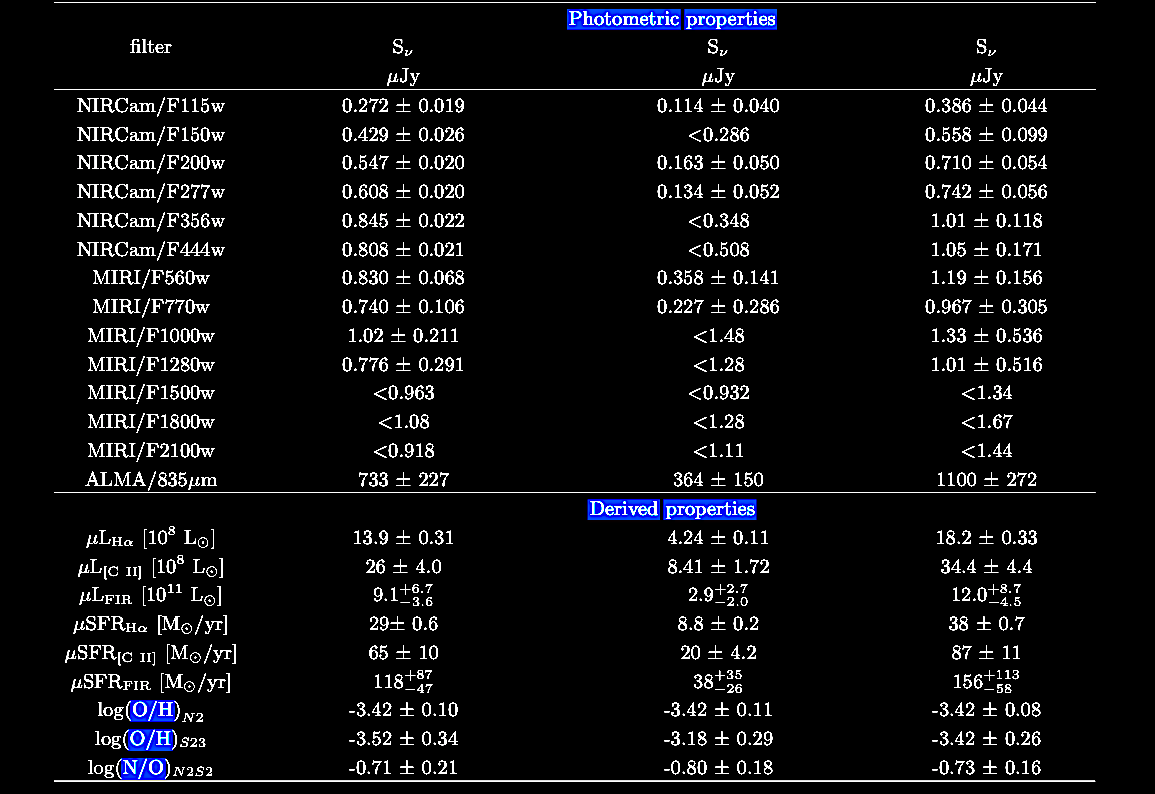
Peng et al. 2023. Discovery of a dusty,
chemically mature companion to a z∼4 starburst
galaxy in JWST ERS data. ApJ Letters 944
(2), L36. https://doi.org/10.3847/2041-8213/acb59c,
which both show evidence of unpredicted high
metallicity. What they found
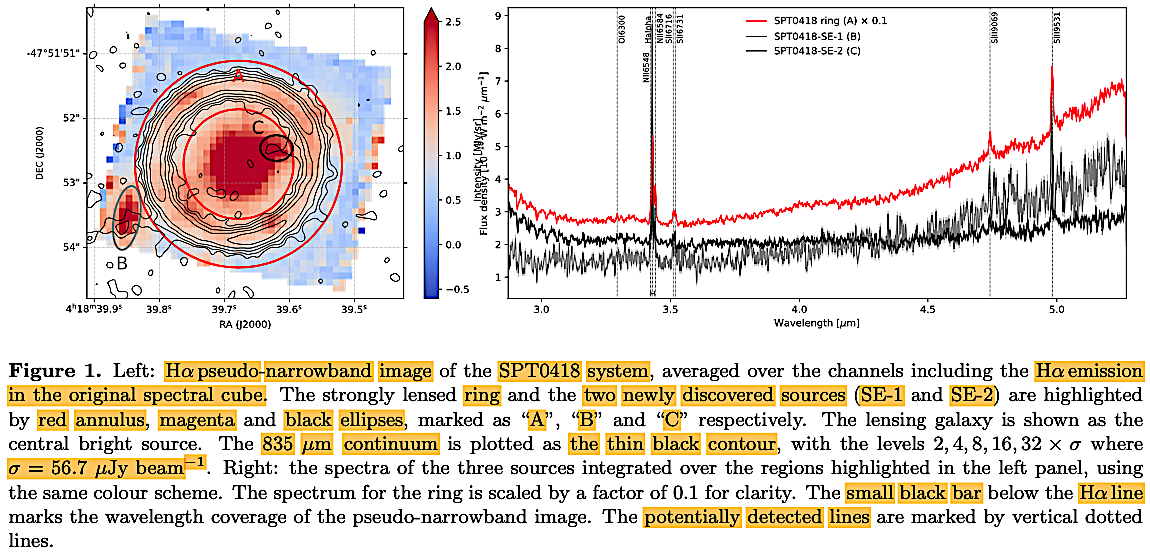
is summarized thus with comments:
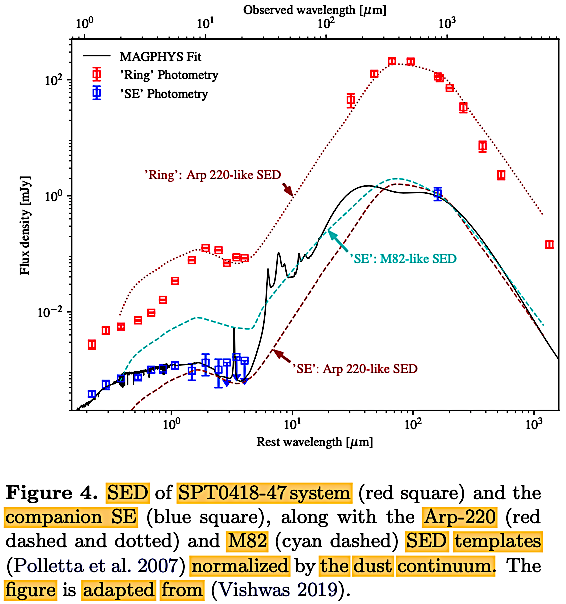
- A
gravitationally-lensed starburst galaxy, SPT0418-47,
with one (lensed) companion, SPT0418-SE, both at
z = 4.225,
equivalent to a look-back time
of 12.262 Gya (supposedly
1.459 Gyr post-BB)
- The authors infer a
SFR minimum of 17 M⊙
yr-1 from the CII
emission line and the dust
continuum, but estimate an SFRHα
is estimated to be >2 times
lower confirming that SPT0418-SE,
a star-birthing
galaxy is being
obscured by dust.
- Optical
strong
emission line
diagnostics
suggest that
SPT0418-SE has
near solar
elemental
abundances
(when the Sun
is ~4.6
Gya).
- The 'ring' the authors
say has a super-solar
metallicity in its O/H and N/O
ratios, implying a >solar
age.
- To reconcile observed
metallicity with the supposed
young age of the system post-BB,
the authors respond by "invoking
early onset of star formation
with continuous high star
forming efficiency" (some
serious arm-waving) "or that
optical strong line diagnostics
need revision at high redshift"
(another seeming grasping at
straws). For some reason, the
primary data is not to be taken
seriously.
- Grabbing another
epicycle from their HBBC ΛCDM
pouch, the authors gratuitously
hypothesize: "We suggest that
SPT0418-47 resides in a massive
dark matter halo with yet to be
discovered neighbors." William
of Occam would be disappointed
in such ad hoc special
pleading. This kind of epicyclic
speculation is needed only
because of the New Ptolemaic
paradigm.
Implications.
Now, lets get down to the serious data and their
implications. Nearly solar elemental abundances and
super-solar metallicity imply stellar ages
approaching the Sun's and older than the Sun,
including the prior generation of stars generating
the high metallicity, including the dust
obscuration. According to the HBBC ΛCDM
modeling, this
system cannot be
older than about
1.459 Gyr, and one
must subtract the
so-called "dark
ages" with the
putative CMB last
surface of
scattering date
(LOL) at
recombination at
370,000 yr post-BB
to ~1 Gya post-BB
with reionization,
so that gives 0.459
Gyr or 459 Myr to generate 2 generations of stars,
and all of that resulting metallicity, dust, and
galaxy companion(s) coalescing, including one with
an apparent defined disk shape. So what's our time
difference?
Well, how old is our Sun, not counting the previous
generation of stars, supernovae of which seeded the
elemental abundances in the solar proto-planetary
disk? Our Sun has a relativistically-corrected age
of 4.57 +/–
0.11 Gyr according to Bonanno, A., Schlattl,
H., Paterno, L. 2002. The age of the Sun and the
relativistic corrections in the EOS. Astronomy
and Astrophysics 390 (3), 1115. https://doi.org/10.1051/0004-6361:20020749.
This corroborates the independent radiometric dating
by U-corrected Pb-Pb dating of the first solids in
our Sun's protoplanetary disk: Transcient heating
events formed calcium-alluminum rich inclusions
(CAIs) within an interval of 4567.30 +/–
0.16 Myr, while chondrules range from 4567.32
+/–
0.42 Myr to 4564.71+/–
0.30 Myr, suggesting that the chondrule
formation started contemporaneously with CAI
formation, and lasted about ~3 Myr; Connelly et
al. 2012. The absolute chronology and thermal
processing of solids in the solar protoplanetary
disk. Science 338 (6107), 651. https://doi.org/10.1126/science.1226919.
Now we also have two independent stellar dating
methods, color-based isochrone fitting and
gyrochronology: Angus et al. 2019. Toward
precise stellar ages: Combining isochrone fitting
with empirical gyrochronology. Astron. J. 158
(5), 173. https://doi.org/10.3847/1538-3881/ab3c53.
Needless to point out, the stellar fusion used in
~4.57 Gyr plus the previous generation of stars will
not fit into 0.459 Gyr, nearly 10x less time. Nor
would anyone attempt to do so if it were not for HBBC ΛCDM
established model. Furthermore, we have an H0
relation-based look-back time of 12.262 Gya
plus our ~4.57 Gya
for solar and
super-solar
metallicity, or
let's modestly round
it up because of
supernova stellar
generation
inclusion, so that
we have 12.262 + ~5 Gyr which would be
> ~17.262
Gyr, not a
problem in an
indefinitely
old or eternal
Universe, but
quite
impossible in
the
epicycle-propped
HBBC.
 For comparison we see the Arp 220 and M82
systems:
For comparison we see the Arp 220 and M82
systems:
The Arp 220 System
 Arp 220 with its putative ejected
companions (see Chapter IX. Jets.html). Arp 220 with its putative ejected
companions (see Chapter IX. Jets.html).
|
The
M82 System
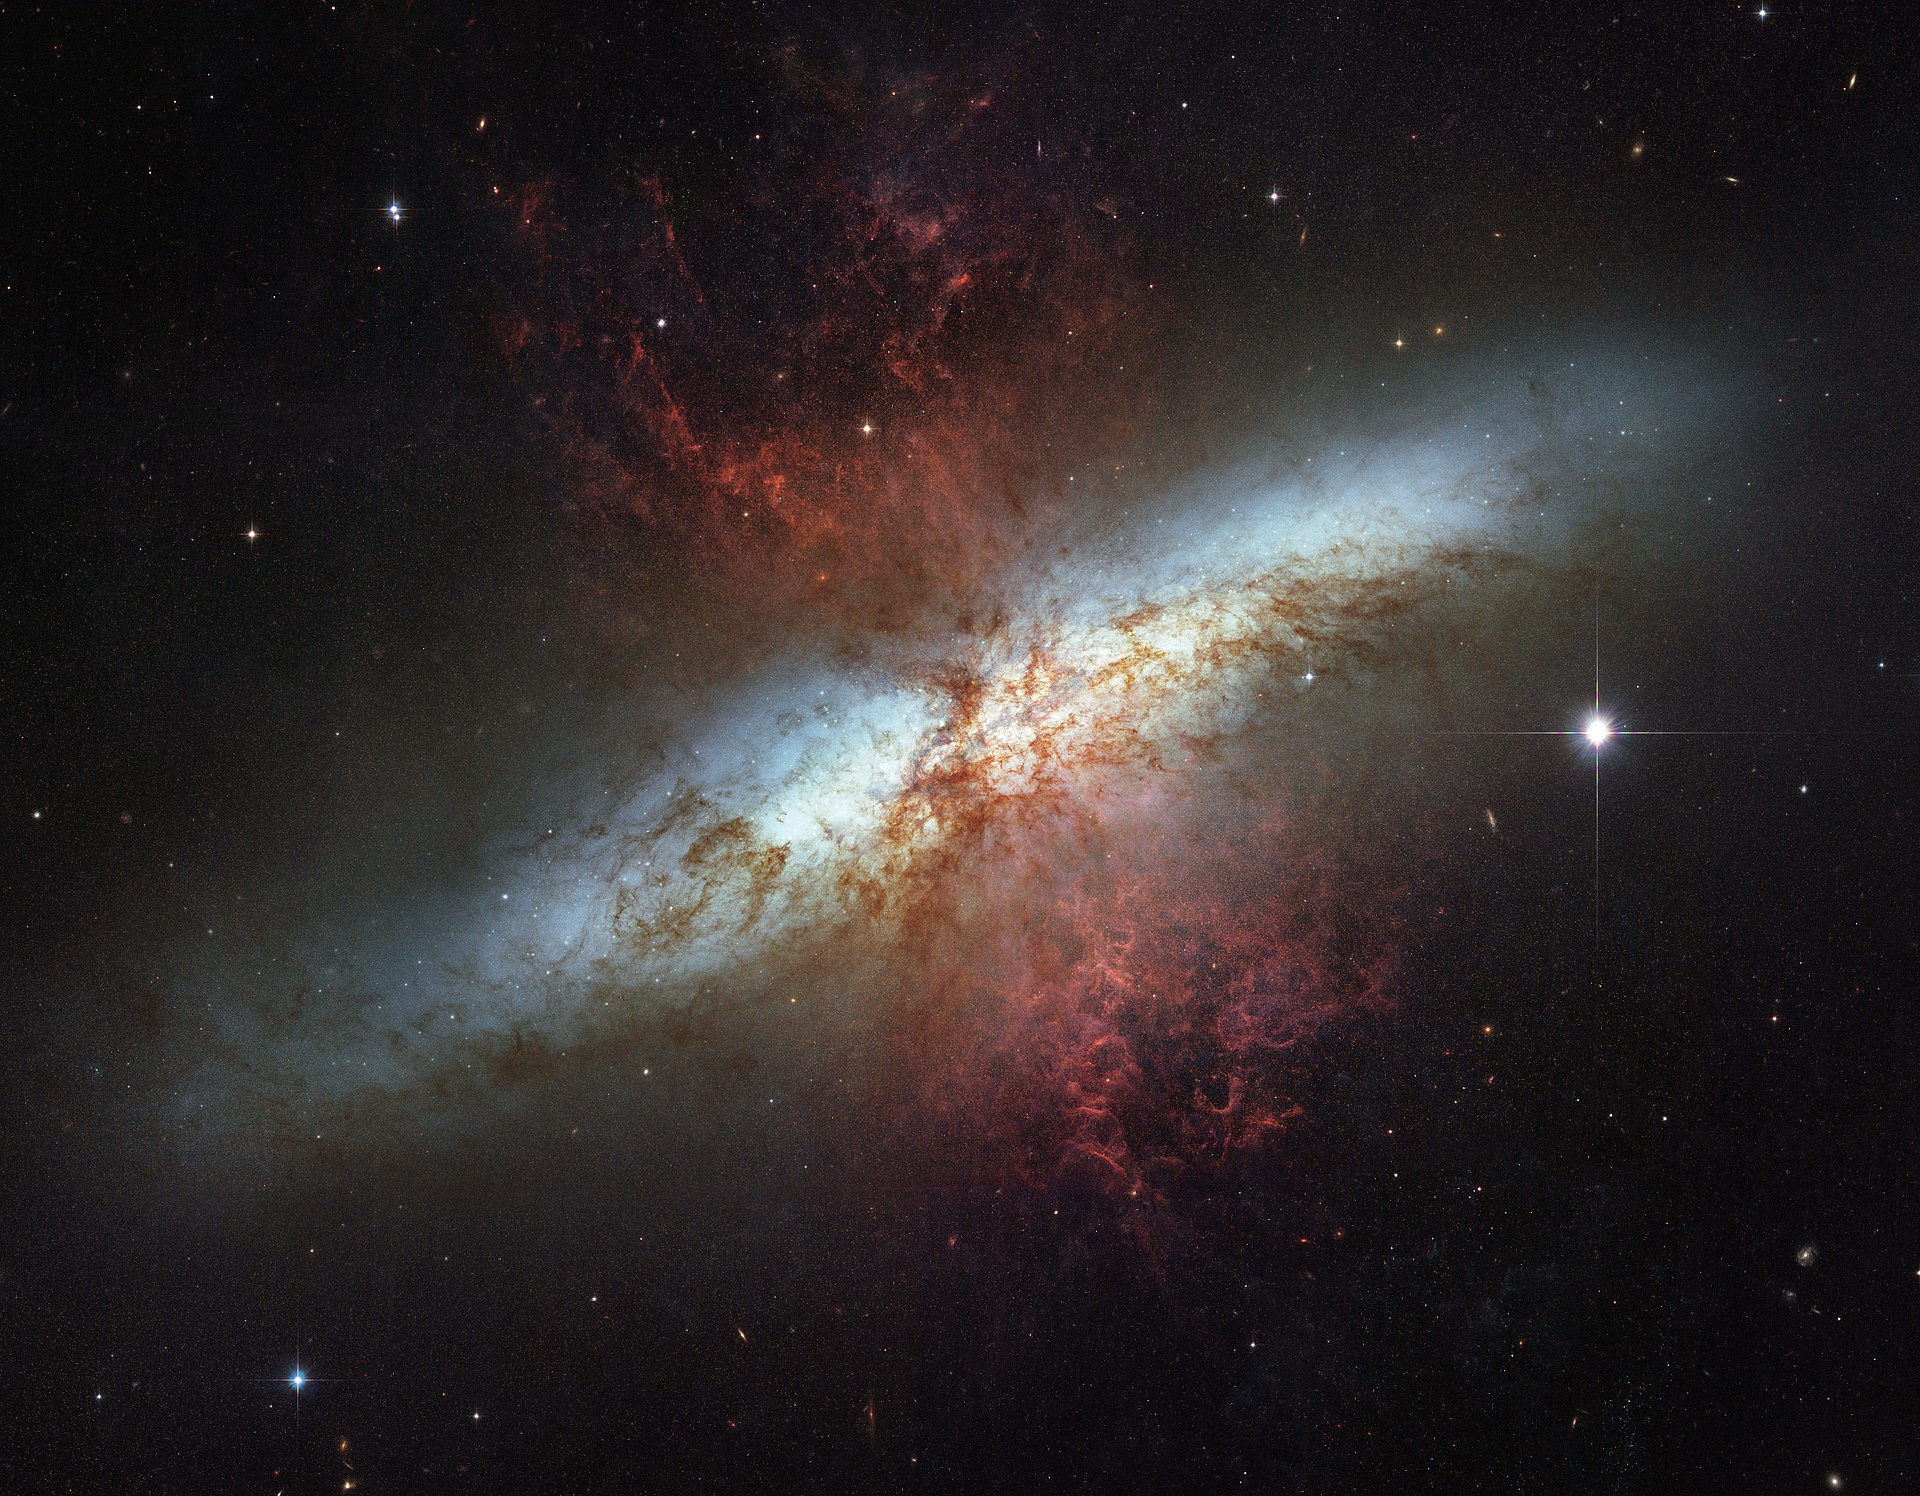
The M82 (link)
system has multiple putative ejected higher redshift
QSOs associated with it (see Chapter IX. Jets.html).
|
A final remark on this
fascinating paper relates to how the spectral energy
distributions (SEDs) of SPT0418-47, its
companion SPT0418-SE, and the 'ring' are
with the SEDs like the quite matured and
active galactic nucleated (AGN) Seyfert
galaxies Arp 220 (with about a trillion
stars) and the explosive M82. Although the
official HST and JWST websites don't mention
this, both of these galaxies are associated
with vast-scale explosive ejections of
compact high redshift objects (see chapter
IX).
01-11 December 2022 (Sunday) released
(published 01 Dec 2022 before arXiv
submission of 11 Dec 2022). In
December of 2022, a very important review
paper was published evaluating how the high-z
and deep sky JWST data can help test
cosmological models (both expanding and
'stationary') including predictions of the
ΛCDM HBBC, the Zwicky 'tired light'
cosmology, and the CSSC / QSSC (special
cases of the HN C-field
cosmologies): Lovyagin, N., Raikov, A.,
Yershov, V., & Lovyagin, Y. 2022. (11
Dec 2022 arXiv: https://arxiv.org/abs/2212.06575).
Cosmological model tests with JWST. Galaxies
10 (6), 108. https://doi.org/10.3390/galaxies10060108.
(In this, we will utilize the higher quality
figures from the arXiv version, which
actually is later than the journal
publication).
14
December 2022 (Wednesday)
released.
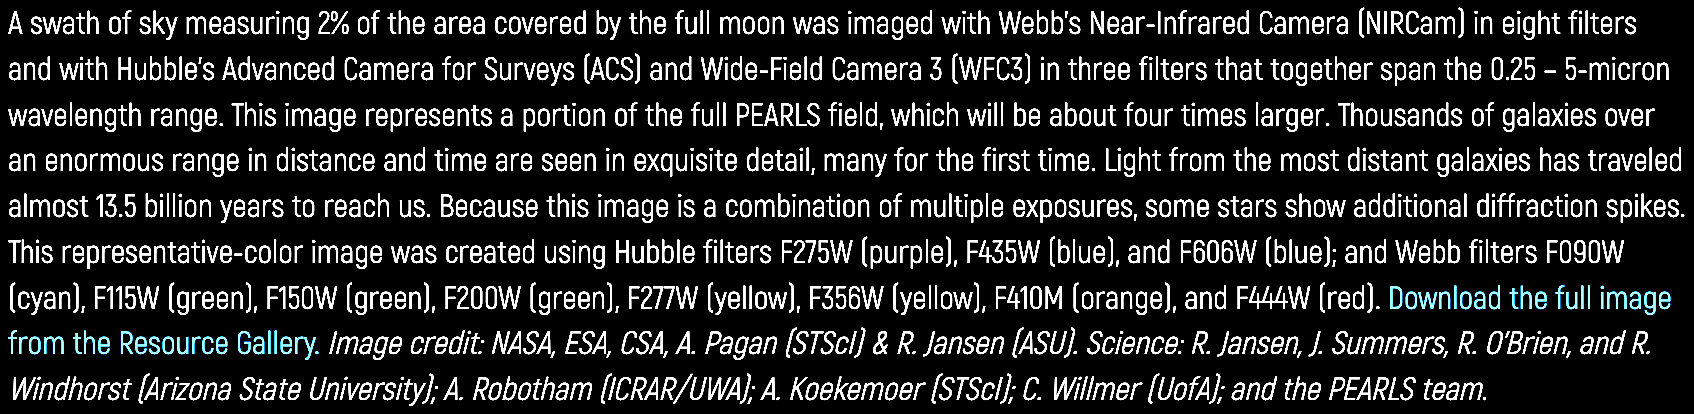
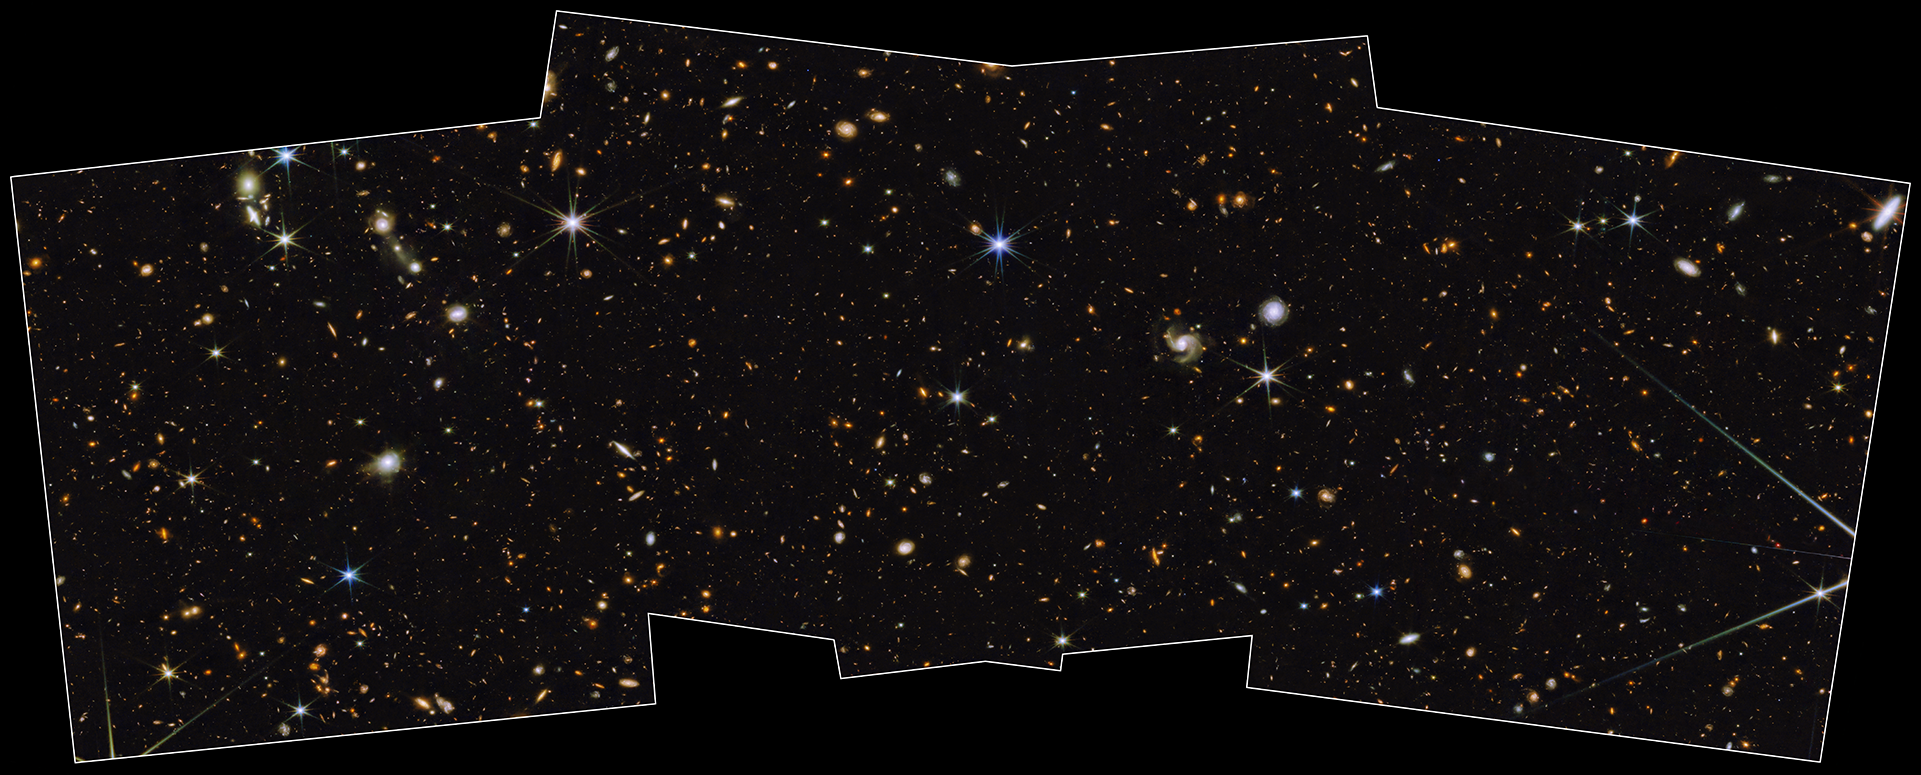
The JWST North Ecliptic Pole Time Domain Field (NEPTDF) data
is released showing a wide-angle, medium-deep (~29 mag) 2
degree swath of distant galaxies some with look-back times
of nearly 13.5 Gya, and including thousands of galaxies of
different distances and stellar ages as far as the exposure
set 'eyes' can see. The figures were released with the
publication of Windhorst, R. A. et al. 2023. JWST
PEARLS. Prime extragalactic areas for reionization and
lensing science: Project overview and first results. ApJ
165 (1), 13. https://iopscience.iop.org/article/10.3847/1538-3881/aca163.
Here is the North Ecliptic Pole Time Domain Field collection
of JWST images (https://webbtelescope.org/contents/media/images/01GM3WVZFBH5S7Y6E0EXH1EH0Y).
Note that all galaxy morphologies and all galactic stellar
ages (cf. CMD and HRD) are represented, just as expected in
a Universe indefinitely old or eternal.
 JWST NEPTD Field main image (link).
(link).
JWST NEPTD Field clean image (link).
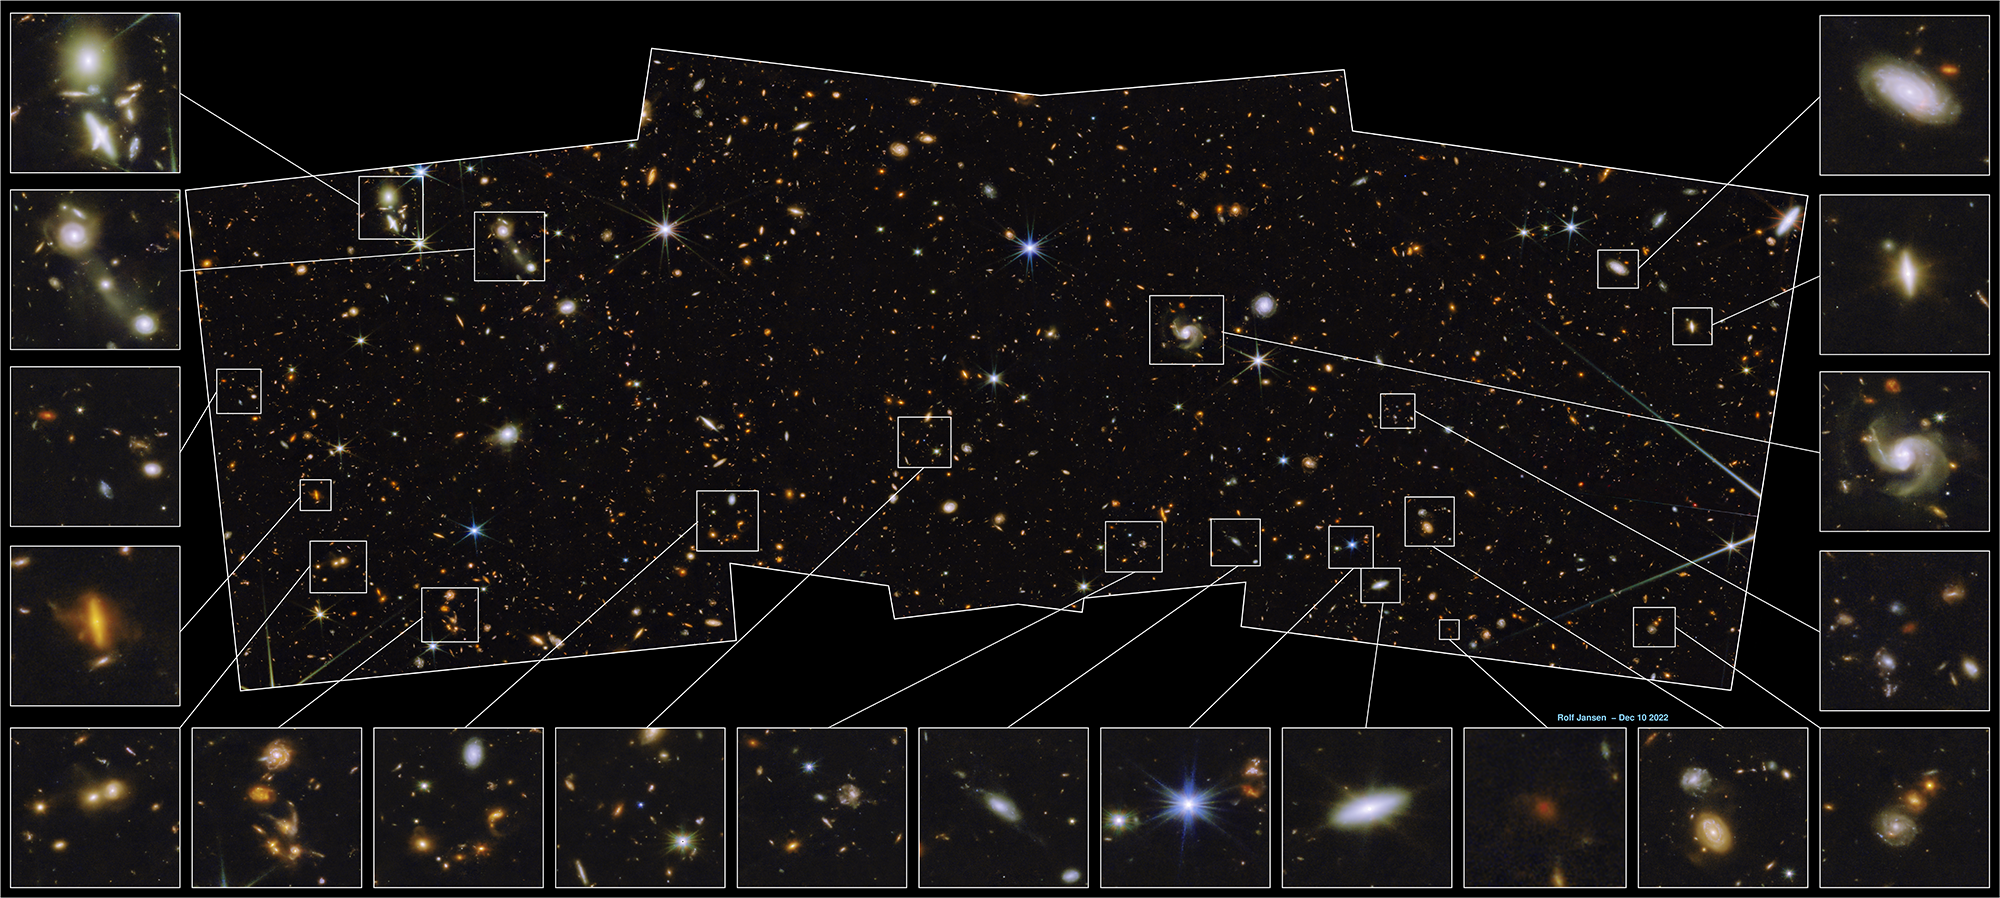
JWST NEPTD Field annotated
image (link).
The
coloration process based on HST and JWST color range filters
enables us to see the approximate stellar ages of the
galaxies at the time the light left them en route to
the rest of the Universe including us. As with all the deep
fields from all the space telescopes, JWST NEPTD Field
illustrates that galaxies of all ages and distances are
visible as far as can be seen. This is consistent with
galaxies having different origination times and inhabiting
an indefinitely old or eternal Universe.
14 February 2023 released; last revised 19 May 2023.
In February 2023, Bunker et al. (2023) released (https://arxiv.org/abs/2302.07256),
JADES NIRSpec Spectroscopy of GN-z11: Lyman-α emission and
possible enhanced nitrogen abundance in a z = 10.60
luminous galaxy. version 2: https://arxiv.org/abs/2302.07256v2,
or https://doi.org/10.48550/arXiv.2302.07256)
where they apply the JWST NIRSpec spectrum-taking capability
to the distant object GN-z11 discovered by HST, and which is
the most luminous galaxy in the GOODS-N field. Bunker et
al. (2023) re-determined the redshift of z = 10.603,
meaning a look-back time of 13.281 Gya (supposedly
0.441
Gyr post-BB).
In brief, Bunker et al. (2023) found evidences of
complex chemical development and metallicity in a distant
AGN / starburst galaxy with a very high redshift, as if it
were in the middle of a much broader field of evolving
galaxies. And this was supposedly only ~400 Myr post-BB.
01 March 2023 released: published February 2024.
Another very early and highly metallic galaxy has been found
which may be of paradigmatic significance. What was first
observed as a mere 'speck of light' by HST turns out to be
one of the most enormous galaxies in the observed Universe
according to a LiveScience report, "Speck of light spotted
by Hubble is one of the most enormous galaxies in the early
universe, James Webb telescope reveals" (18
Mar 2024). That this object was a galaxy, designated
Gz9p3 when discovered by HST, was confirmed by spectroscopy
by Boyett, K. Trenti, M., Leethochawalit, N. et al.
2023. A massive interacting galaxy 525 million years after
the Big Bang. arXiv (01 Mar 2023; v1): https://arxiv.org/abs/2303.00306v1.
arXiv (27 Feb 2024; v2): https://arxiv.org/abs/2303.00306v2.
Nat Astron. https://doi.org/10.1038/s41550-024-02218-7.
Adopting a standard ΛCDM cosmology with parameters H0
= 70 km s−1
Mpc−1
, Ωm = 0.3, and Ω∧ = 0.7, they
applied
the measured redshift for this galaxy of z = 9.3127
± 0.0002, leading to a look-back time of 12.952 Gyr (supposedly
0.511 Gyr
post-BB).
14 March 2023 released; published April 2023.
In March of 2023, concerning again the high redshift galaxy
known from the HST, Charbonnel et al. (2023)
released (arXiv: https://arxiv.org/abs/2303.07955),
N-enhancement in GN-z11: First evidence for supermassive
stars nucleosynthesis in proto-globular clusters-like
conditions at high redshift? A&A 673,
L7. https://doi.org/10.1051/0004-6361/202346410.
This paper raised the issue of how to account for the high
metallicity in the compact and distant galaxy, GN-z11 which
has a redshift of z =10.6, equivalent to a look-back
time of 13.281 Gya (supposedly,
0.441 Gly post-BB). The chemical maturity or metallicity of
this early galaxy challenges the processes of stellar
chemical evolution in astrophysics. The problem is that the
CNO cycle of stellar nucleosynthesis should not produce a
bunch of N, but very little O or C. Nagele, C. & Umeda,
H. 2023. Multiple channels for nitrogen pollution by
metal-enriched supermassive stars and implications for
GN-z11. ApJL 949 (1), L16. https://doi.org/10.3847/2041-8213/acd550,
used simulations to argue for multiple paths for super-solar
N-enrichment through very short lived, hypothetical super
massive stars (SMSs) which would explode and even further
enrich or 'pollute' a system like GN-z11 with nitrogen (N).
The write-up in Sky & Telescope magazine (AAS
Nova, 13 June 2023, "Could supermassive stars explain how
this galaxy got its it nitrogen?"
wisely wrote, "Because GN-z11 does not show signs of
abundant oxygen, this means that 1,000- and
10,000-solar-mass stars are unlikely sources of the galaxy's
nitrogen" (https://skyandtelescope.org/astronomy-news/could-supermassive-stars-explain-how-this-galaxy-got-its-nitrogen/).
Charbonnel et al. (2023) and Nagele & Umeda
(2023) both cite many papers which have tried to deal with
this problem through exotic mechanisms such as SMSs, appeals
to unknown early Universe conditions, or suspected early
high density mergers, but the problem remains unsolved. One
common sense-wielding reader quite innocently asked S&T,
"...[It is]
fairly well established that radiation pressure made it
physically impossible for stars larger than about 80-100
solar masses to form. This is consistent with the
brightest and presumably most massive stars that have been
observed in the Milky Way, the Magellanic Clouds, and M31.
So how do you get stars up to 1000x more massive in the
first place?....
Also, isn't a metal abundance of only -1 in the Log
relative to the Sun pretty high for so early a time? I
thought field halo stars in the Milky Way were at about -3
max, and there used to be talk of a (previous) primordial
Population III at -5 or -7 (or even lower). Where do they
get one tenth solar from without a previous generation (or
several) of stars?" (Emphasis
added; link).
Good cosmological questions indeed, the honest answers to
which reveal the need for a better cosmological model!
19 April 2023 (Wednesday)
released;
published 29 June 2023 (: JWST).
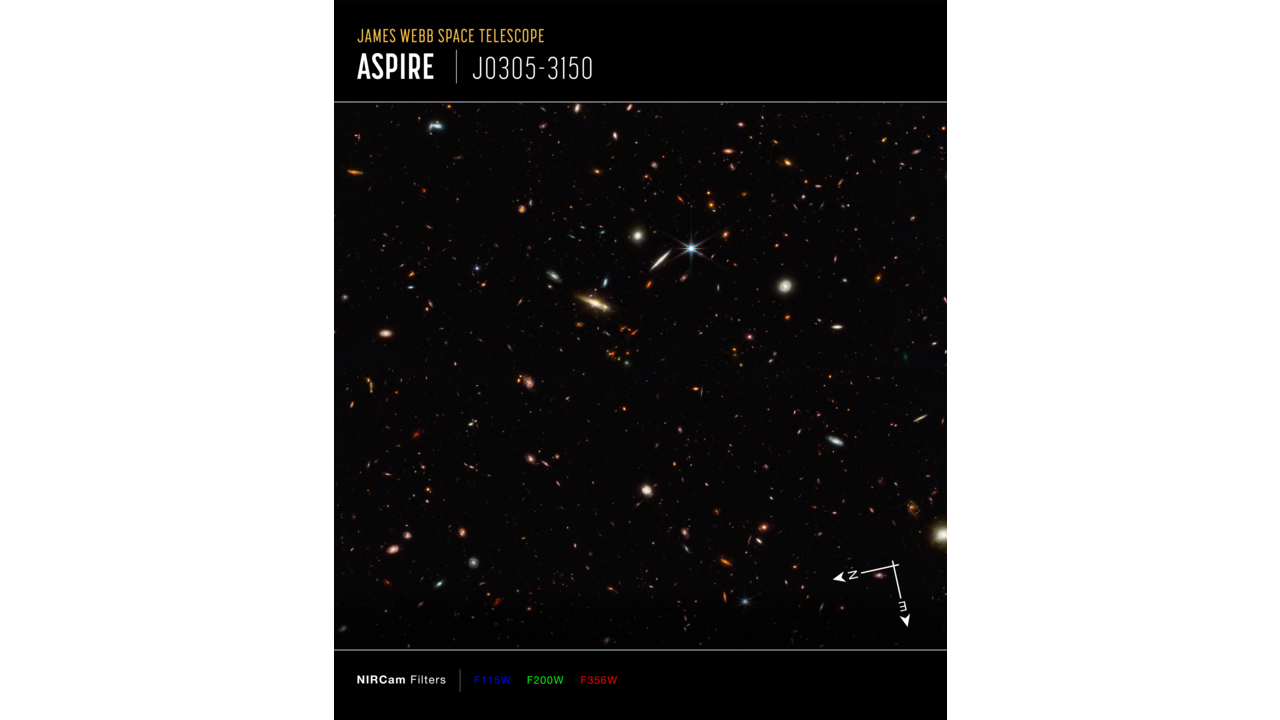
Disk galaxies with ancient, mature,
mixed stellar populations, are the result of galactic
morphological evolution, and long stellar evolution.
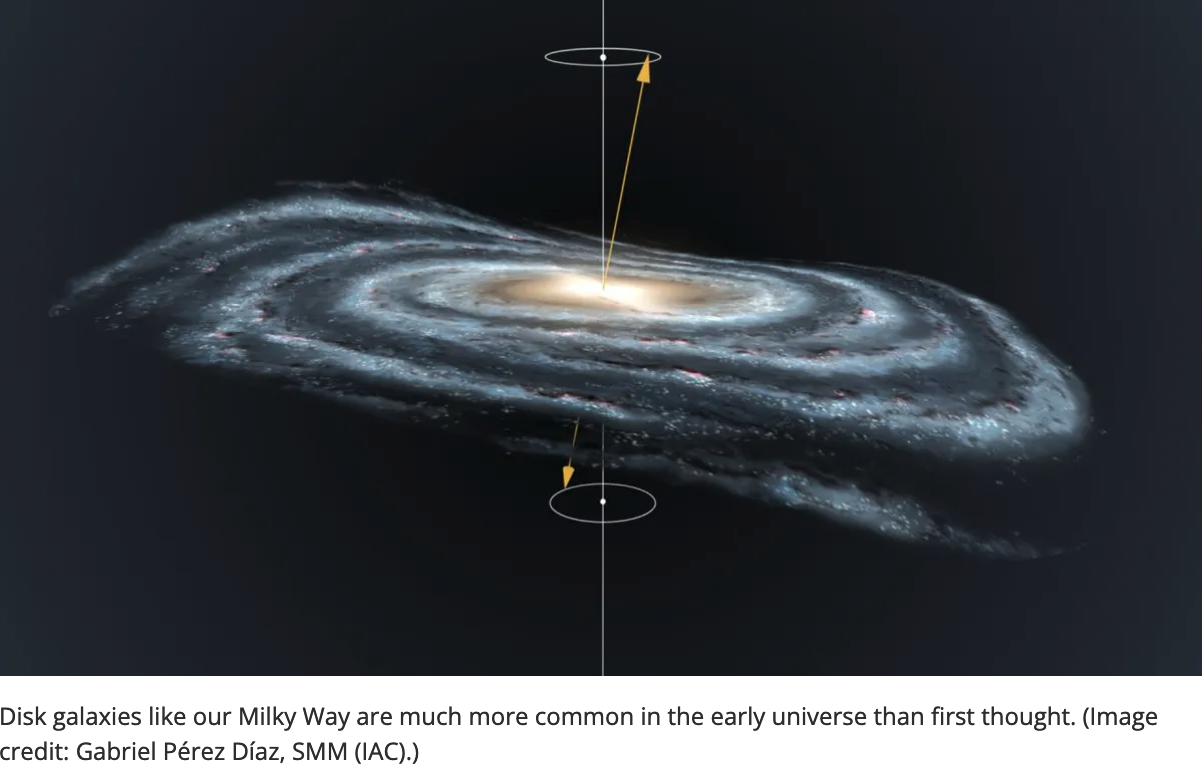 Disk galaxies considered to be the result of
long processes and they are more common than expected in the
standard Big Bang cosmology (link).
Disk galaxies considered to be the result of
long processes and they are more common than expected in the
standard Big Bang cosmology (link).
19 April 2023 (Wednesday) released;
published 01 October 2023: An earlier and more
expansive version of the paper was published on 03
October 2022 on arXiv: Ferreira et al. 2022. The
JWST Hubble sequence: The rest-frame optical evolution
of galaxy structure at 1.5 < z < 8. https://arxiv.org/abs/2210.01110,
with z-values all the way out to z ~ 8,
equivalent in look-back time to 13.076 Gly, supposedly a mere 0.646 Gyr post-BB (Wright, 2006
online calculator: https://www.astro.ucla.edu/~wright/ACC.html).
This has since been domesticated into Ferreira et al.
2023. The JWST Hubble sequence: The rest-frame optical
evolution of galaxy structure at 1.5 < z <
6.5. ApJ 955 (2), 94. https://iopscience.iop.org/article/10.3847/1538-4357/acec76/pdf;
https://doi.org/10.3847/1538-4357/acec76
The JWST Hubble Sequence: The Rest-frame Optical
Evolution of Galaxy Structure at 1.5 < z < 6.5
. The write-up life is in the Live
Science link with the wonderful title, "James Webb
telescope spots thousands of Milky Way lookalikes that
'shouldn't exist' swarming across the early universe."
This domesticated study utilized optical classification
for 3,956 galactic sources to look for signs of
rest-frame optical galactic evolution between 1.5 < z < 6.5,
across look-back times from ~11.550 Gyr (supposedly 2.172 Gyr post-BB) to ~12.872 Gyr (supposedly Gyr
post-BB) using JWST data compared with HST
data. We will also briefly contrast the
October 2022 version of the paper with the
domesticated October 2023 version. HBBC
prediction: In a Big Bang cosmos about
~13.8 Gyr in age, we should see a fairly
rapid evolution at higher redshifts of
merging irregular small galaxies forming
larger galaxies, with evolving stellar
populations, and later forming the Hubble
'tuning fork' sequence of galaxy
morphologies, with mature stellar
populations across the Hertzsprung-Russell
diagram. In summary, there should be
evolving counts of the various galactic
morphological types across look-back time,
which is not what we see either in this
domesticated paper or in the more expansive
arXiv version with z
< 8.
This study was in essence testing that
prediction with widest, earliest
classification of galactic morphologies
taken to date, from among the CEERS and the
CANDELS space telescopic data sets.
All of
the galaxies were submitted
through a software-based data
analysis classification pipeline
deciding between the following
shape categories:
- (1)
unclassifiable:
unresolved, not visible, too
faint / artifactual,
- (2)
point sources:
smaller in angular size than
the Gaussian full-width at
half-maximum (FWHM) of the
point-spread function (PSFFWHM)
such that the resolution is
consistent with point
sources, without extended
components,
- (3)
disks: resolved with
an outer area of lower
surface brightness regularly
increasing toward the
center, not dependent on
whether there is a spiral or
bar pattern present,
- (4)
spheroid: resolved,
symmetrically and
centrally-concentrated with
smooth profile, round or
elliptical in shape,
- (5)
peculiar:
well-resolved, where
peculiarity or disturbance
dominates over any smooth
components.
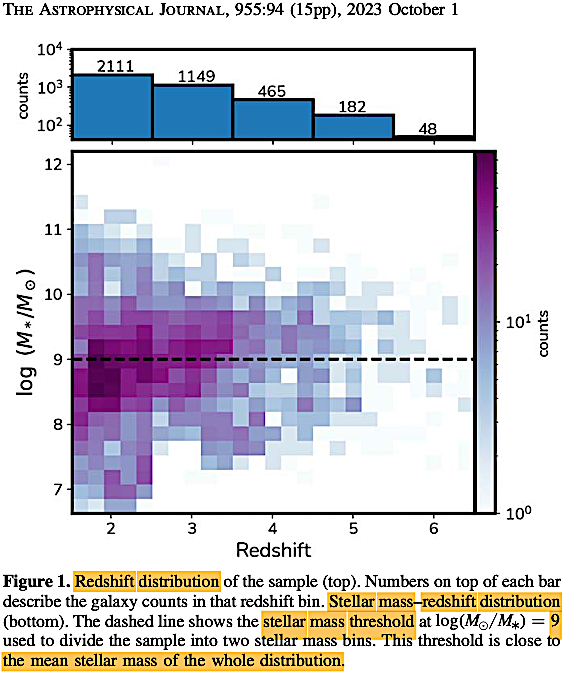
Notice how steady the
stellar mass threshold near the
mean stellar mass of the stellar
mass-redshift distribution is
across the redshift bins, even
while the resolution declines
with greater distance /
look-back times.
|
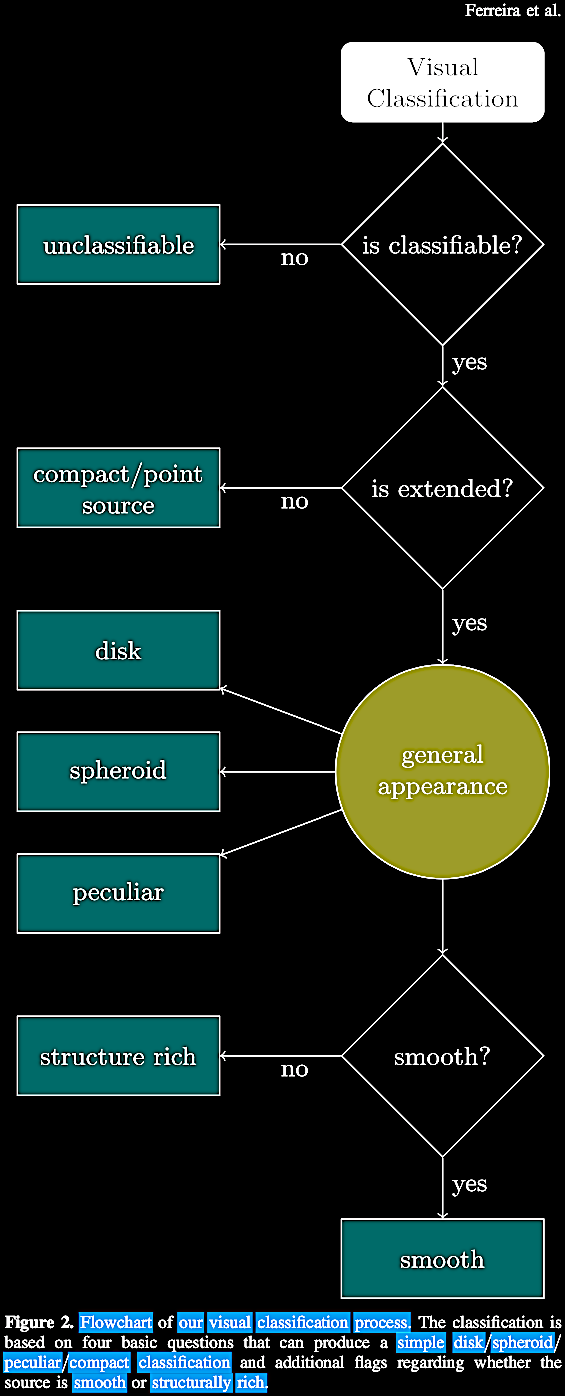
|
Rest-frame optical
galactic sources representative of the 3 of the categories of
samples in the Ferreira et al. (2023) study. 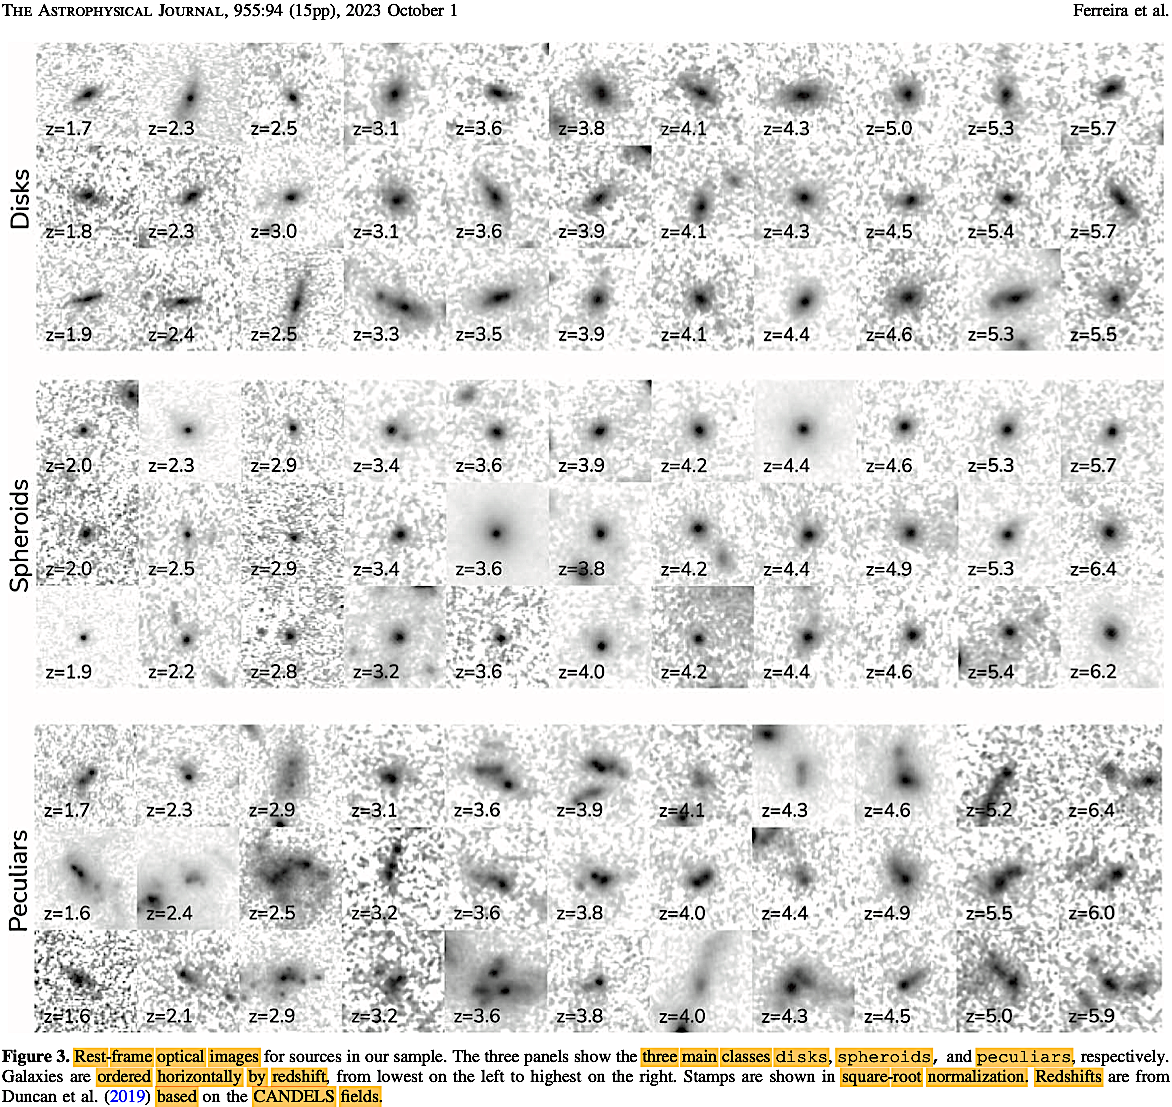
Figure 4 shows 3 measures of
the three galaxy morphologies
considered: (top) effective radius (Rn);
(middle) axis ratio (a/b); and
(bottom) information entropy. Figure 6
compares log asymmetry vs. log spirality
for a larger mass bin. Figure 8 shows
the Sersic index or profile (link)
of the mathematical relation of how
intensity (I) varies with radius
(R) from the center of a galaxy.
Figure 5 shows the
concentrations of asymmetry in
morphologies across various redshift
bins. There seems to be very little
change, except related to perhaps
declining resolution with greater
redshifts.
Figure 7 shows the non-radial asymmetry
in a Cartesian to polar coordinate
transformation representation of three
of the categorized galaxy morphologies
studied.
Figure 9 shows the morphology fractions
for two mass bins across redshifts of z
< 2 to z > 6.
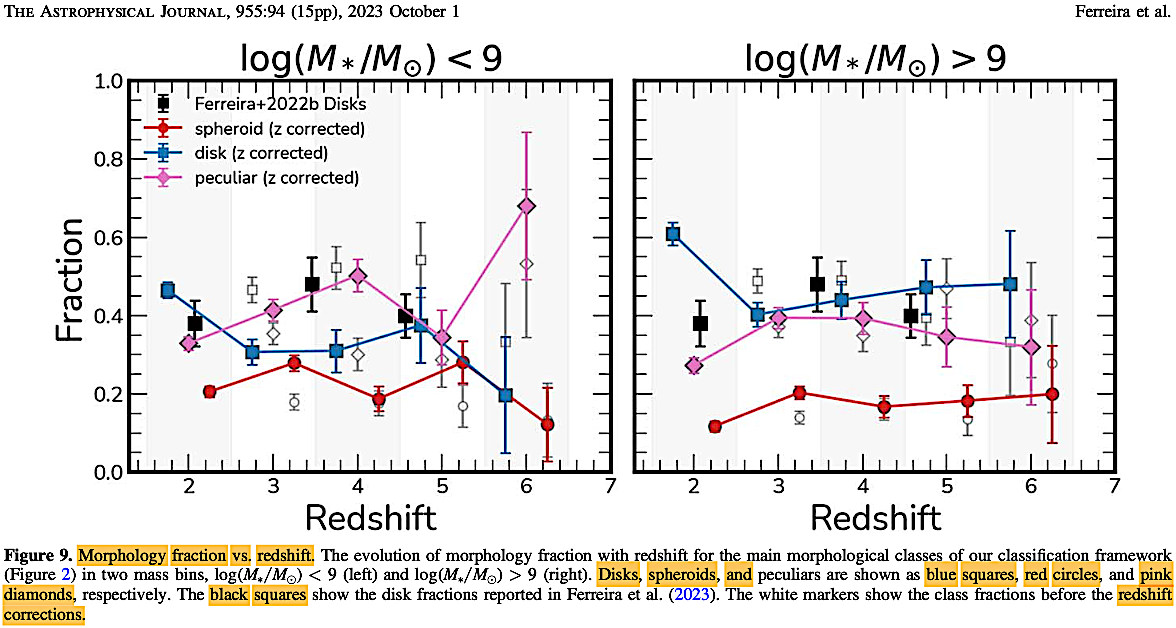
Figure
10 shows the morphology fractions
per specific star formation rates
(sSFRs) across various redshift
bins.
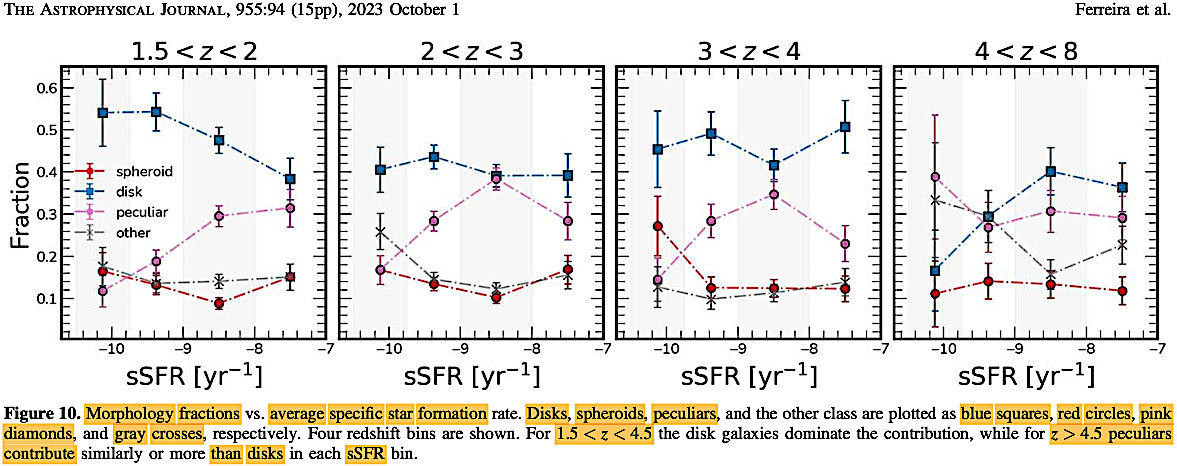
Figures
11 and 12 show morphology fractions
(fm) per total
stellar mass & redshift, as well
as per star formation rate (fSMR)
& redshift, respectively.
Compare with the Ferreira et al.
2022 equivalent figures below.
Figure 14 shows
representative comparisons between
select galaxies assayed for morphology
between the HST and the JWST. Many
features are very clearly visible in
JWST imagery, while sometimes only the
core of the galaxy is visible in HST
imagery (see Fig. 14 legend). This is
illustrative of how the limiting factor
is the telescopic resolution, not
supposedly evolutionary features in
these distant galaxies.
In summary, what can be safely said of
significance is what the authors note:
"For galaxies with higher masses M* >
109 M☉, the fractions of disks /
spheroids / peculiars appear to be
roughly constant at 1.5 < z
< 6.5." To this we may add from the
more expansive Ferreira et al.
2022 (arXiv version) that not only do we
have the full Hubble-de Vaucouleurs
galaxy morphology series present for
redshift distances z > 6,
which translates to look-back times >12.951 Gly (supposedly ~0.771 Gy
post-BB), but also in the Ferreira et
al. 2022 version on arXiv we have
the
full Hubble-de
Vaucouleurs
galaxy
morphology
series
going out to z
< 8, i.e.,
look-back times
13.076
Gly, supposedly
0.646 Gyr post-BB.
The evolution of Milky Way like spiral
galaxies and the entire Hubble sequence
of galaxy morphologies was present very
early, and perhaps the only limiting
factor is the resolution limits of the
JWST. If we were to let galaxy formation
and star formation rates speak for
themselves, there were mature stellar
galaxies of various masses >12 Gly
distant, which is actually >13 Gly.
A not-very-daring prediction:
Larger telescopes with higher
resolutions at these same wavelengths as
JWST will continue to show the ongoing
pattern of an ever present full
Hubble-de Vaucouleurs morphology series
out into distance obscurity at the
limits of that larger observatory's
resolution:
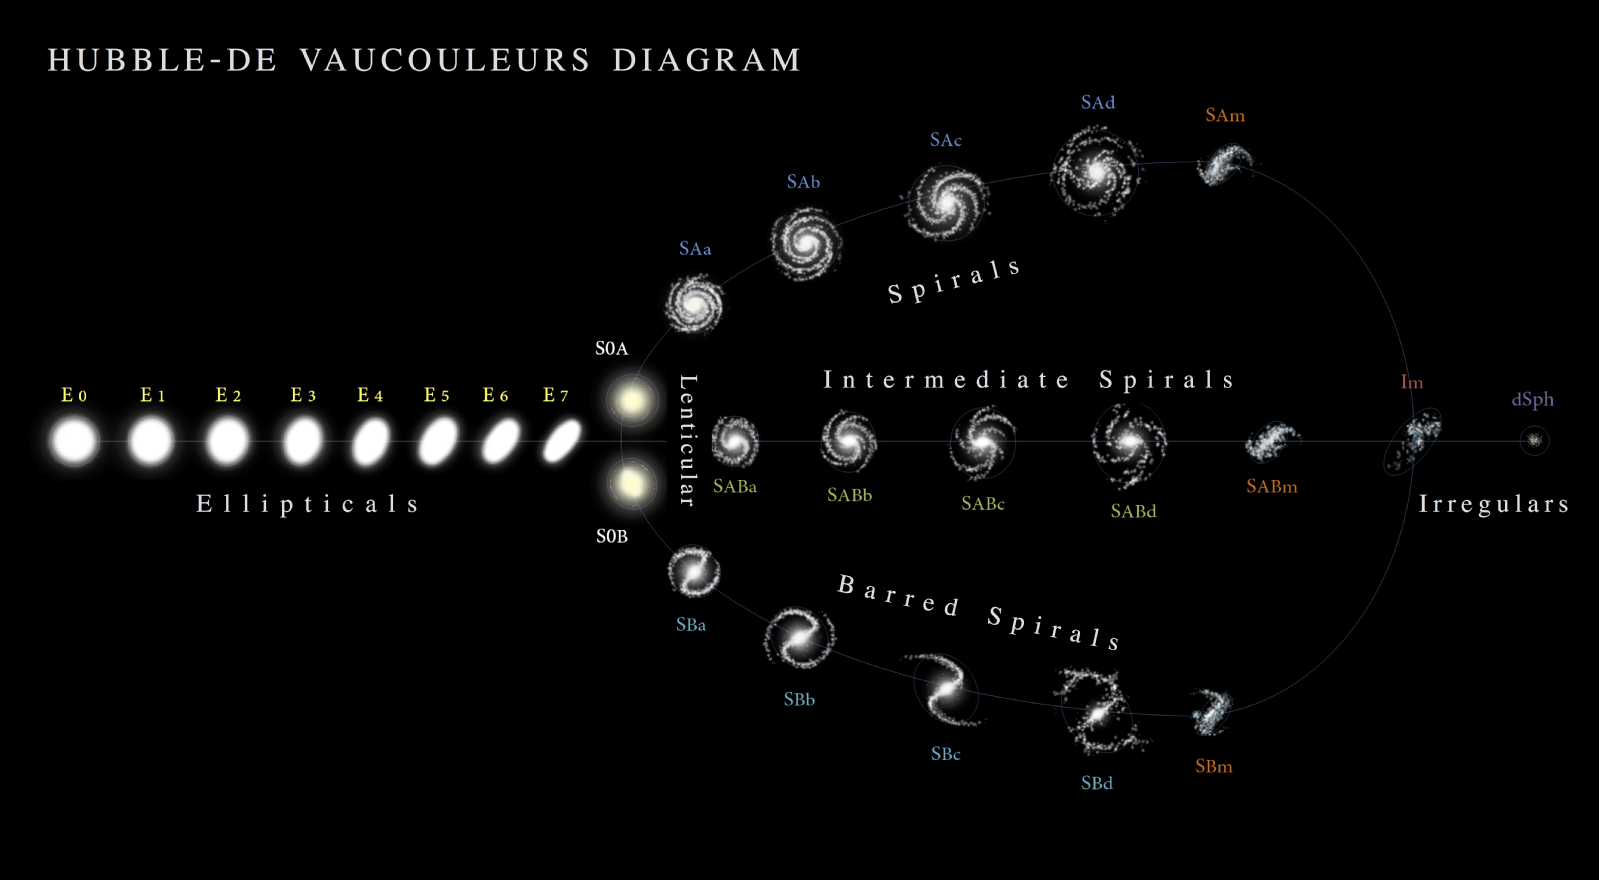
The Hubble-de Vaucouleurs
galaxy morphology classification (link).
13 September 2023 released: The
paper of Frye, B. L. et al.
2023. The JWST discovery of the
triply-imaged Type Ia 'Supernova H0pe'
and observations of the galaxy cluster
PLCK G165.7+67.0. https://arxiv.org/abs/2309.07326
occasioned some breathless excitement
about resolving the most pressing
'crisis in cosmology' question according
to HBBC proponents, and that is the rate
of expansion of the cosmos."
JWST's first triple-image supernova
could save the Universe" (link)
exclaimed one science news outlet.
The examination of the fortuitously
gravitationally-lensed Type Ia supernova
in PLCK G165.7+67.0 may help refine the
value of the H0 in
forthcoming papers, which may decrease
the 'Hubble tension' or at least that is
the hope, hence the quaint name, 'Supernova
H0pe'—not much
more of
paradigmatic
importance than
that so far.
More evidence has come in with 2024 on
the finding on mature, massive galaxies
with high redshifts. Back in 2016, the
Four Star Galaxy Evolution Survey
(ZFOURGE) of over >70,000 galaxies
resulting in ~60,000 with redshifts of z
> 1 (look-back times >7.818 Gya,
supposedly 5.904 Gy post-BB: https://zfourge.tamu.edu/#),
using the Four
Star infrared camera on the
Magellan Baade 6.5 m telescope at the
Las Campanas Observatory (Chile). These
galaxies were surveyed in the HST legacy
fields of CDFS, COSMOS, and UDS (https://zfourge.tamu.edu/data/),
which can be visually explored as well.
This survey was published in Straatman,
C. M. S., et al. 2016. The
FourStar Galaxy Evolution Survey
(ZFOURGE): ultraviolet to far-infrared
catalogs, medium-bandwidth photometric
redshifts with improved accuracy,
stellar masses, and confirmation of
quiescent galaxies to z ~ 3.5. arXiv: https://arxiv.org/abs/1608.07579.
ApJ 830 (1), 51. https://doi.org/10.3847/0004-637X/830/1/51,
and including the 2017 Data Release (link).
z ~ 3.5; lookback time of ~11.898 Gya (supposedly ~1.824 Gy post-BB).
Animation of a sample of
the ZFOURGE database galaxy spectral energy distributions
(SEDs) across several redshifts.
Straatman et al. 2016
Notice the rather steady fractions across
redshift values of sigma z-value errors and
especially fractions of magnitudes (Fig. 16, first &
second rows) and in blue star formation rates (Fig. 16, 3rd
row) and red star formation rates (Fig. 16, 4th row). The
redshift bins go from z ~ 0.5 (look-back time ~ 5.093 Gya, supposedly 8.629 Gy post-BB) up through z ~ 4
(look-back time ~12.163 Gya,
supposedly ~1.559 Gy
post-BB).
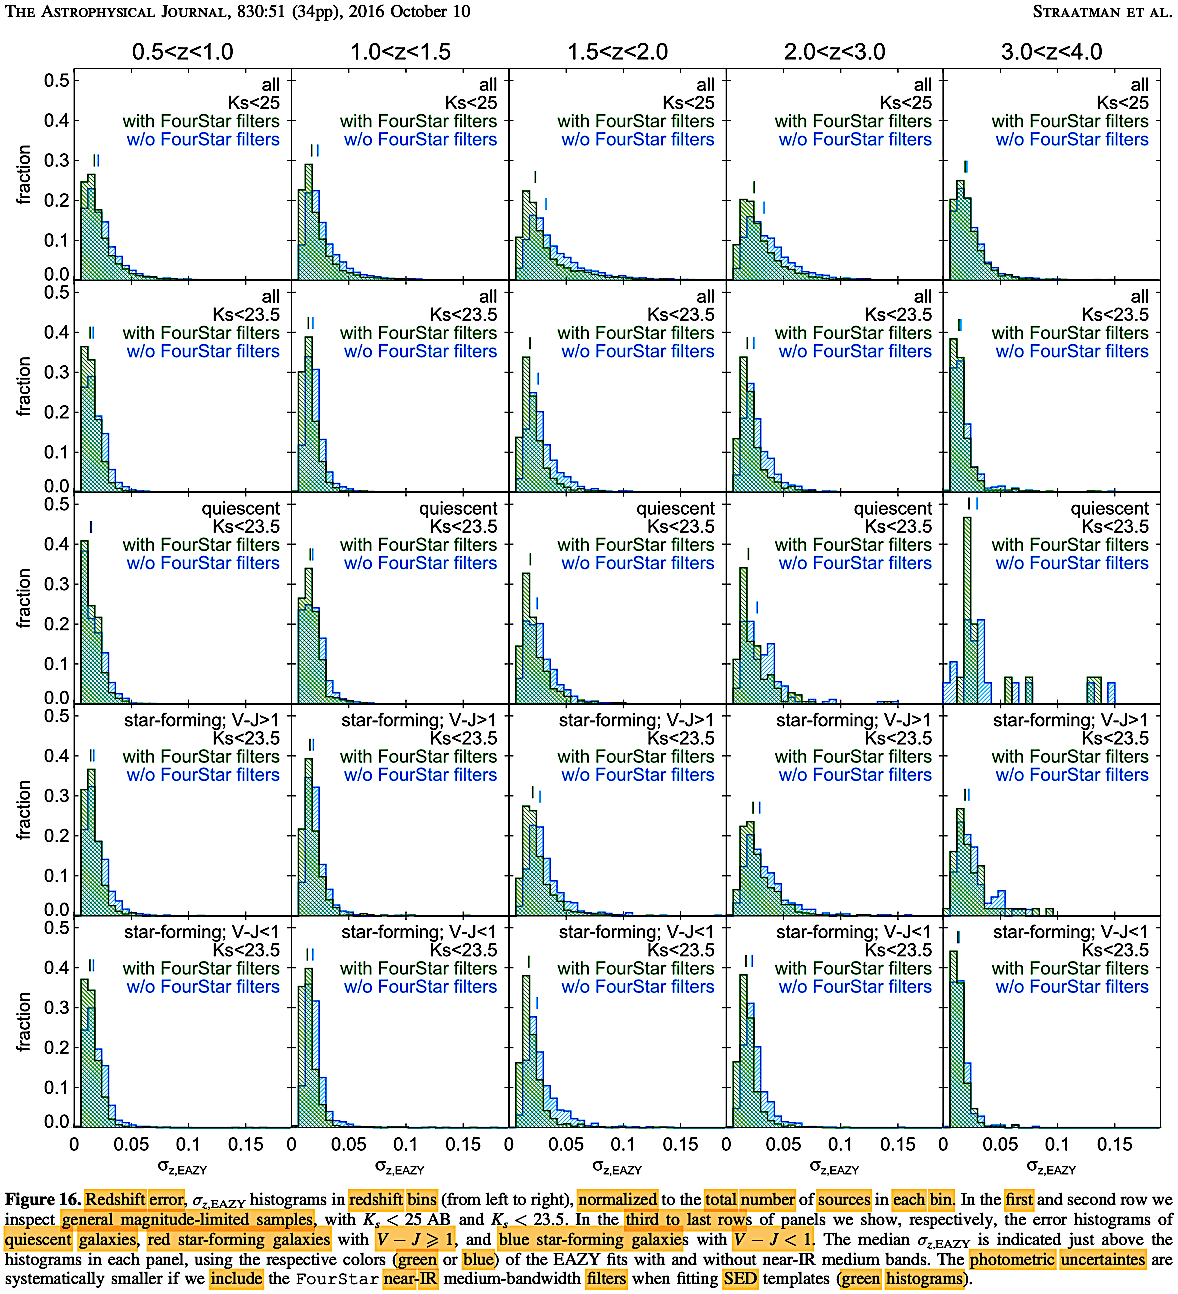
It is important to notice the broad variation or scatter in
magnitudes (Fig. 23) and also in stellar masses (Fig. 24).
It is very likely that the limiting factor here is the
instrumental limits in detection, not an actual paucity of
representatives of the galaxy categories at the higher
redshifts.
With the advent of JWST
operation, papers began to come out
furthering the work on old, massive,
quiescent galaxies, which of course are
signs of galaxy age and maturity.
09 November 2023 (Thursday) released (JWST). In the quest
to find distant
time-varying transients,
objects which vary in
brightness over shorter
intervals, in the medium
deep fields, JWST
returned to a field
exposure done by the
HST. Combined the HST
and JWST provided some
of the most colorful
deep images of the
Universe ("NASA's Webb,
Hubble Combine to Create
Most Colorful View of
Universe," link). In the
process of searching for
transients, the two
space telescopes
provided a combined
colored image of
galaxies with different
colored stellar
populations and ages,
where colors represent
wavelengths /
frequencies:
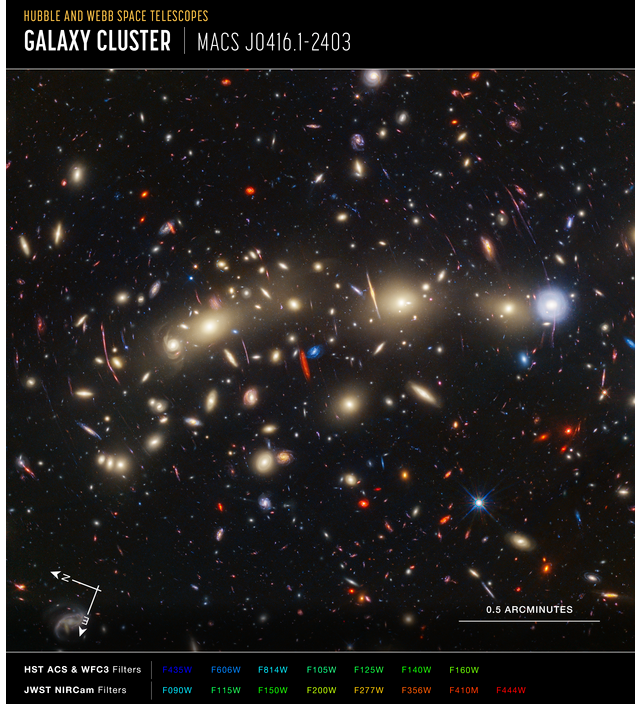 (Image with wavelength coloration from both
HST and JWST filters; link).
(Image with wavelength coloration from both
HST and JWST filters; link).
The transients were
reported in Yan et
al. (2023). JWST's
PEARLS: Transients in
the MACS J0416.1-2403
field. v2. https://arxiv.org/abs/2307.07579,
and in Diego et al.
(2023). JWST’s PEARLS:
Mothra, a new kaiju star
at z = 2.091
extremely magnified by
MACS0416, and
implications for dark
matter models. (arXiv: https://arxiv.org/abs/2307.10363).
A&A 679,
A31. https://doi.org/10.1051/0004-6361/202347556.
09 January 2024
released, published.
Veteran distance ladder
calibrator and Nobel
laureate, Adam Riess and
colleagues did further
work to resolve the
Hubble tension between
standard Cepheid
variable and the
CMB-derived values of
the H0
constant: Riess, A. G.,
et al. 2024. JWST
observations reject
unrecognized crowding of
Cepheid photometry as an
explanation for the
Hubble Tension at 8σ
confidence. (arXiv: https://arxiv.org/abs/2401.04773).
ApJ Letters 962
(1), L17. https://doi.org/10.3847/2041-8213/ad1ddd.
The model-dependent
CMB-derived results are
introduced and discussed
in Chapter IV. The CMB radiation: From Where and
Whence. We turn to
these remarkable results
next, which have a
bearing on the data
indicating a 'Hubble
tension' in the
measurements of H0
as introduced with
discussion in chapter VII. Unexpected Galactic Redshifts.
This study is a follow
up based on JWST data
from the
November of 2022
paper, Yuan et
al. 2022. A
first look at
Cepheids in Type Ia
supernova host with
JWST. ApJ
Letters 940,
L17. https://doi.org/10.3847/2041-8213/ac9b27,
which showed no JWST
resolution of the
'Hubble tension'
between the HST and
the JWST preliminary
results on the
nearby galaxy NGC
1365.
Riess and colleagues
measured >1000
Cepheid variables in
the distance ladder
anchor galaxy NGC
4258, also known as
the beautiful M106,
as well as in 5 host
galaxies with 8 SN
Ia supernovae, with
>150 Cepheids for
each galaxy assayed.
NGC 4258 / M106,
located about 23 Mly
from Earth, is a
fascinating
AGN galaxy
which is of
cosmological
significance
in testing
cosmological
and
cosmogonical
models.
Although
classified
first among
the Seyfert
galaxies
(which have
quasar-like
nuclei
surrounded by
a discernible
galaxy
structure; link),
NGC 4258 /
M106 is
actually a
LINER
(low-emission
nuclear
emission-line
region) type
of galaxy (link);
see discussion
in Burbidge
& Burbidge
(1997).
Ejection of
matter and
energy from
NGC 4258. ApJ
477,
L13-L15. https://doi.org/10.1086/310517.
The
NGC 4258 /
M106 system is
acutely
significant in
cosmology because
it has
apparently
ejected
angularly-equidistant
X-ray loud
QSOs along its
minor axes
with their
comparable
redshifts both
higher than
the central
galaxy (see
discussion
discussion in
Chapter IX. Vast jets and galactic ejection phenomena;
temporarily
unavailable
during
updates; and
referenced in
Chapter VIII. Radiogalaxies: Strange
powerhouses of
intergalactic
space-time).
NGC
4258 / M106
is also bright
in the radio,
X-ray, and infrared
wavelengths (see
composite below).
Now on to the data,
the analyses, and
the results of Riess
et al.
(2024).
The
NGC 4258 /
M106 system.
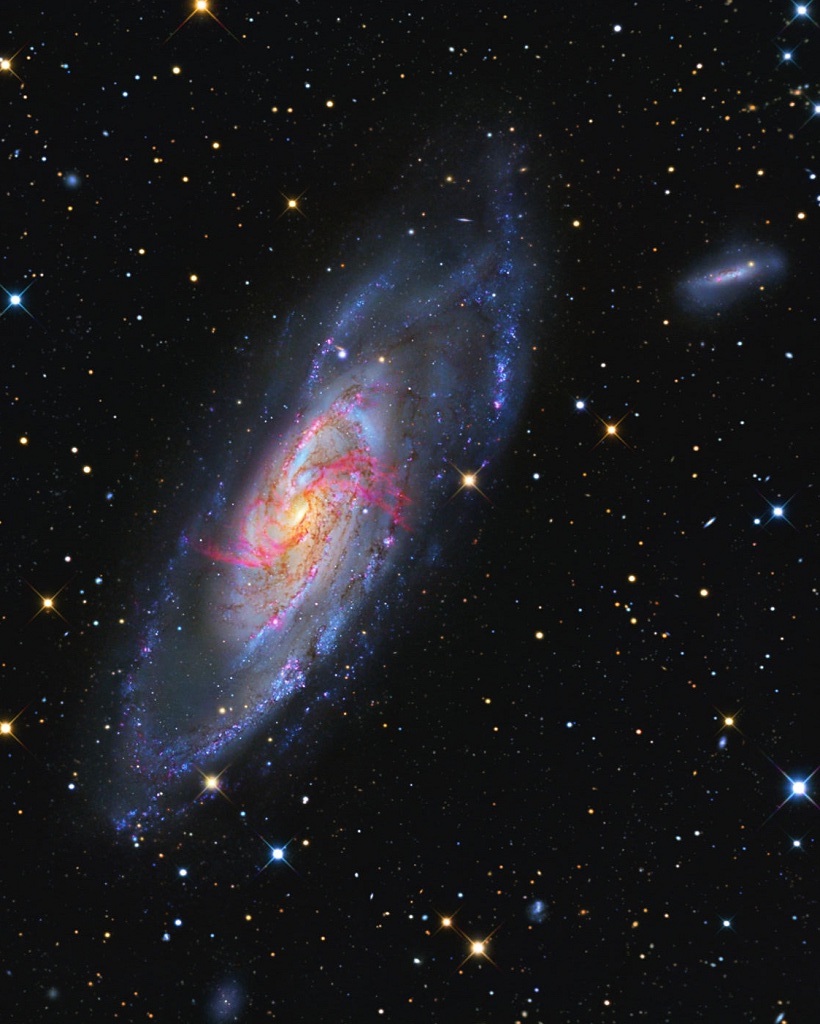
NGC 4258 /
M106 (Anne's Astronomy news link;
cf. HST Messier catalogue entry;
M106 wikipedia link).
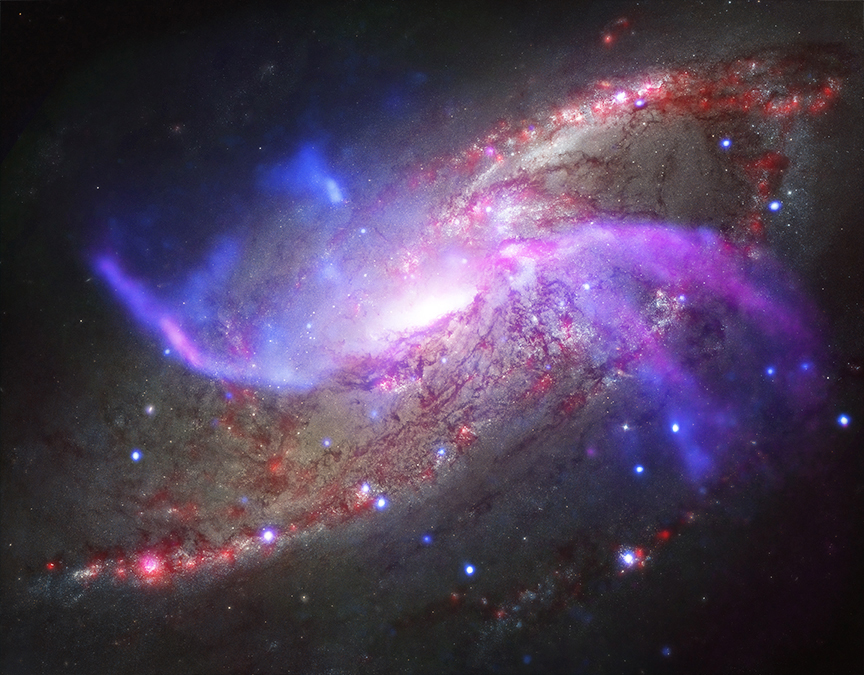
M106 in composite with optical (blue & yellow
from Hubble), X-rays (blue from Chandra), radio
waves (purple from the VLA), and infrared (red
from Spitzer). Notice the two anomalous arms which
are optically invisible but evident in X-ray
(blue) and radio (purple) emissions (Chandra link).
Above
left: Among the distant 'smudges' of light espied
in Canes Venatici within Plate 7
of Johann Elert Bode's [ˈboːdə, with o as in
'story'] 1801 Uranographia (link)
with zoomed detail (lower left); above right: IAU
map of Canes Venatici (link);
lower right: M106 classification as a spiral
between SAb and SAc spirals (https://theskylive.com/sky/deepsky/messier-106-object).
Before
this study, the
state of the
'Hubble tension'
cited for
Cepheids and SN
Ia data is that
of H0
= 73.0 ± 1.0 km
s−1
Mpc−1
based on the
Leavitt
period-luminosity
(P-L)
law-relation for
Cepheid
variables
(Leavitt, H. S.
& Pickering,
E. C. 1912.
Periods of 25
variable stars
in the Small
Magellanic
Cloud. Harvard
College
Observatory
Circular 173,
1-3. https://articles.adsabs.harvard.edu/pdf/1912HarCi.173....1L;
see discussion
and context in Chapter III. The
Hubble
relation and
the expanding
Universe)
from the SH0ES
collaboration of
Riess, A. G., et
al. 2022.
A comprehensive
measurement of
the local value
of the Hubble
constant with 1
km/s/Mpc
uncertainty from
the Hubble Space
Telescope and
the SH0ES team.
(arXiv release
v1 on 08 Dec
2021; v3 on 18
Jul 2022: https://arxiv.org/abs/2112.04510).
2022. A
comprehensive
measurement of
the local value
of the Hubble
constant with 1
km s−1
Mpc−1
uncertainty from
the Hubble Space
Telescope and
the SH0ES team.
ApJL 934
(1), L7. https://doi.org/10.3847/2041-8213/ac5c5b.
By
contrast,
according to the
CMB data (under
assumptions of
the 6-parameter
spatially-flat
ΛCDM model) from
the Planck
Collaboration et
al. 2020.
Planck 2018 results.
VI. Cosmological
parameters. A&A
641, A6.
https://doi.org/10.1051/0004-6361/201833910
(erratum:
https://doi.org/10.1051/0004-6361/201833910e),
the value of H0
= 67.4 ± 0.5
km s−1
Mpc−1.
This 'Hubble
tension' is real
to a robust
>5σ
difference between
the H0
values derived
from the
Cepheid P-L
calibrated distance
ladder data and
the ΛCDM
model-dependent
CMB
determination.
In
summary
paraphrase,
Riess et
al. (2022)
made the
following
conclusions at
that stage:
- Using a Cepheid-only calibration of 42 SNe
Ia data, they made a
baseline determination of H0 = 73.04 ±
1.04 km s−1 Mpc−1. Combining Cepheid
with TRGB (tip of the red giant branch) for a total of 46 SNe
Ia calibrators, H0
= 72.53 ± 0.99 km s−1
Mpc−1.
- This Cepheid-calibrated
SNe determination of H0
is greater than the Planck+ΛCDM H0
determination by >5σ (< 1
/ 3.5 million), "making it implausible to reconcile the
two by chance."
- No significant
inconsistencies of measurement or other sources of
unrecognized error including 67 variants of analyses
were found in the study. Included as a additional
uncertainty factor, the dispersion of the 59 NIR
variants is
only 0.3 km s−1 Mpc−1, while the mean H0
of the variants is 73.25 km
s−1 Mpc−1, a mere 0.2 km
s−1 Mpc−1 above the
baseline determination.
- Dispersion between the
42 SNe Ia and Cepheid relative distance measures is σ
= 0.130 mag, comparable to the σ = 0.135 mag
dispersion of SNe Ia found in the Hubble-flow sample,
thus yielding no evidence of excess noise in Cepheid
distance measurements.
- The SNe and TRGB
distances measures are consistent when starting and
ending with the same host galaxies (i.e., between the
1st and 2nd rungs in Fig. 1 below). Between measurements
by two groups the location of the tip in NGC 4258 and the resulting calibration of the
TRGB (using the mean of both) there's
a net difference of 1.3 km s−1 Mpc−1
(or 0.04 ± 0.02 mag). There is a net 1
km s−1
Mpc−1
(0.03 mag) higher value of H0
from the tripling of the SN calibrator sample,
consistent with the ± 0.05 mag shot noise of the
subsamples.
- Each of the three
independent geometric anchors is consistent with the
distance predicted by its Cepheids and the other two
anchors. This conclusion is further tightened by
improvements in the calibration of the metallicity
dependence of the Cepheid P-L relation.
- The SNe data between
the 2nd and 3rd rungs of the ladder (Figure 1 below) are
hosted by galaxies of the same late-evolved spiral type
with the same or similar mean star-formation rate (SFR)
and mass, with highly consistent color and shape
distributions. The calibrator data set contains a
complete sample of all suitably quality SNe Ia data at z
< 0.011 over the last four decades. The authors found
no indication of differences between the mean properties
of the samples’ host galaxies, nor any factor with
matched selection that would alter H0.
- Extragalactic Cepheids
appear to have a uniform P-L relation consistent
with a single slope and the fine structure in their
light curves resembles those in the Milky Way at a
comparable period of morphological evolution (that is,
the 'Hertzsprung progression' or the changes in light
curve shape with period).
- The distance ladder
presented provides constraint which is well-approximated
by the derived value of H0,
except in models introducing rapid, unexpected,
late-time changes in H(z) compared with
either ΛCDM, low-order fits to H(z), or
perhaps some forms of new physics. For such models, the
authors suggest replacing H0
with the absolute SN Ia host distances derived from the
first two rungs (Fig. 1), the set of SNe Ia standardized
magnitudes in these host galaxies, the SNe Ia magnitudes
in the Hubble flow, and their covariance. They provide
an example that yields a joint constraint of H0
= 73.30 ± 1.04 km s−1 Mpc−1
and a q0
= −0.51 ± 0.024.
- Accordingly, Riess et
al. frankly conclude, "The source of this
long-standing, significant discrepancy between the local
and cosmological routes to determining the Hubble
constant remains unknown."
Riess et al.
(2022) data:
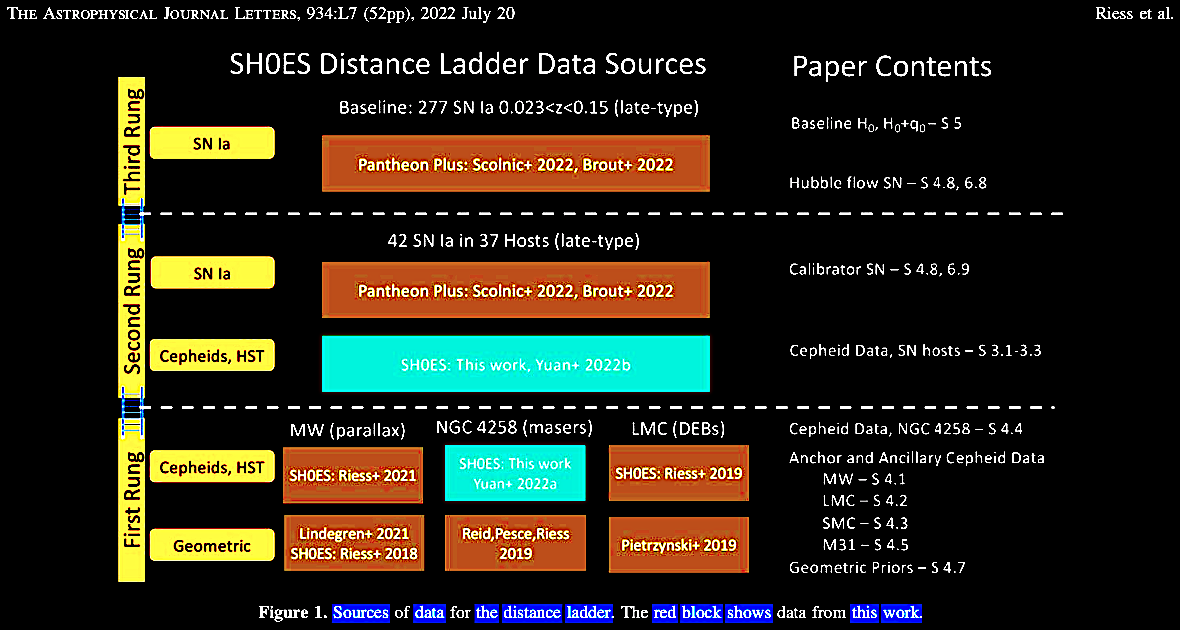
The foundation of
the 'distance ladder formalism' is the Hubble
constant (H0) or the present relation between
redshift (z) and distance: cz = H0D:
- (1) parallax and
maser-based geometric distance measurements
(to standardized Cepheid variables),
- (2) standardized Cepheids
and colocated SNe Ia in nearby galaxies, such
as NGC 4258, and
- (3) SNe Ia in the Hubble
flow or putative expansion of the cosmos.
|
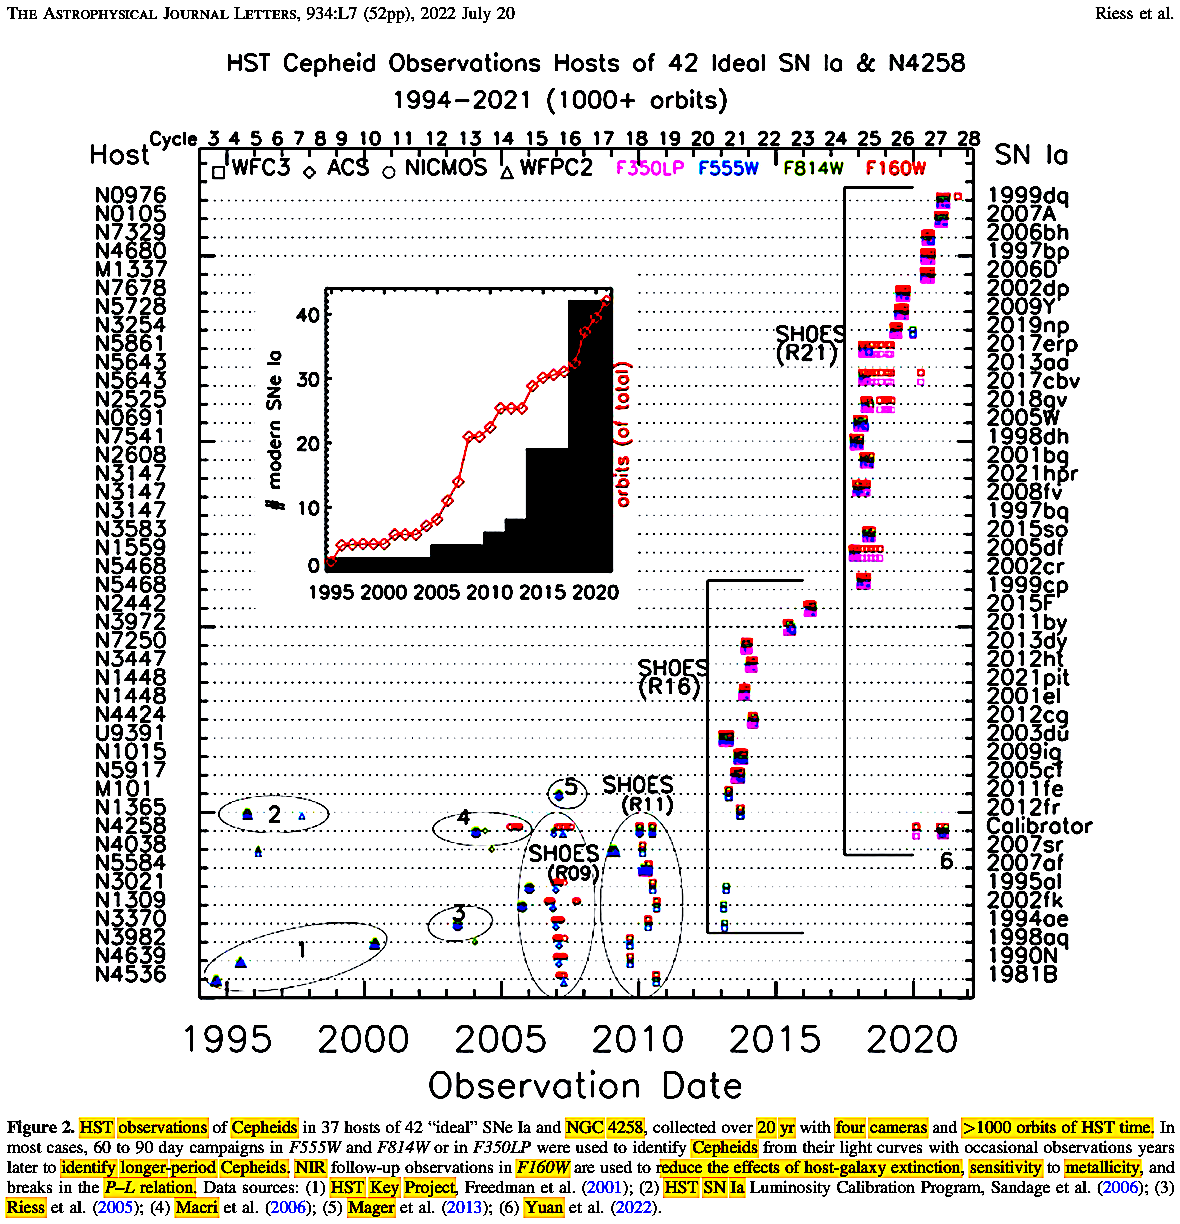
|
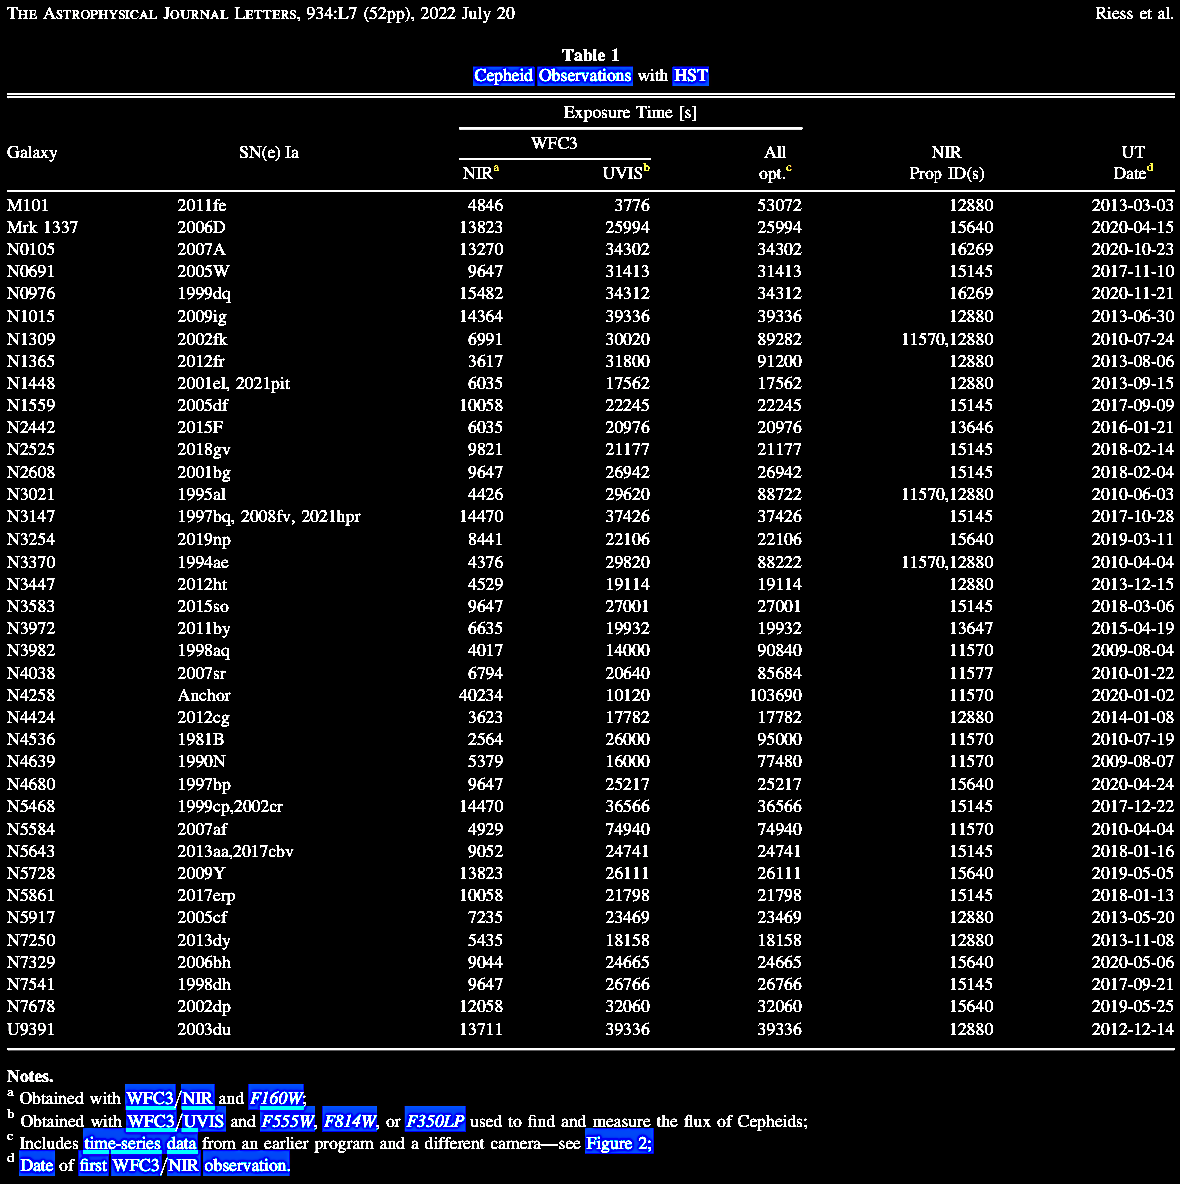
|
The basic
equations of cz = H0D
may be expanded to take in the variables into
matrices, where y = a vector of magnitude
measurements, and C = the covariance
matrix of standard errors of the magnitude
measurements
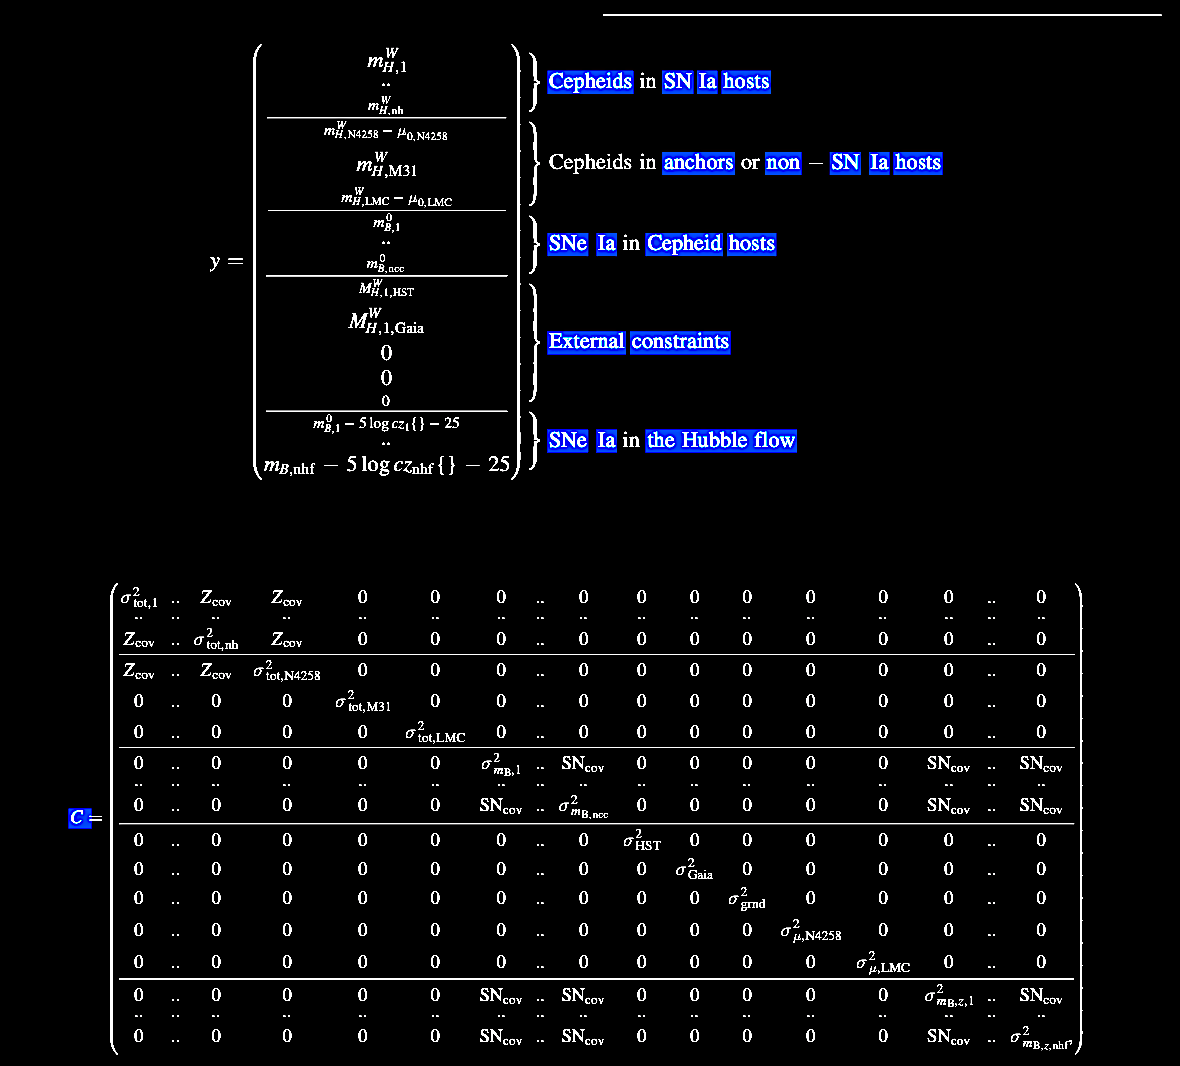
|
|
L being the equation matrix, including
metallicities of anchor galaxies hosting Cepheids:
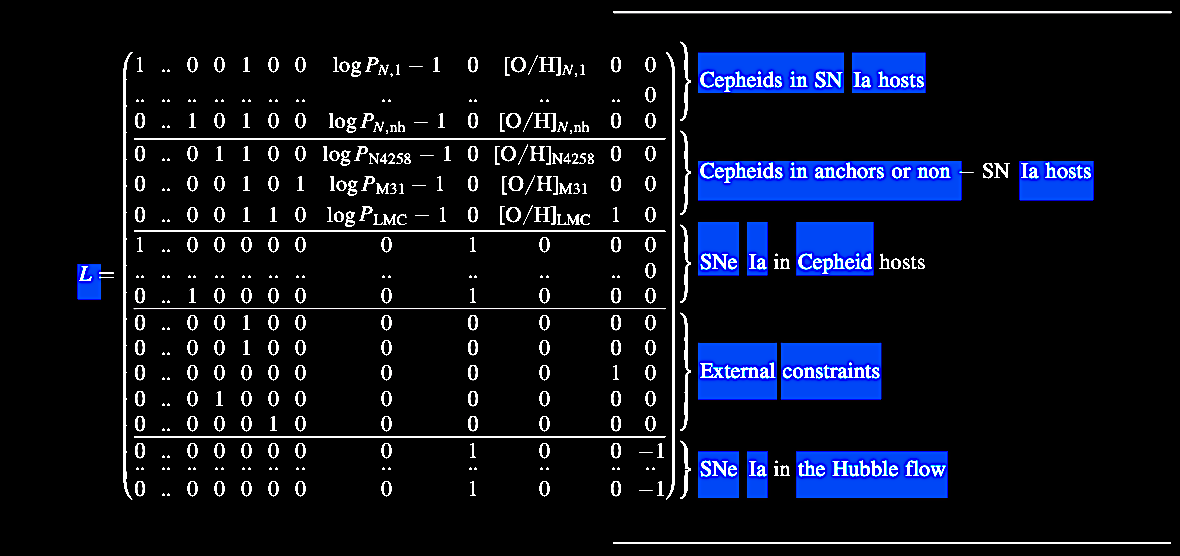 |
And q
being the vector of various free parameters, as in
the model Lq:
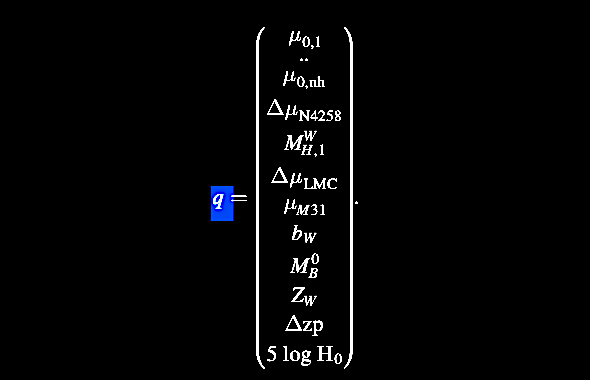
|
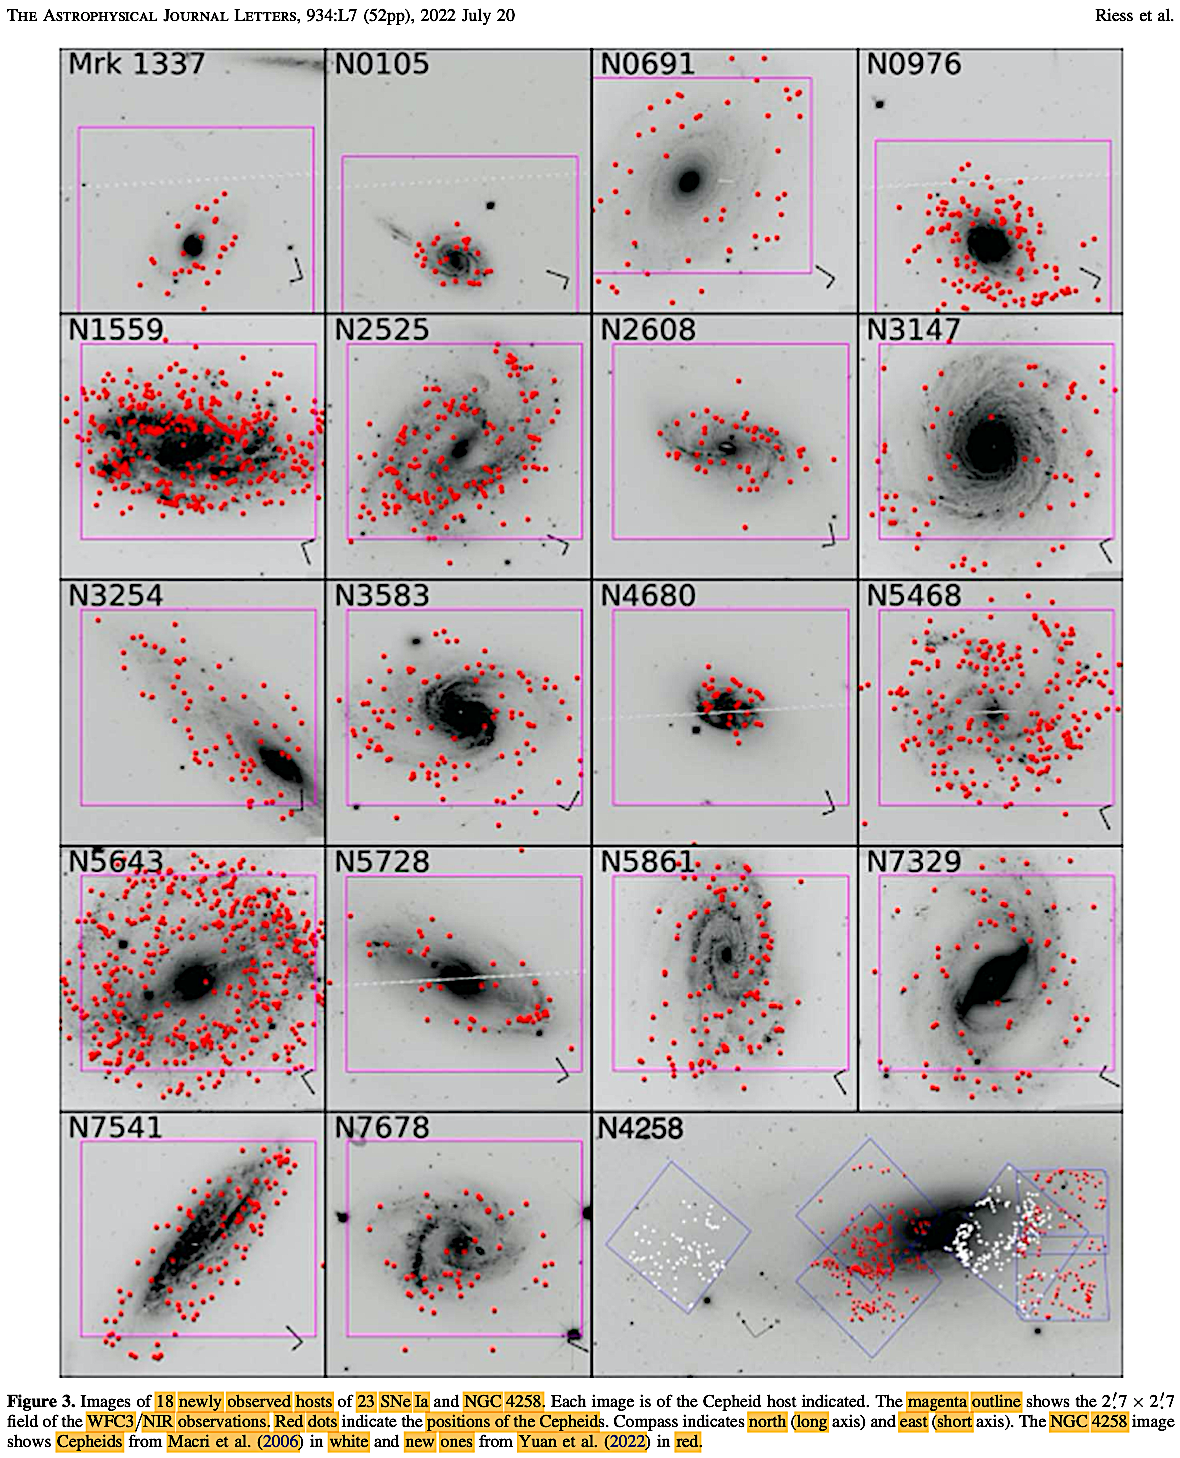
|
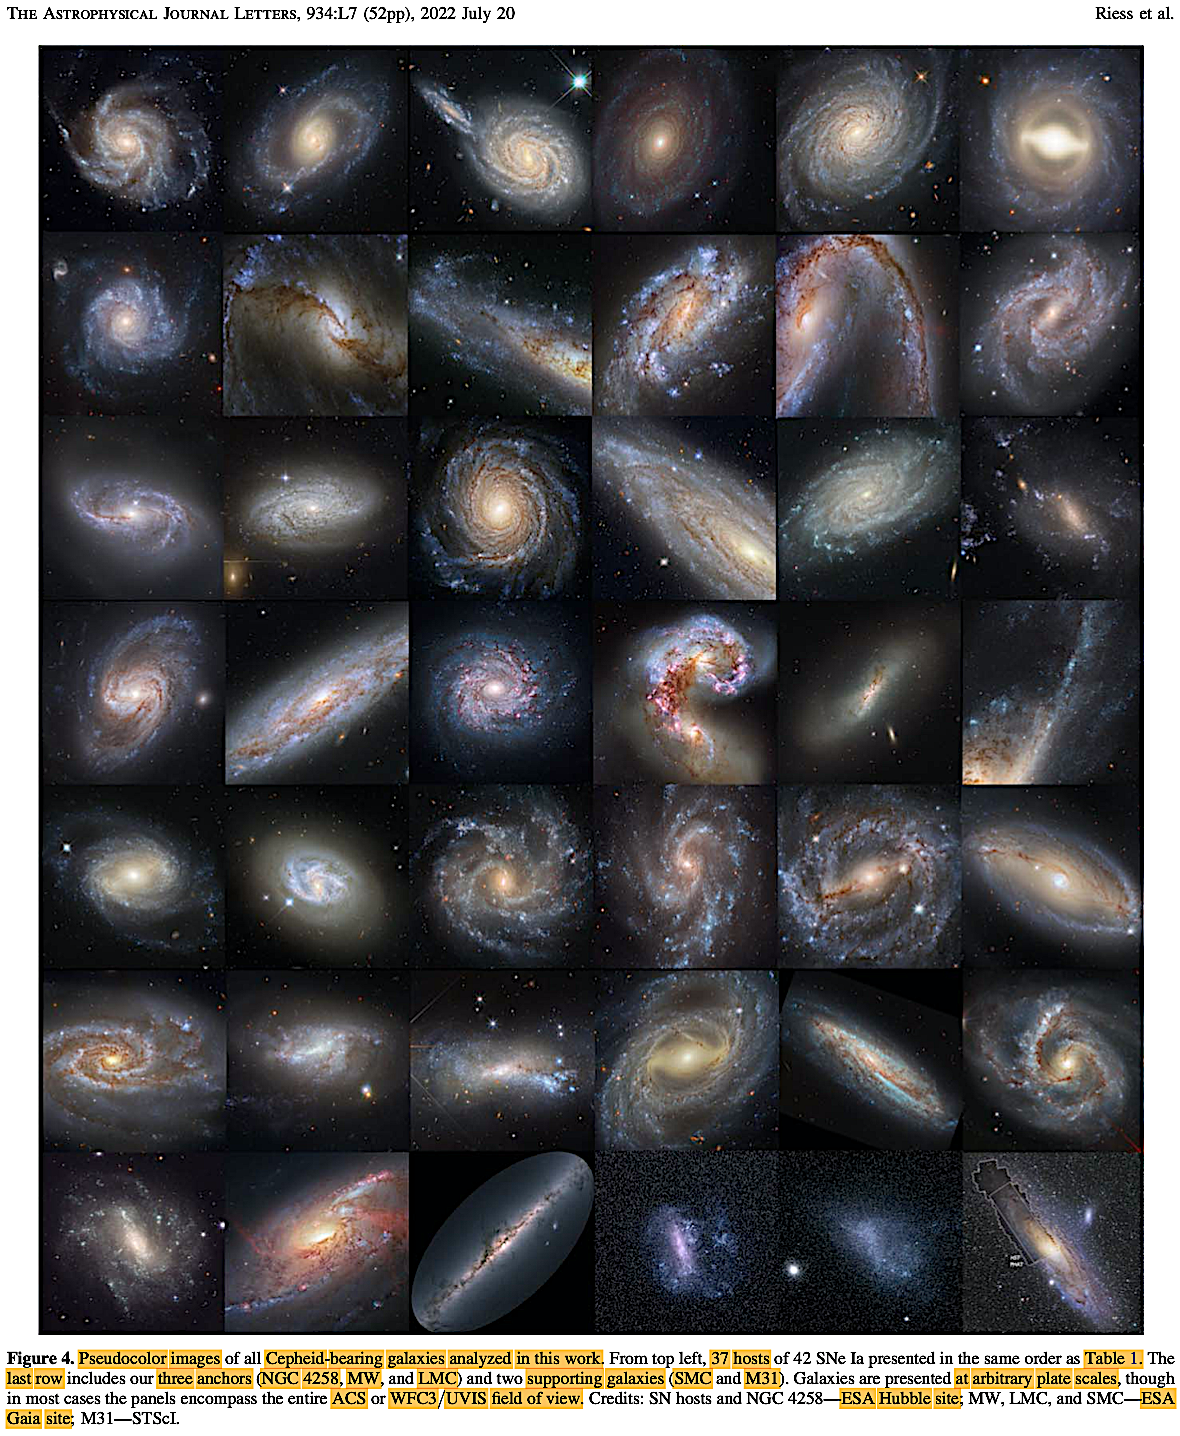
|
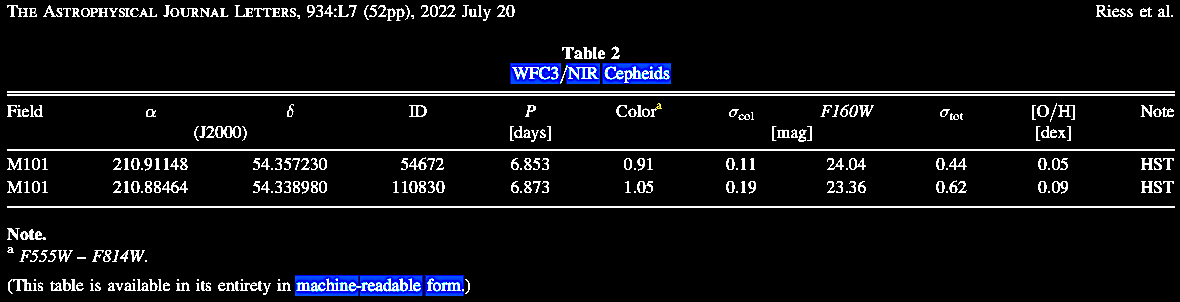 |
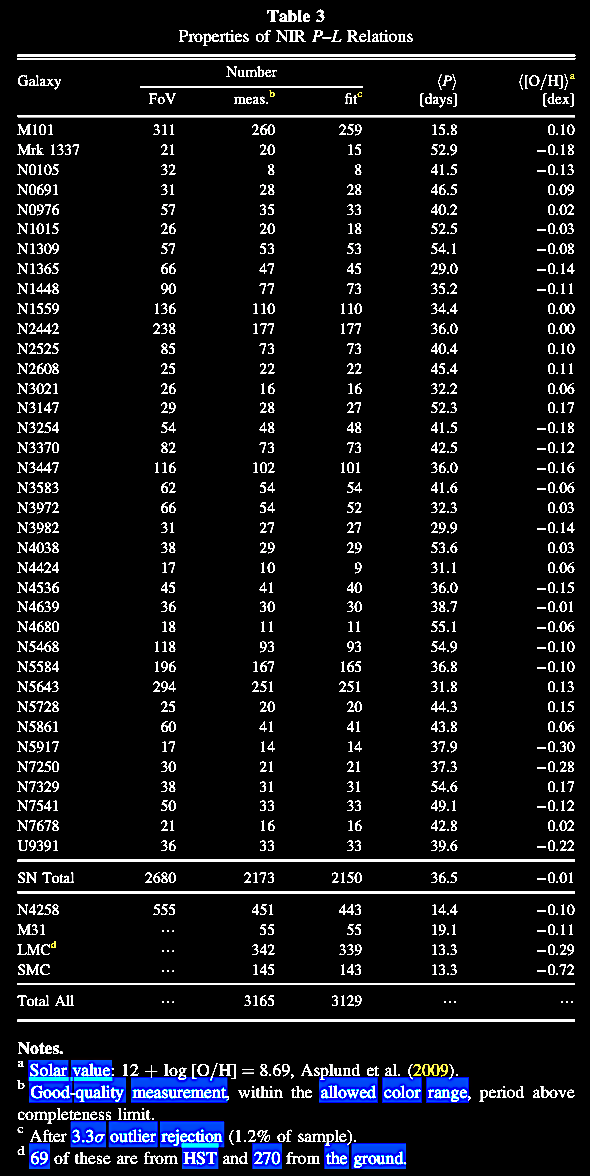 |
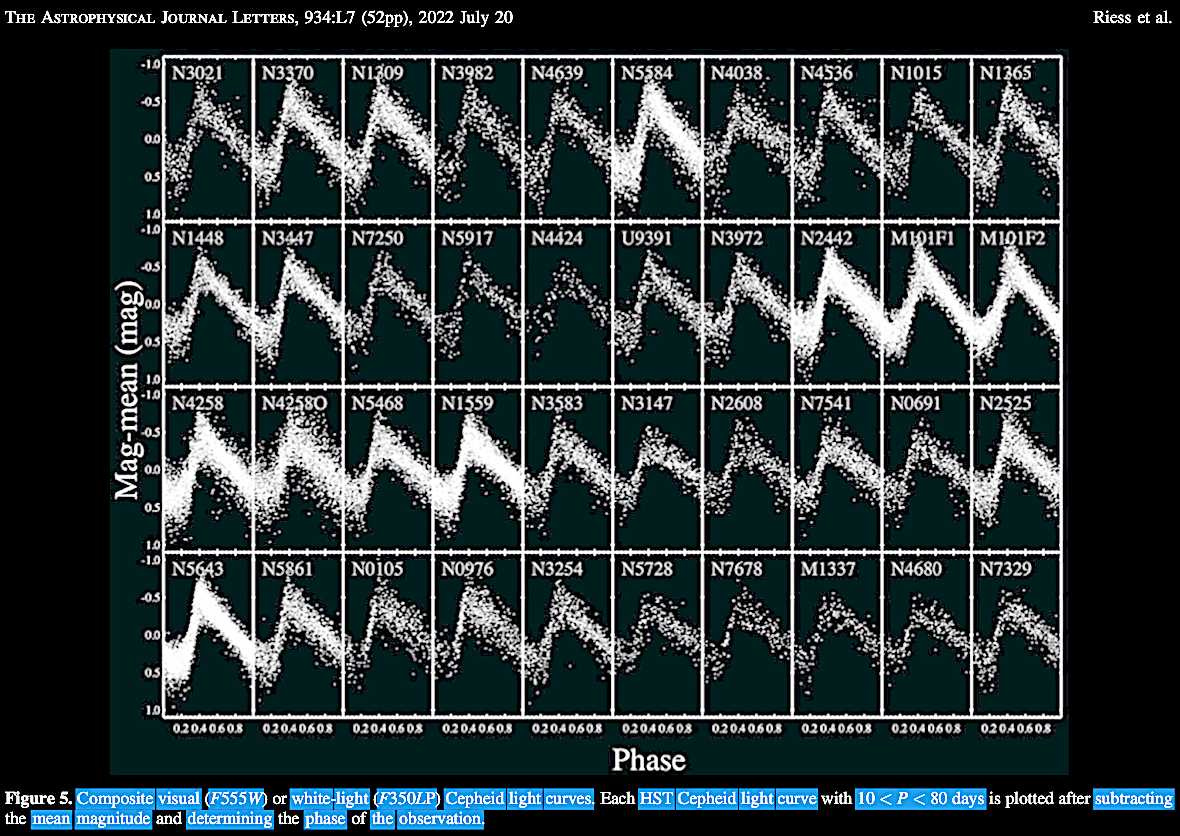
|
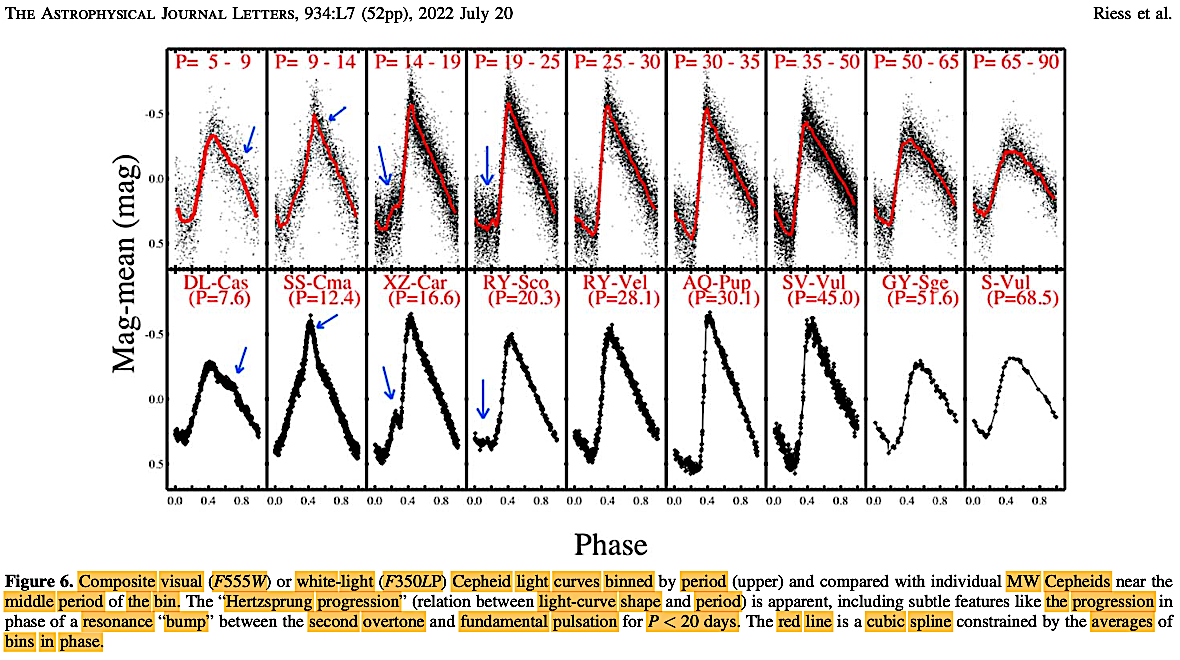
|
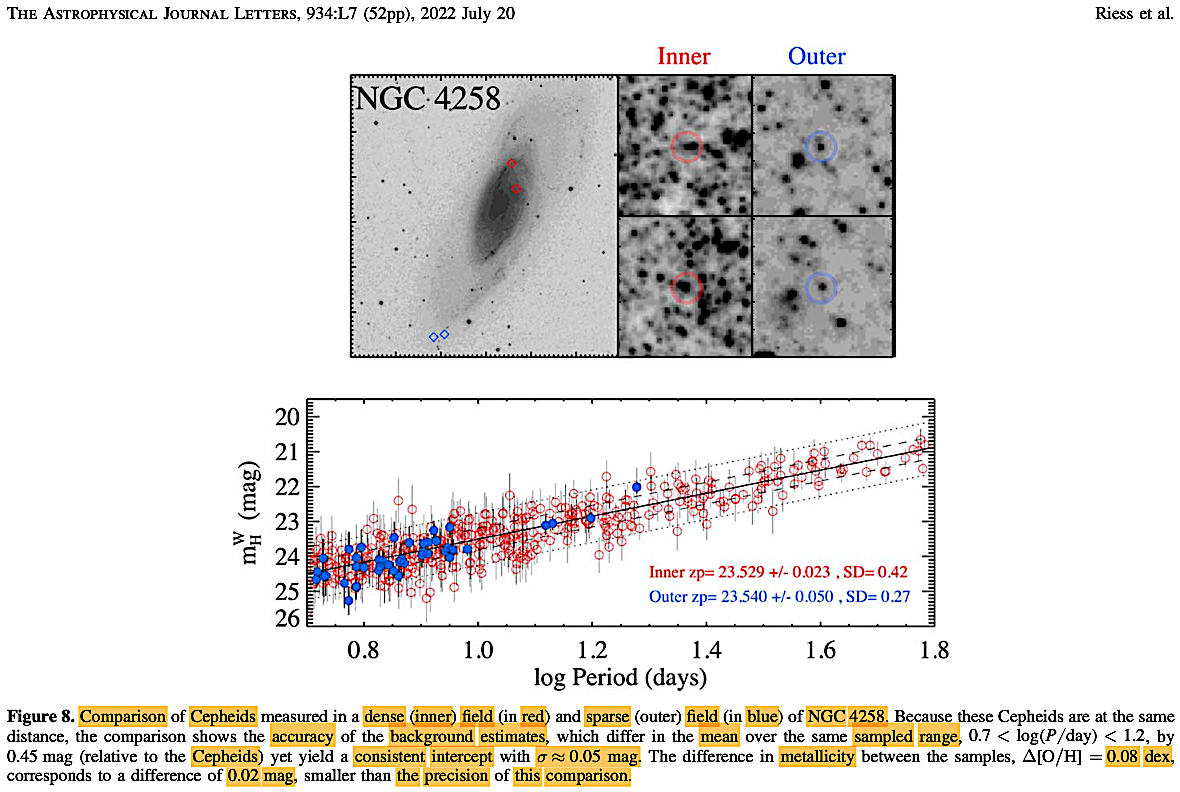
|
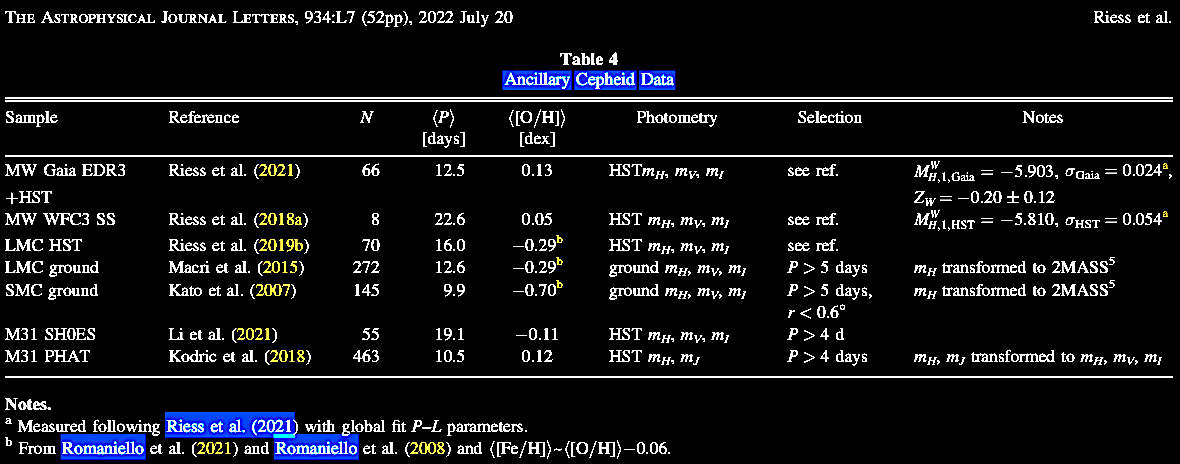
|
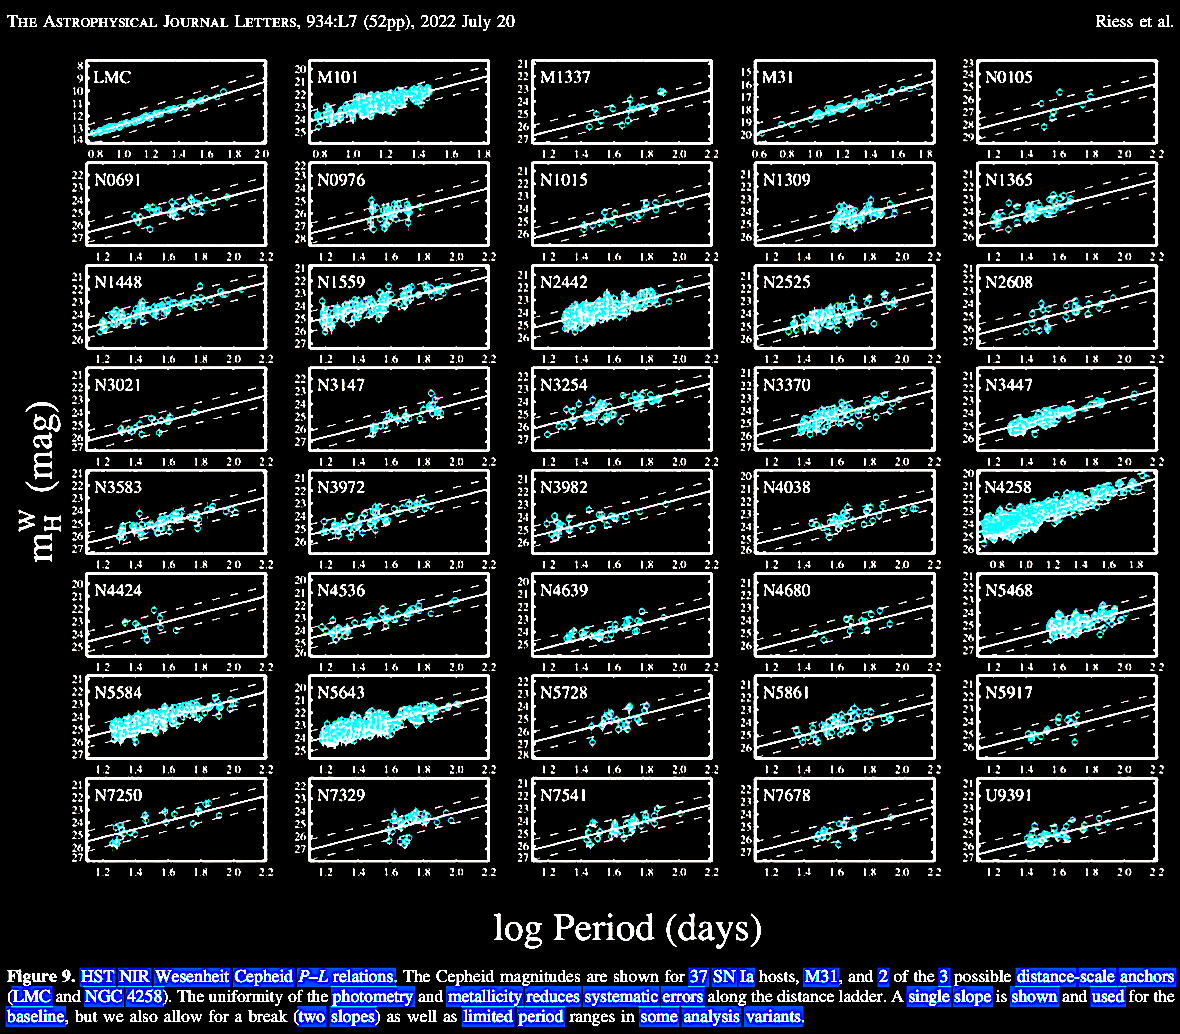
In astrophysics,
the Wesenheit (German for 'essence' or
'nature') function (at a star's passband
magnitudes) is a correction for distance and
reddening by dust to determine visual apparent
magnitude (Wesenheit magnitude). The
function (link)
was developed for Cepheid variable
period-luminosity relations using a color index
and serves as a period-luminosity-color relation
for calibrating the Cepheid P-L relation
(see also paper's Appendix D, Use and misuse of Wesenheit
magnitudes; pp. 48-50, including the literature
citations).
|
 |
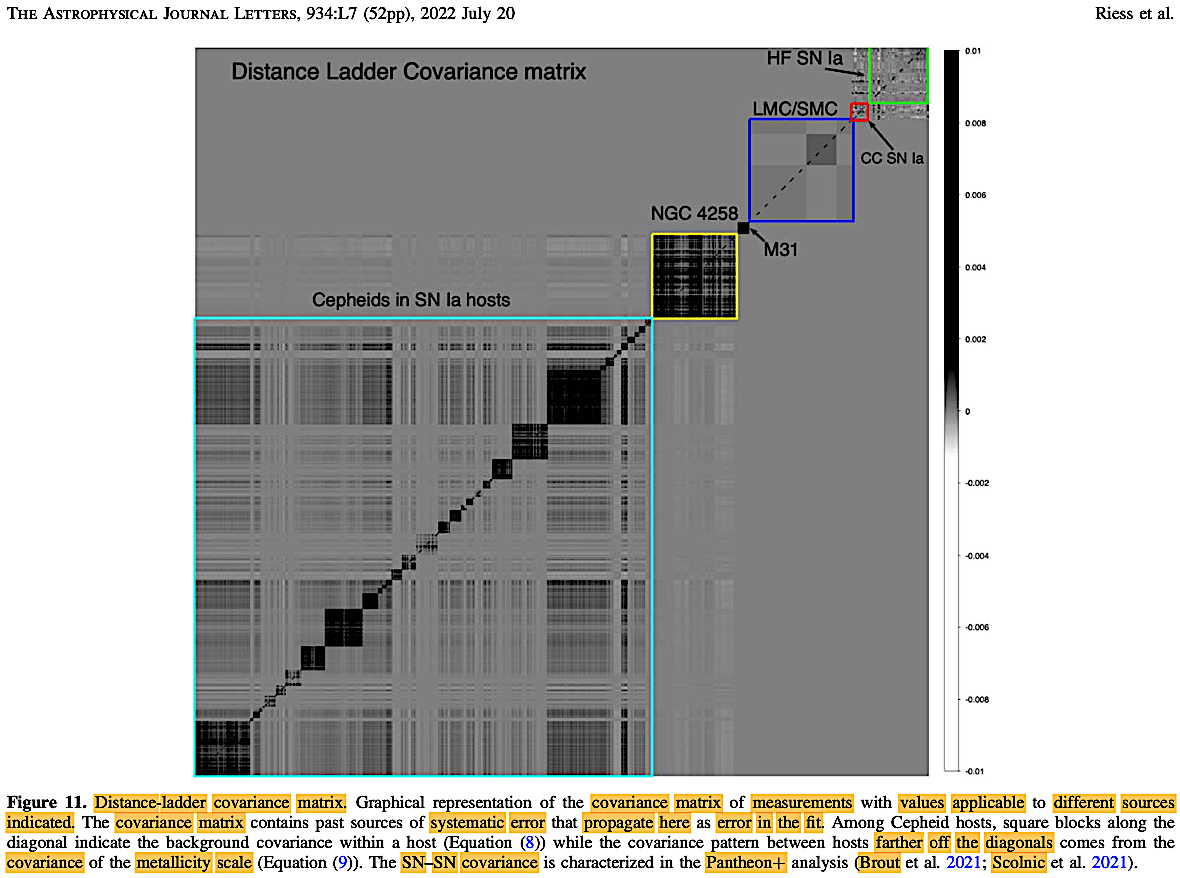 |
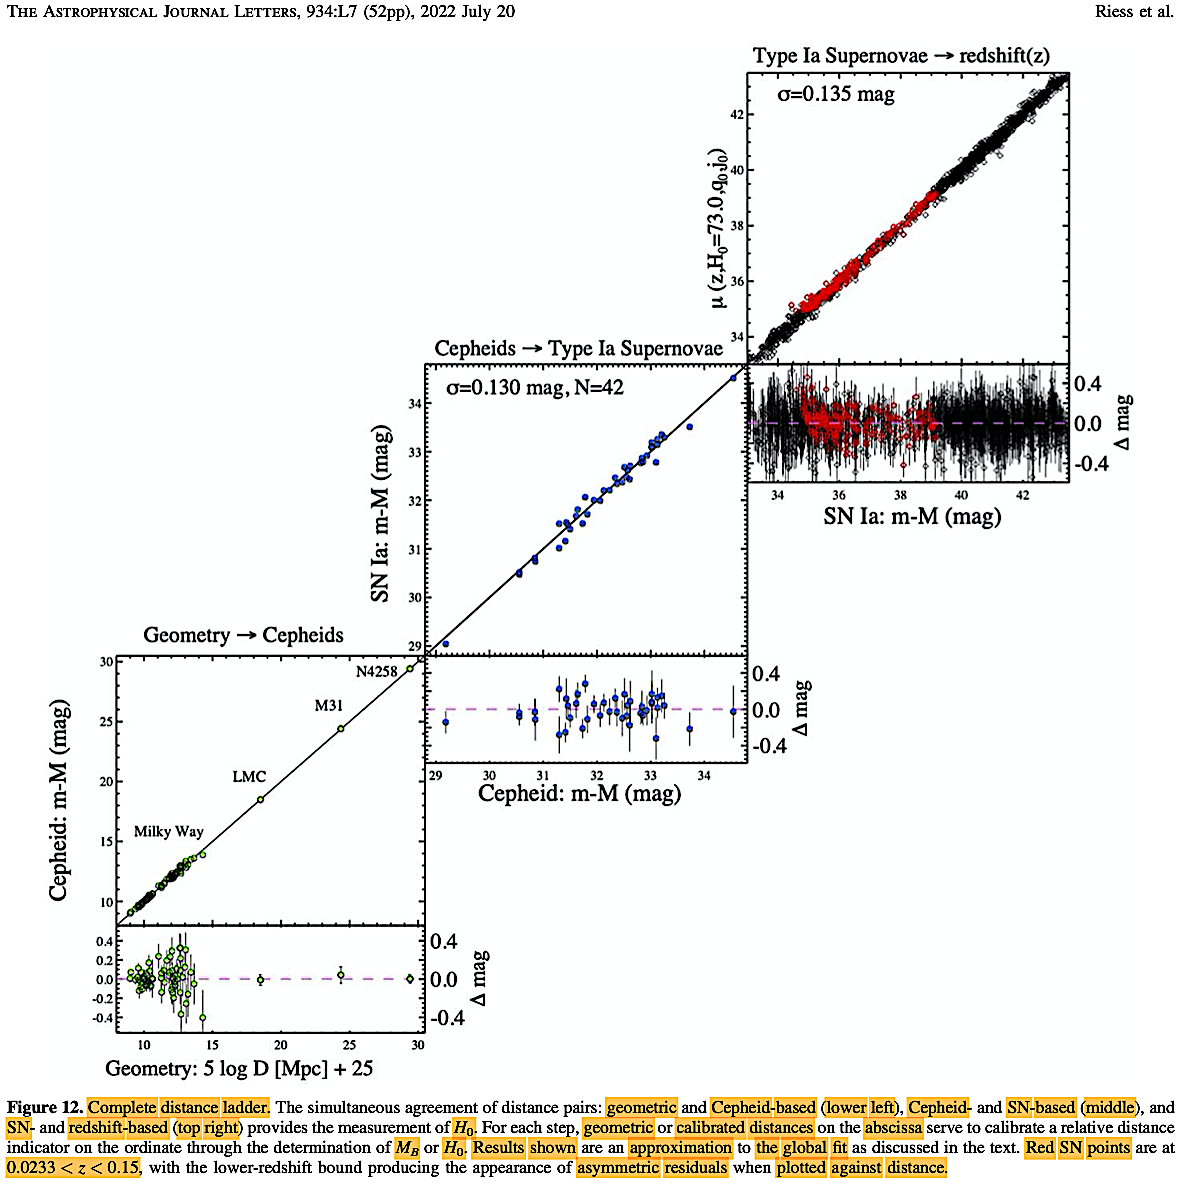
|
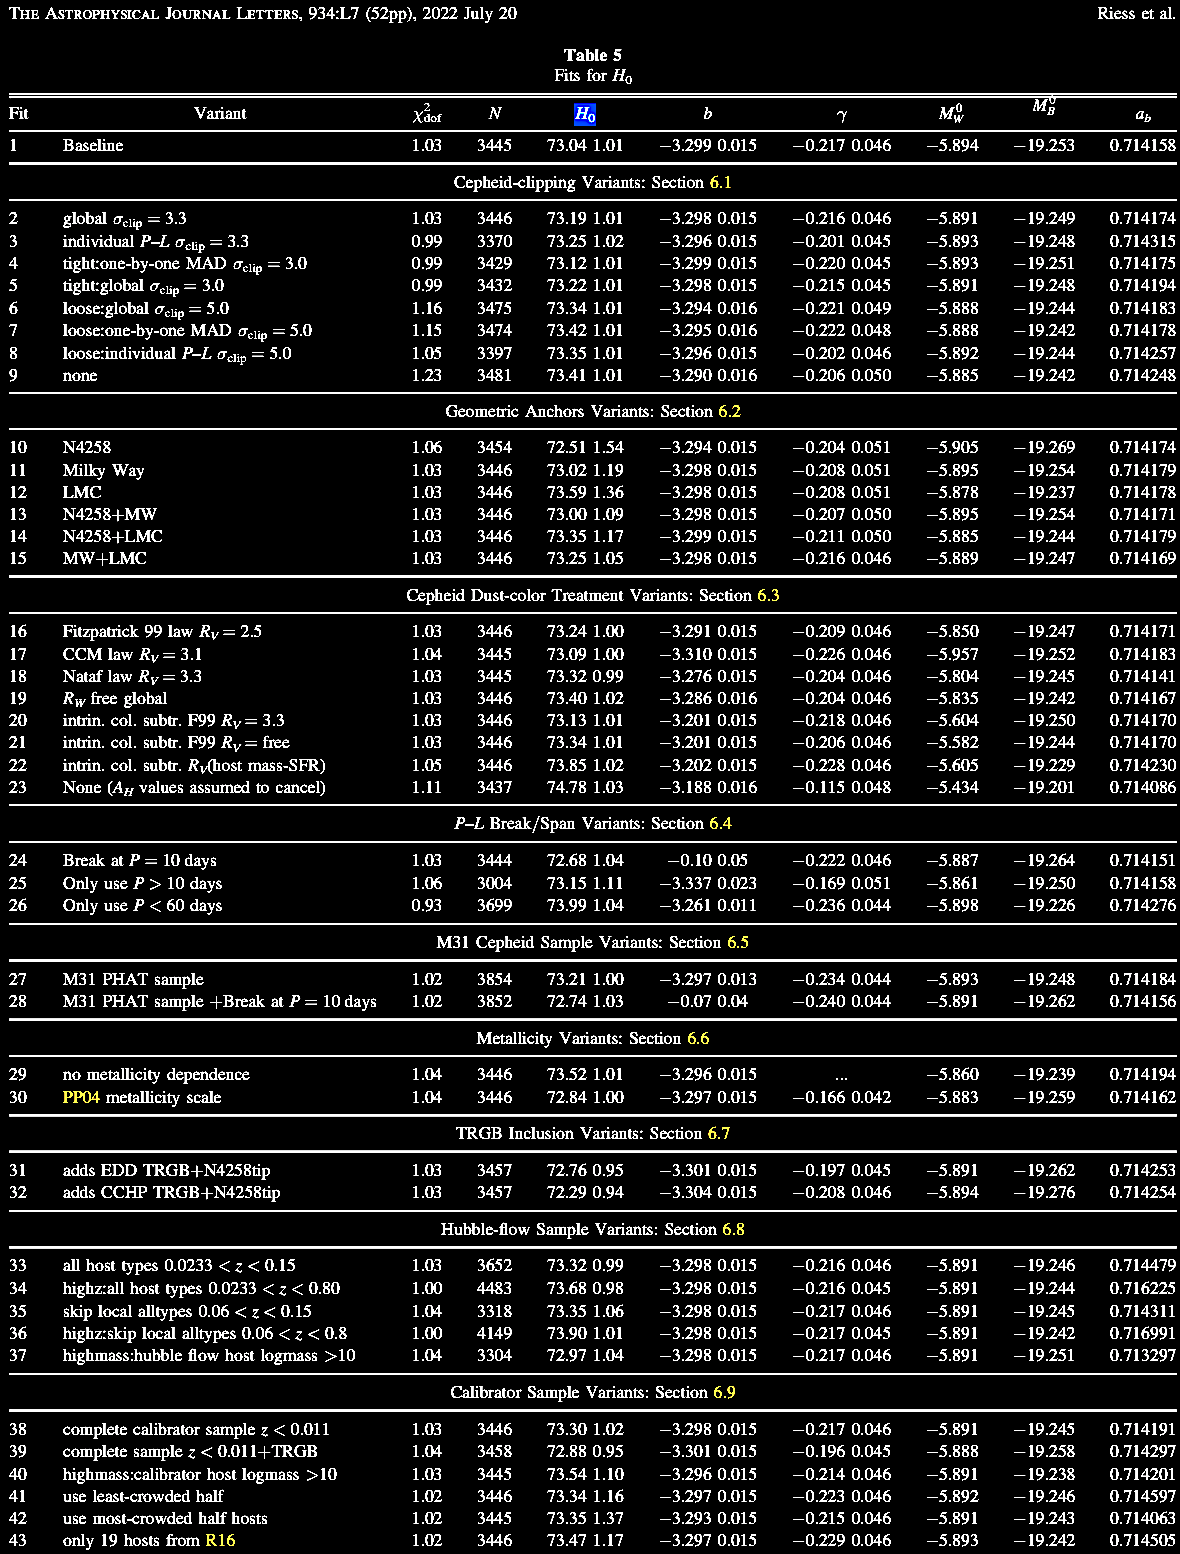
|
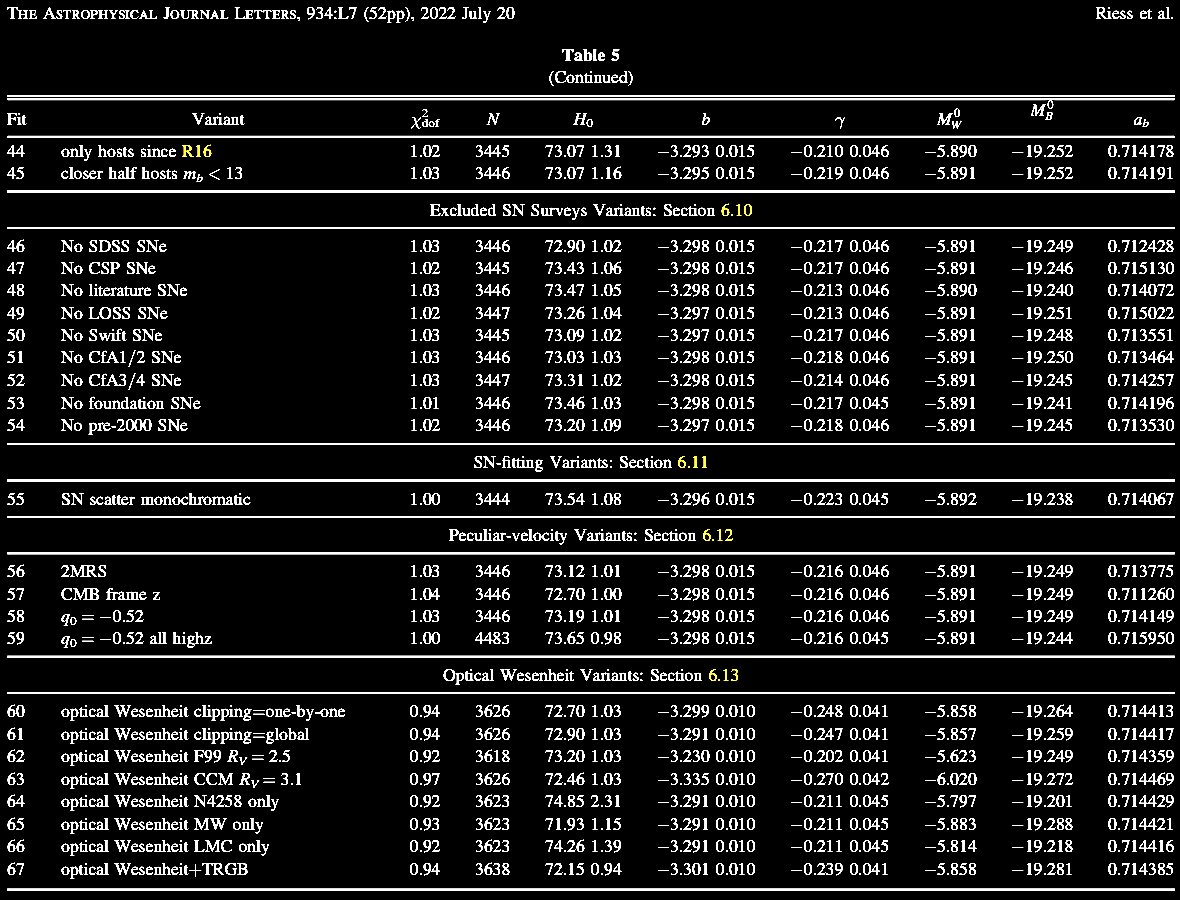
|
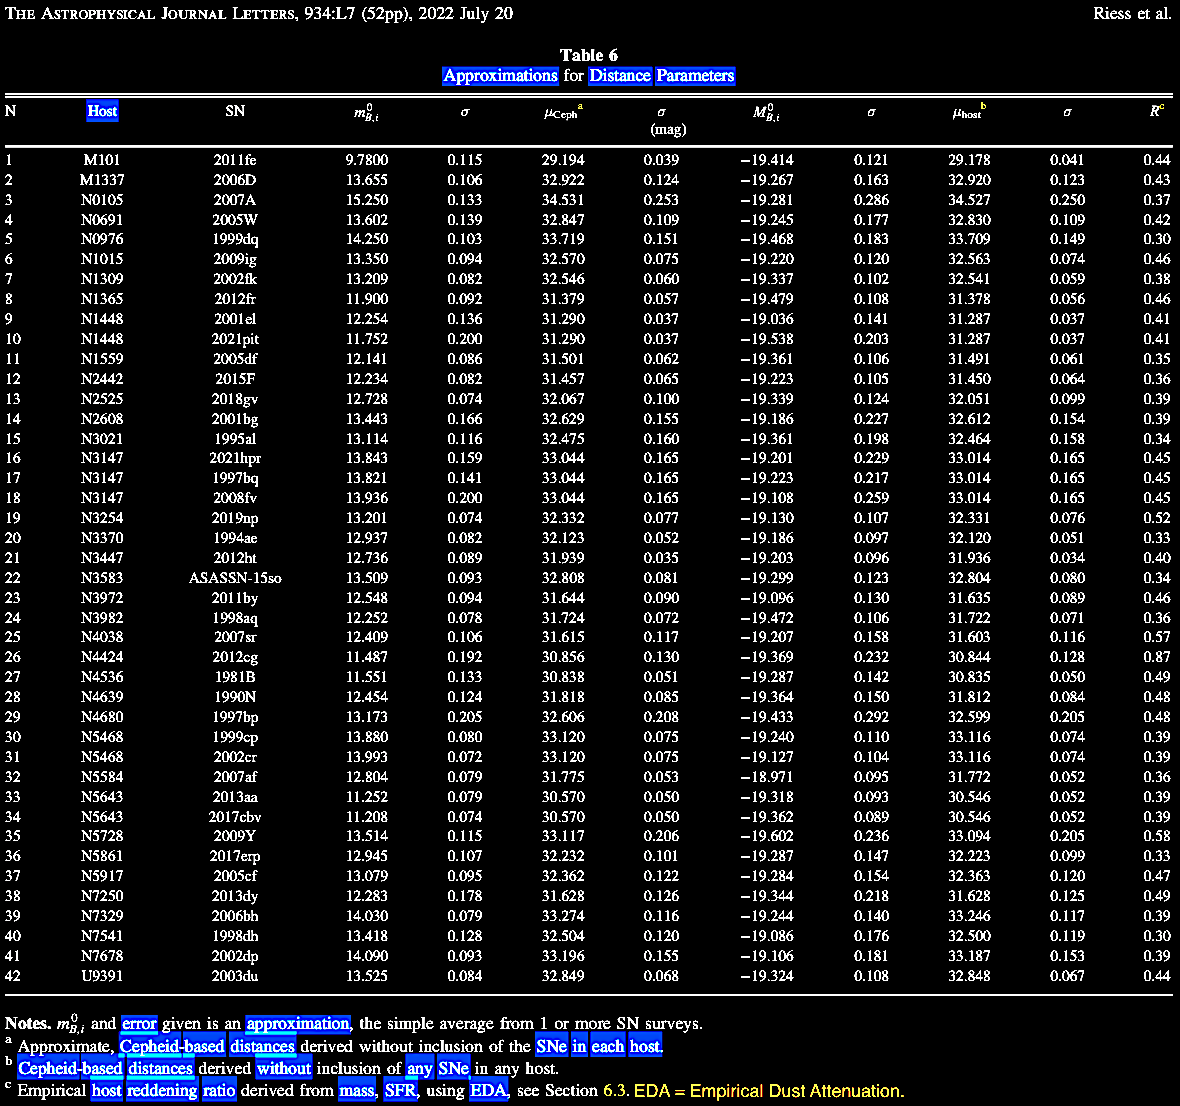
|
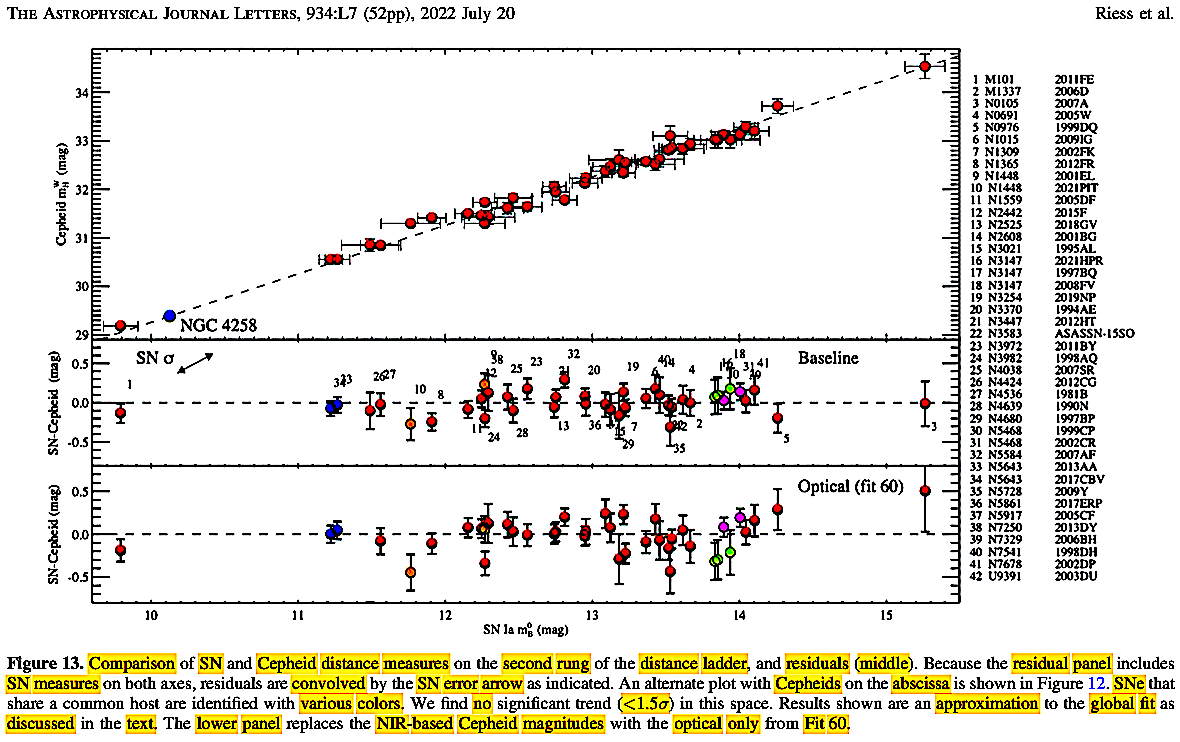
|
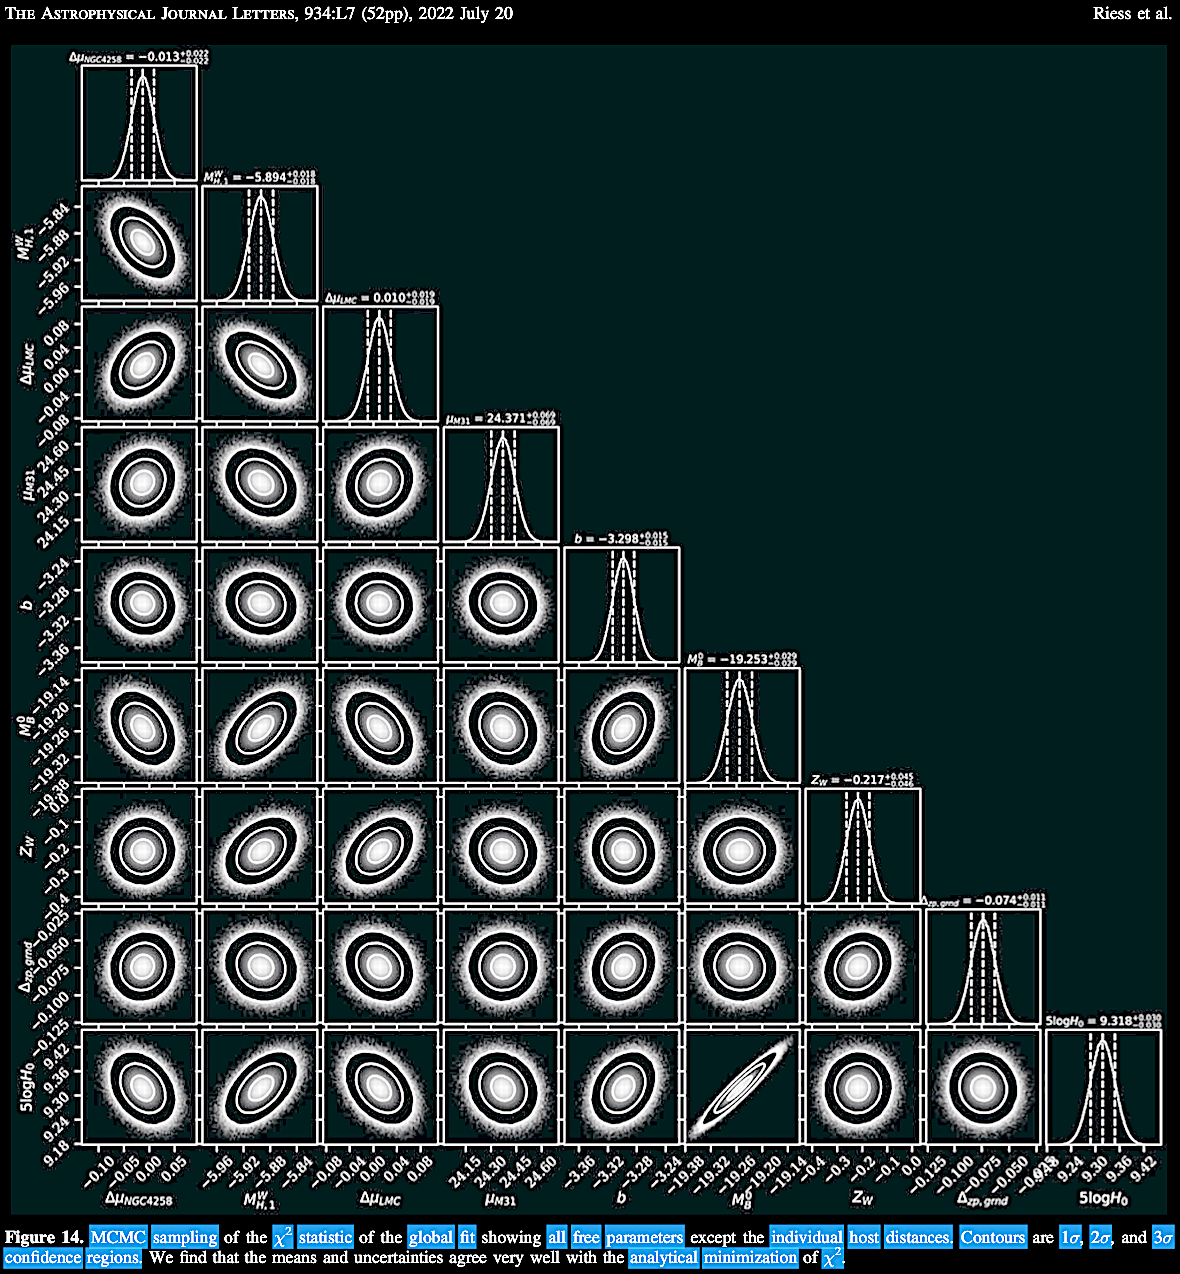
|
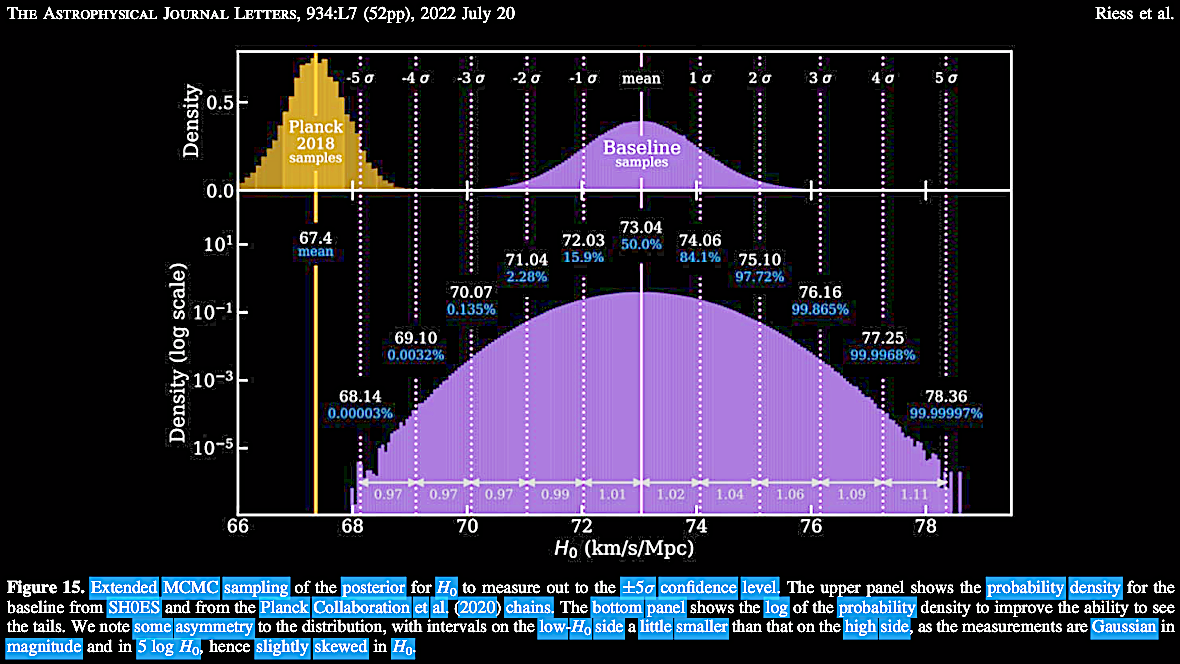
|
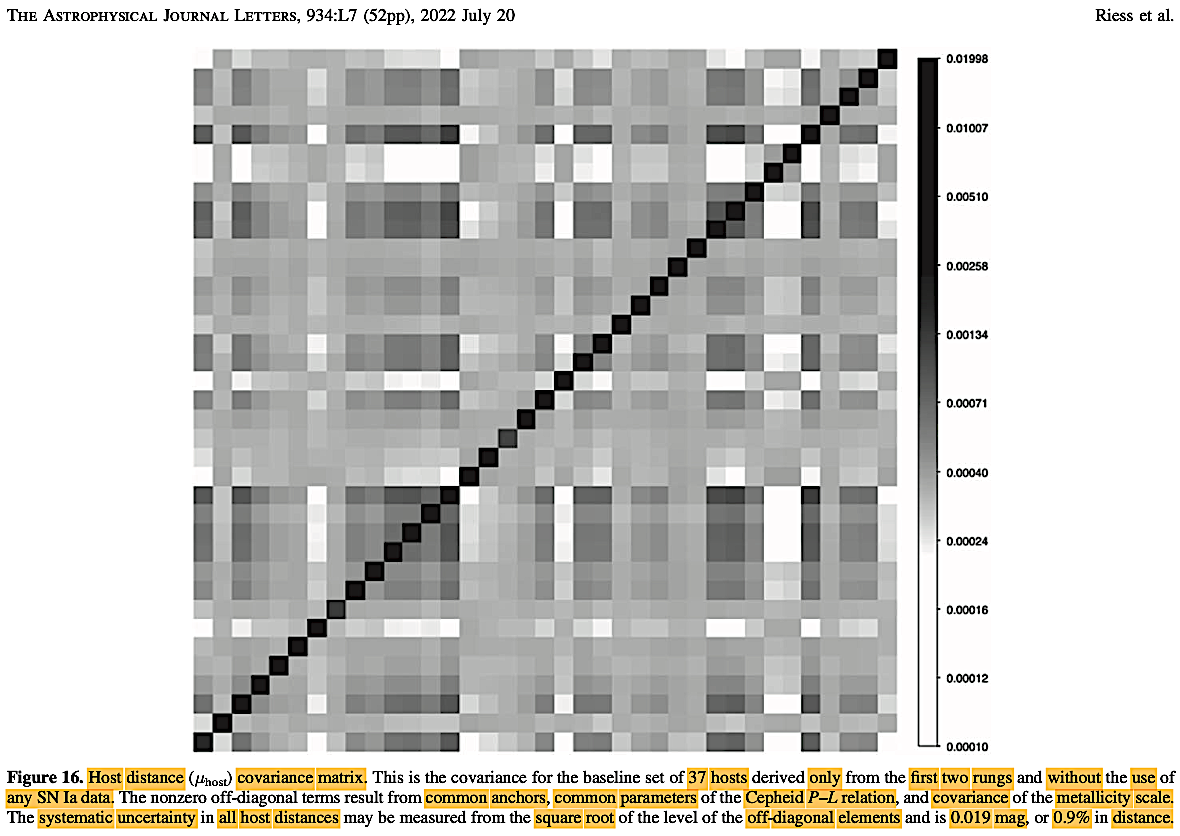 |
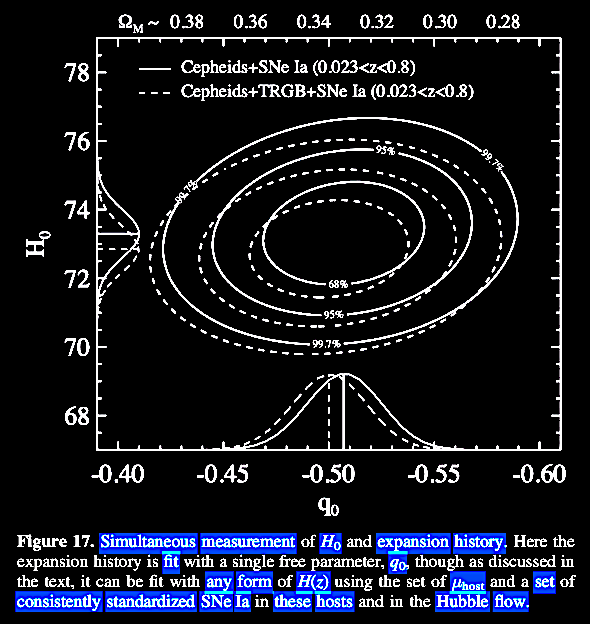
|
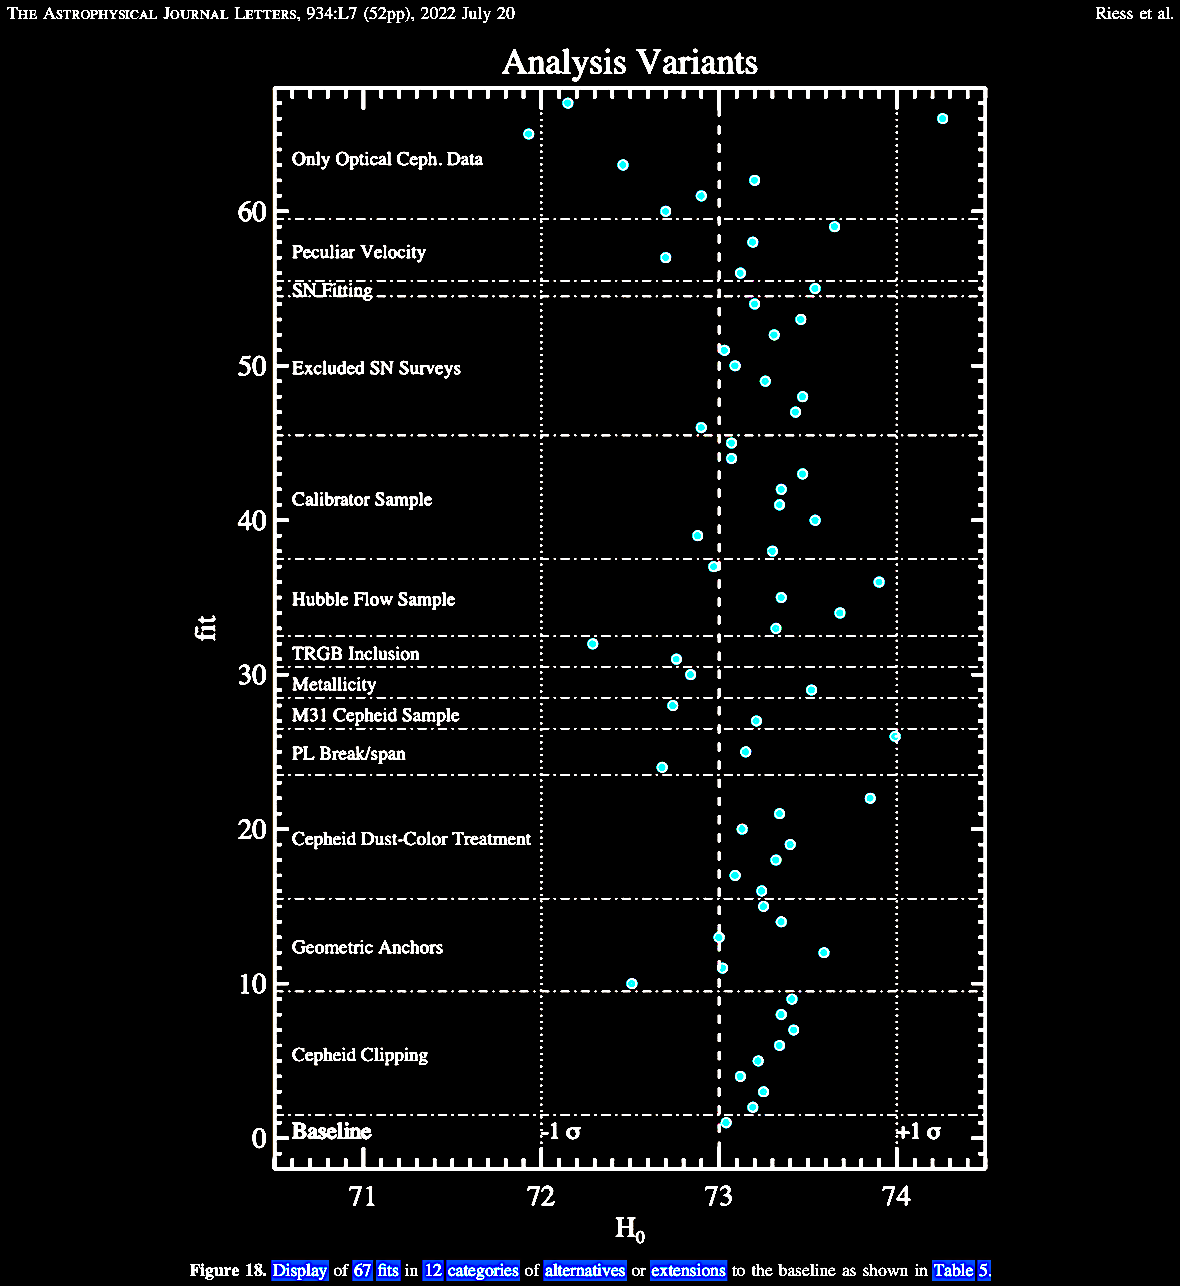
|
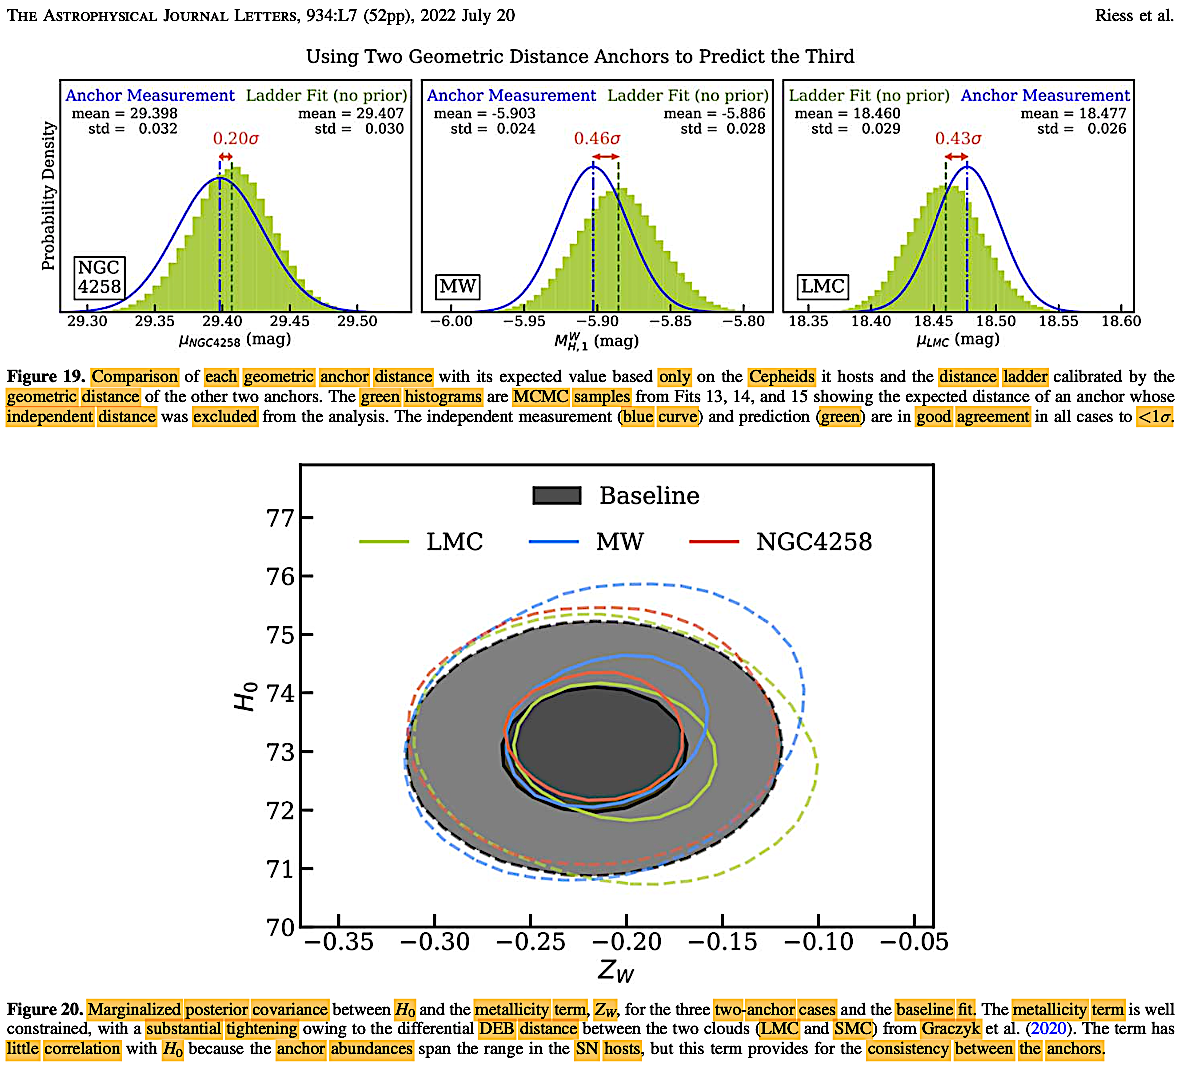
|
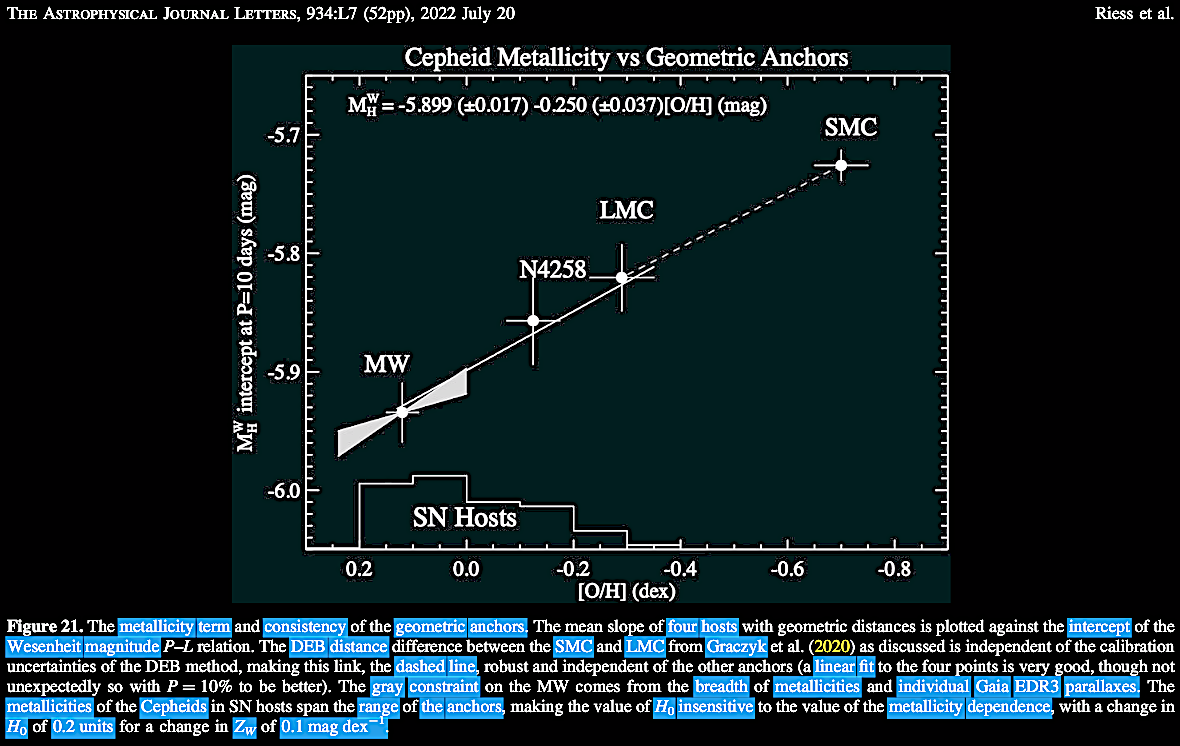
|
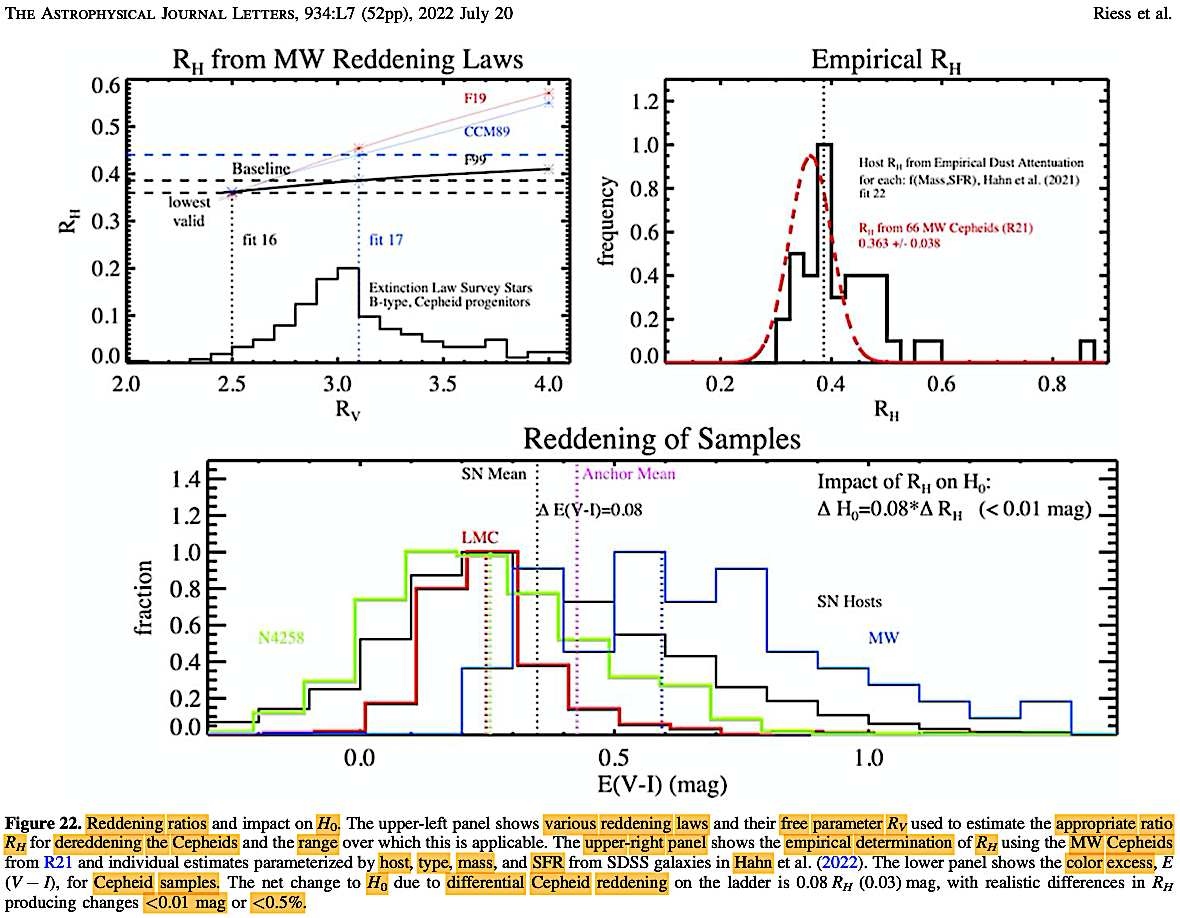
|
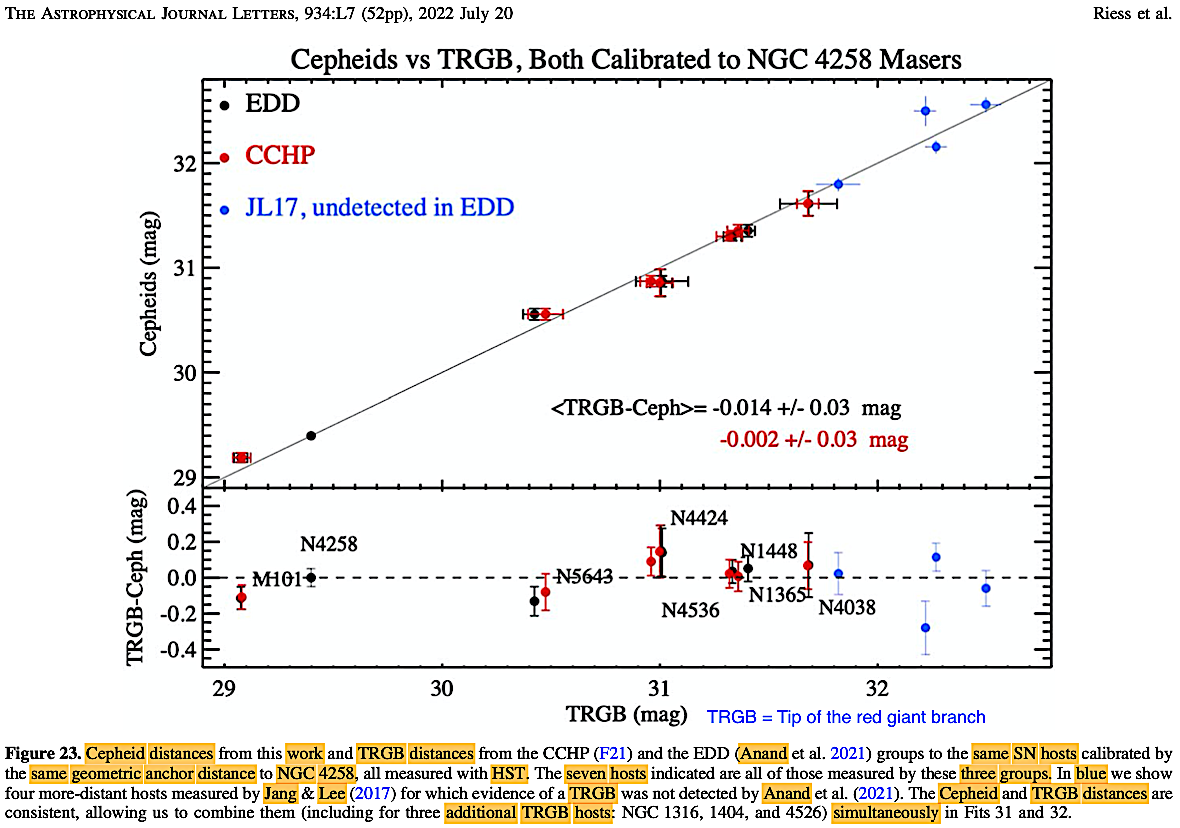
|
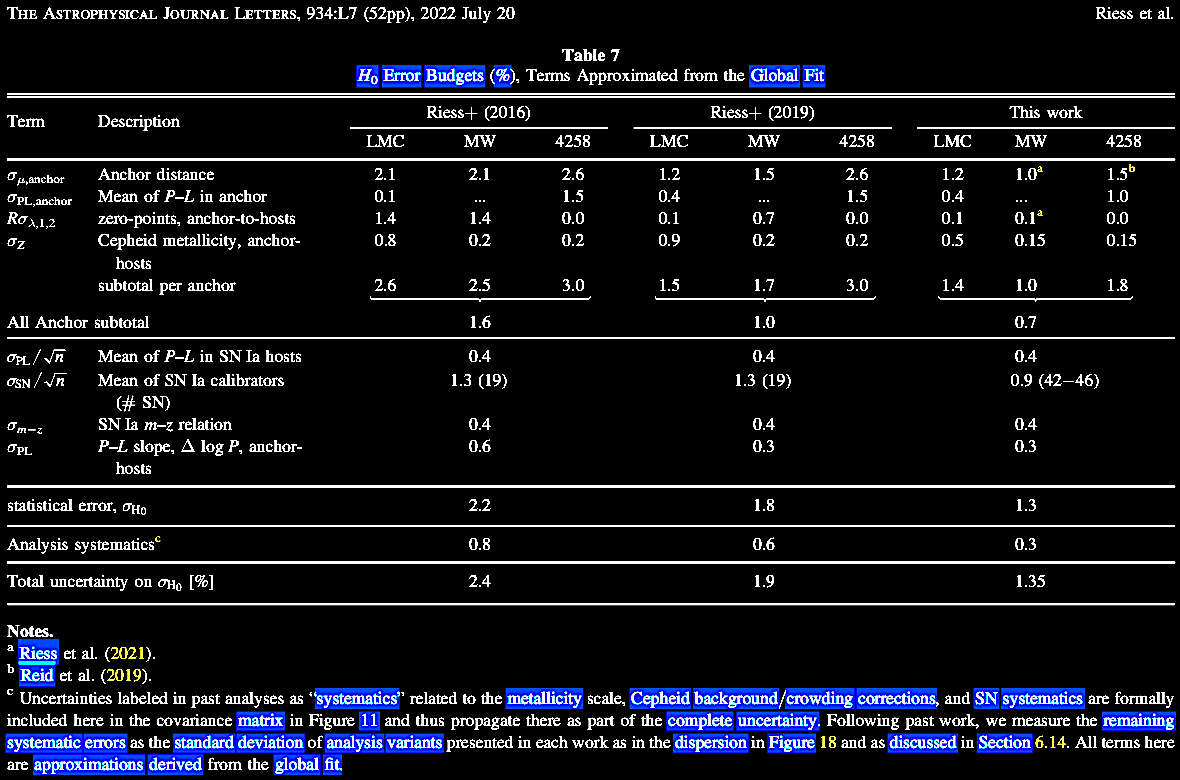
|
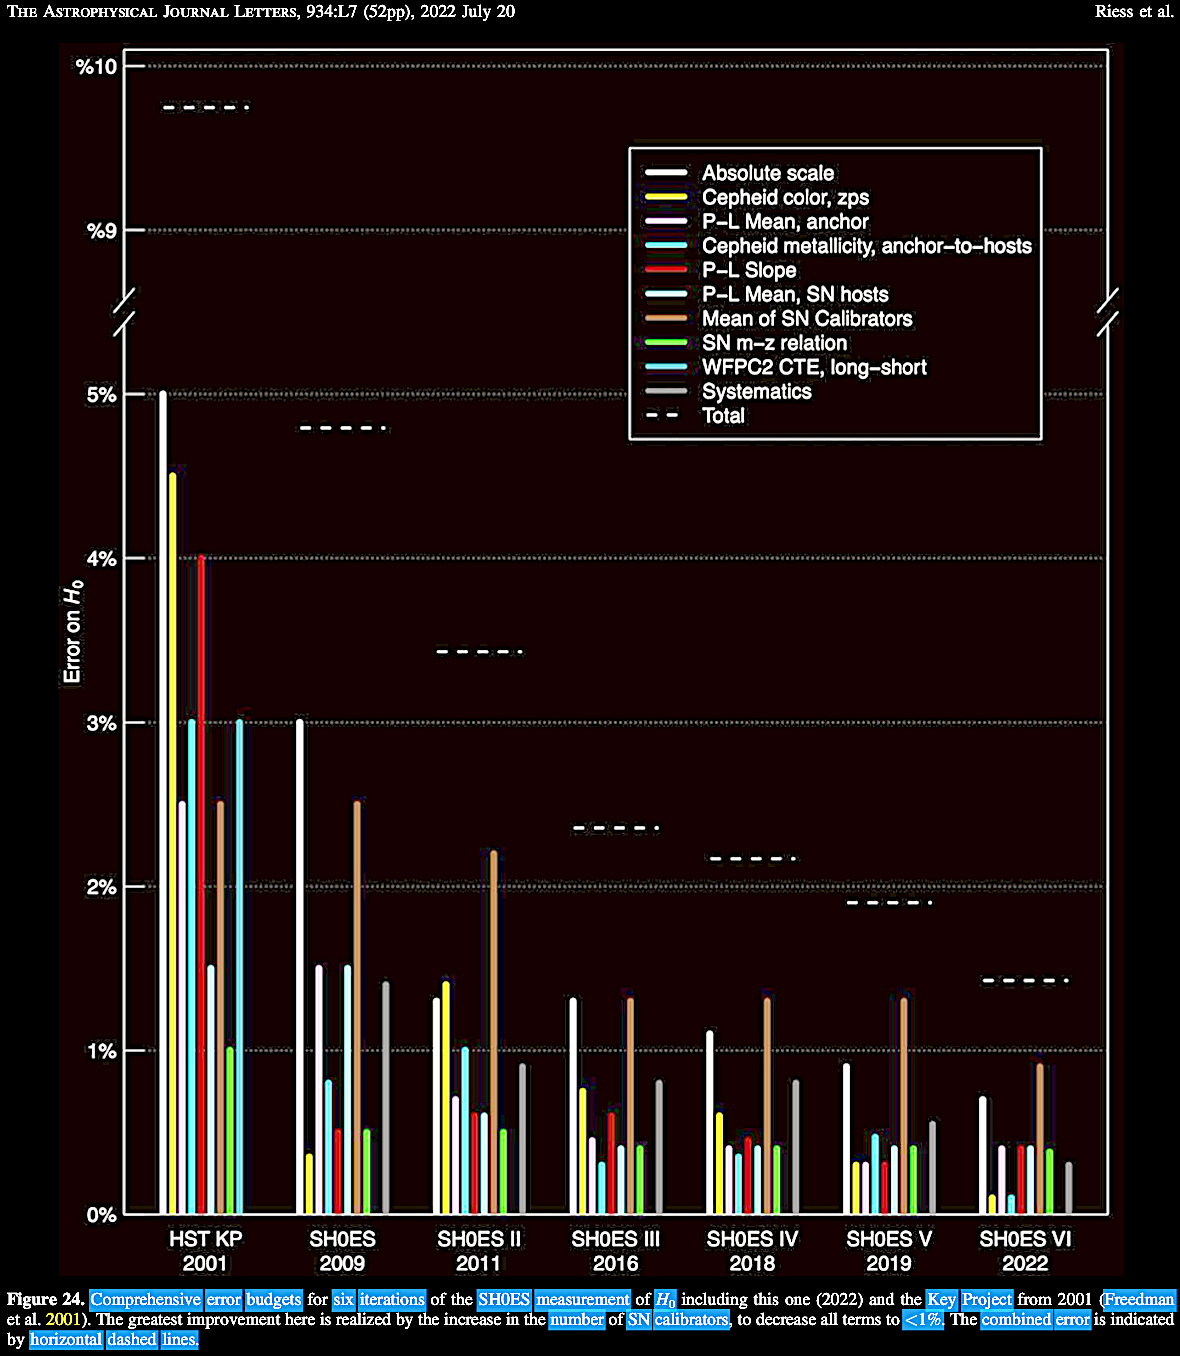 |
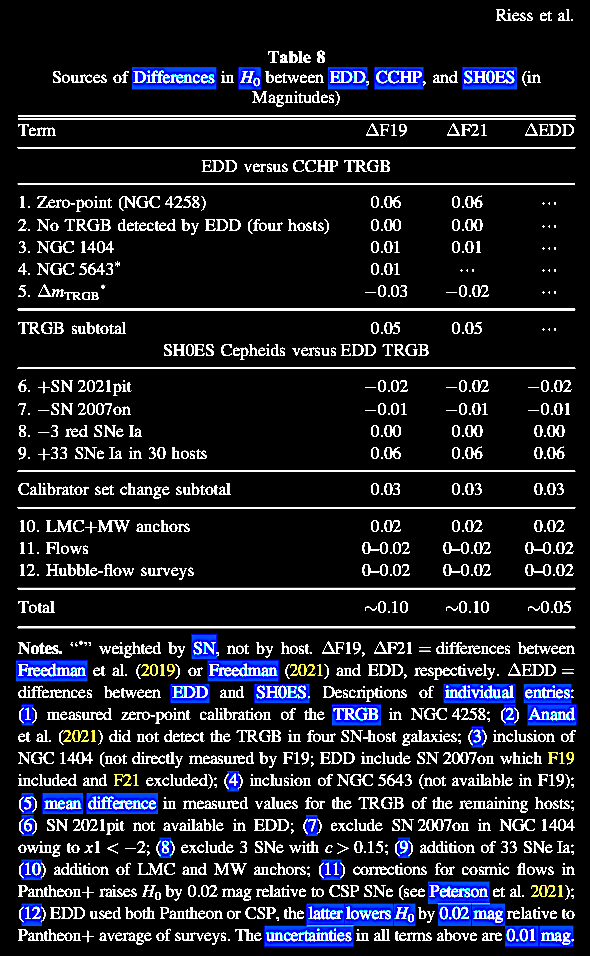 |
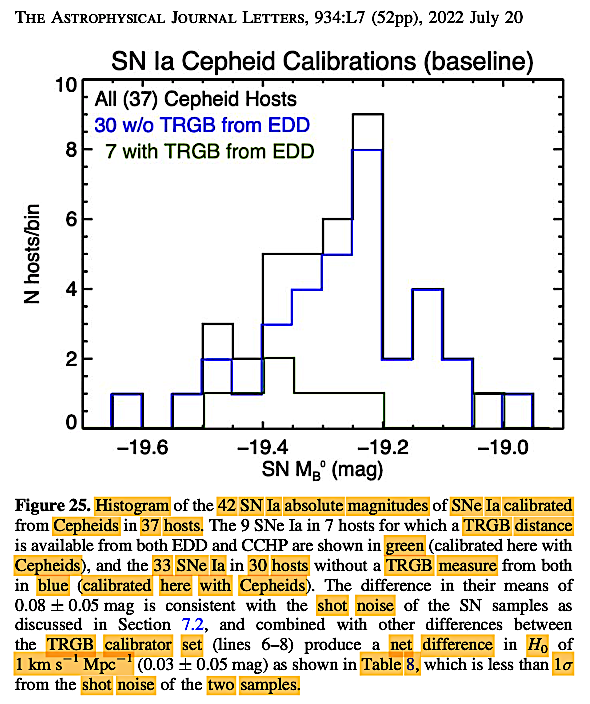 |
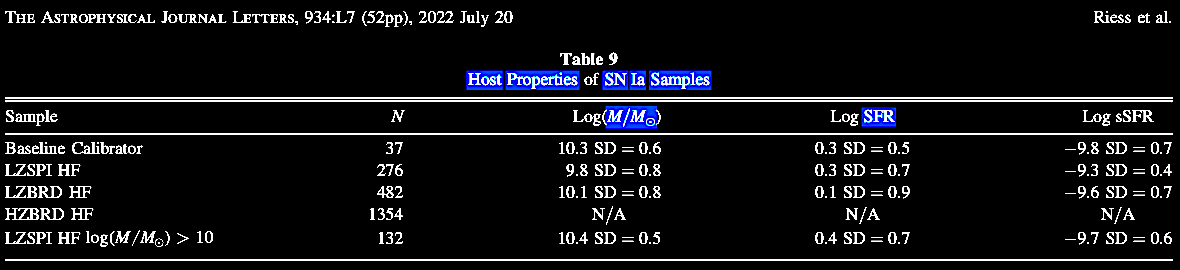
|
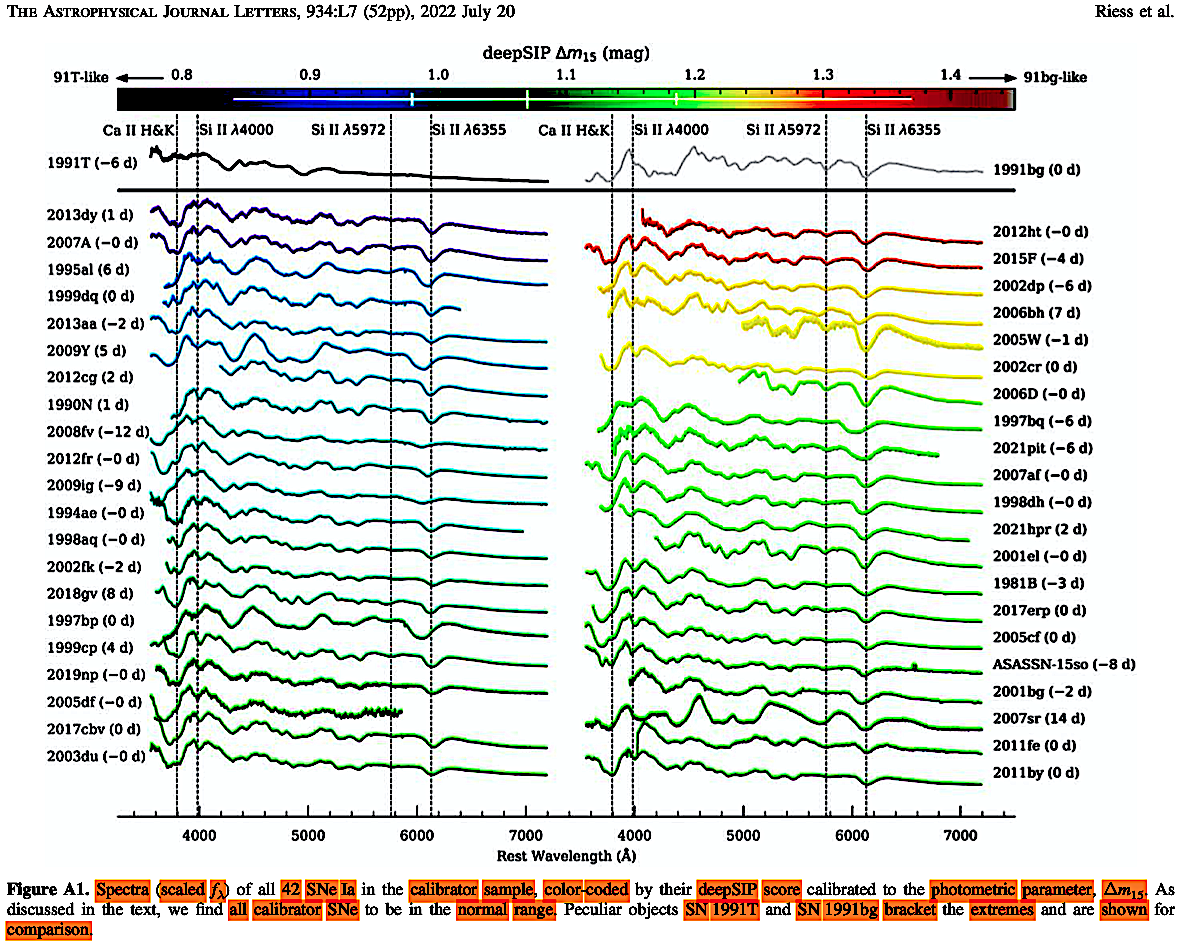
|
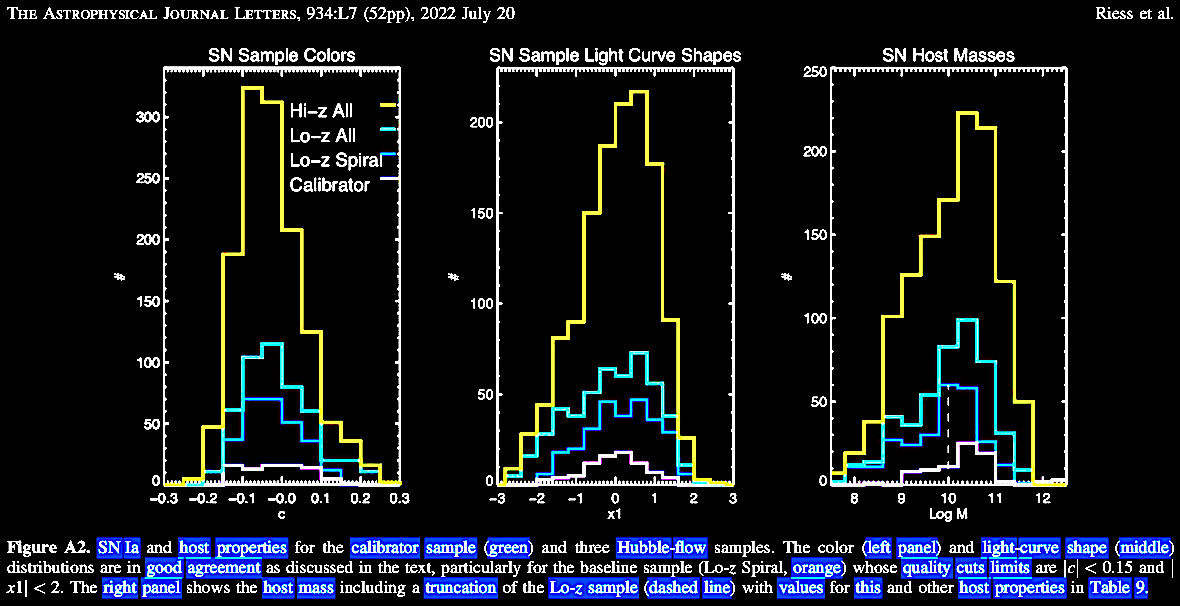
|
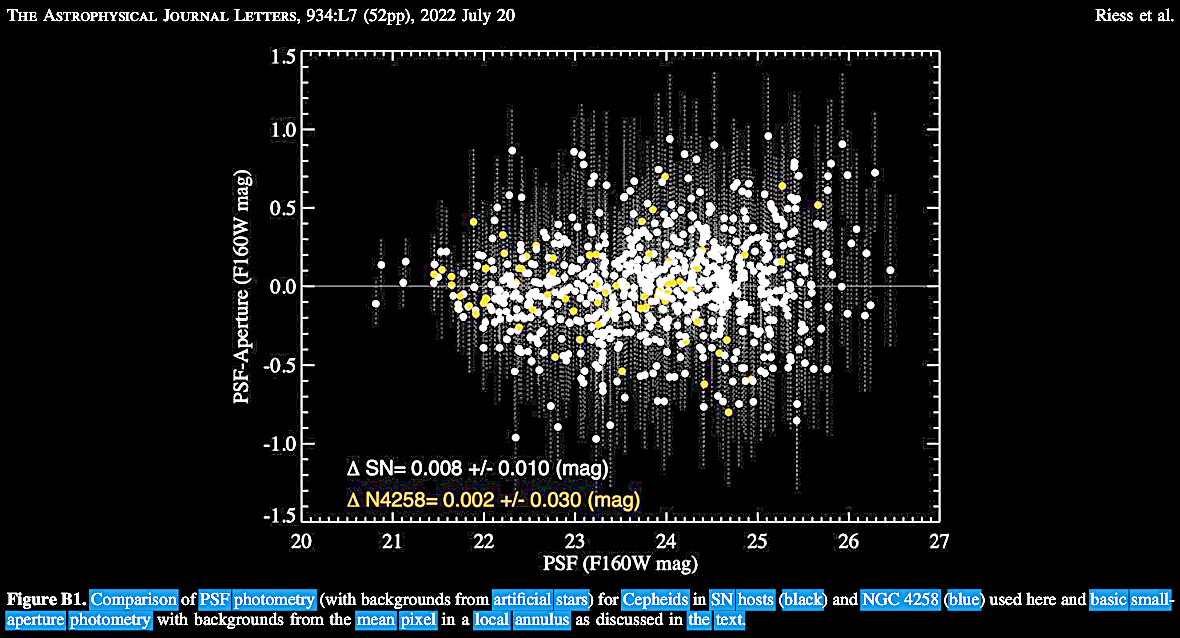
|
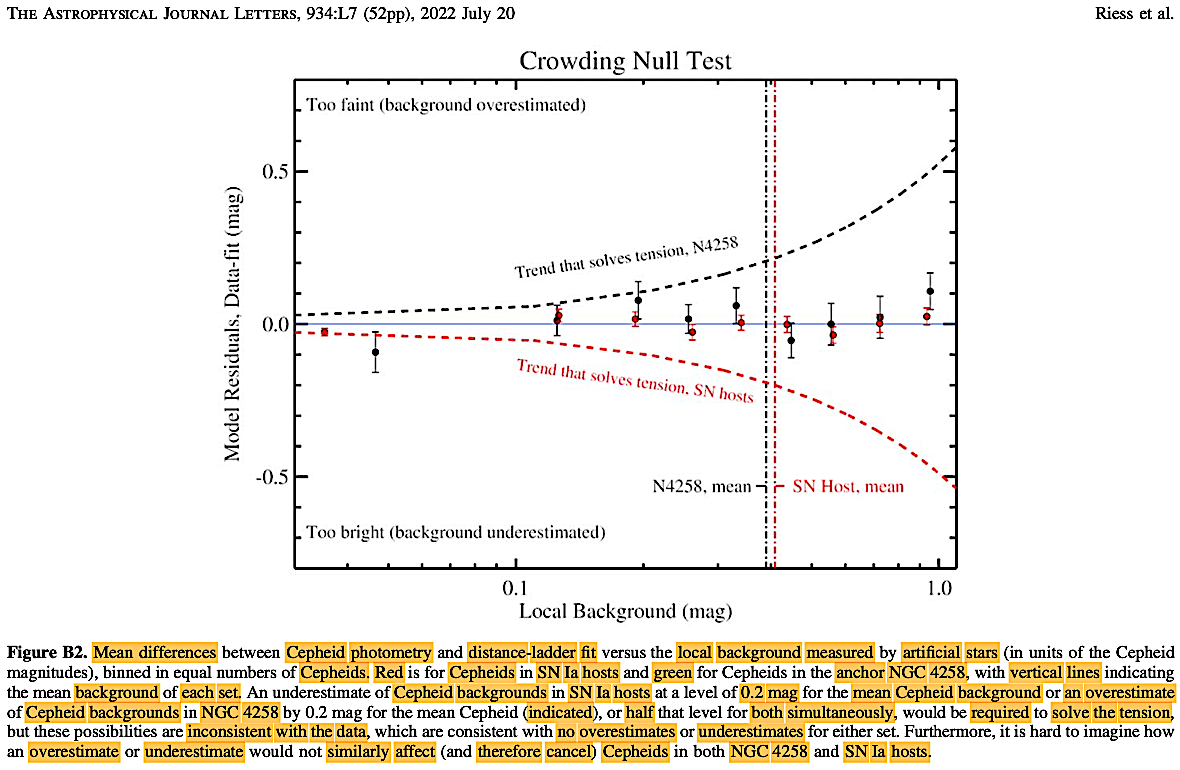
|
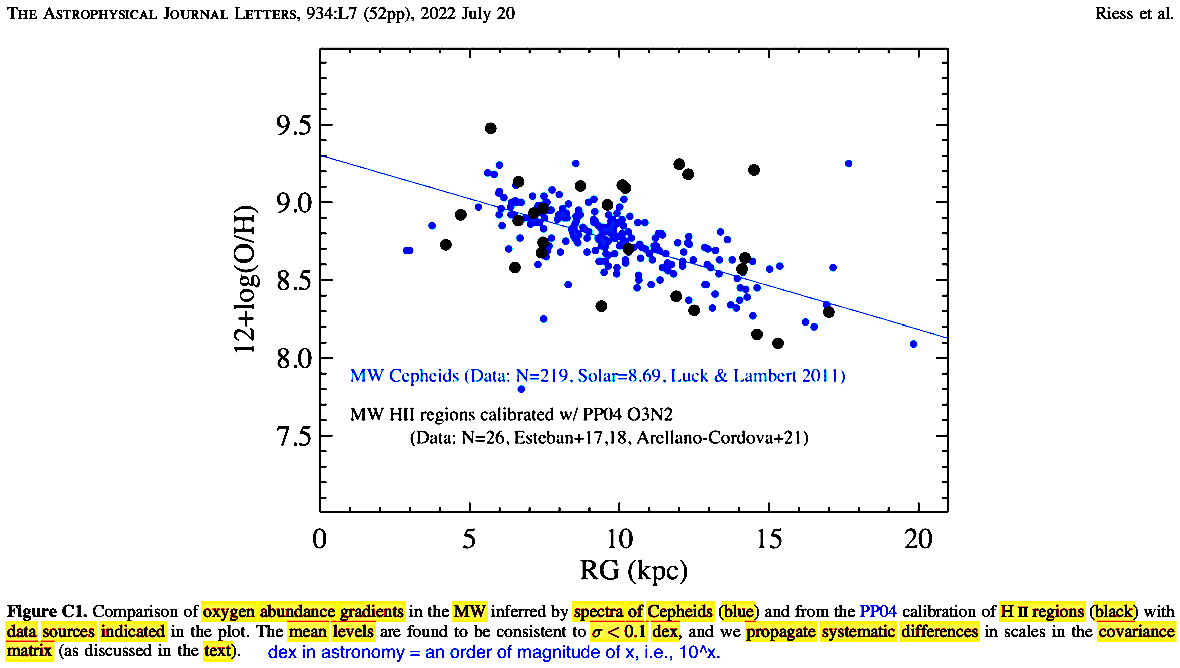
|
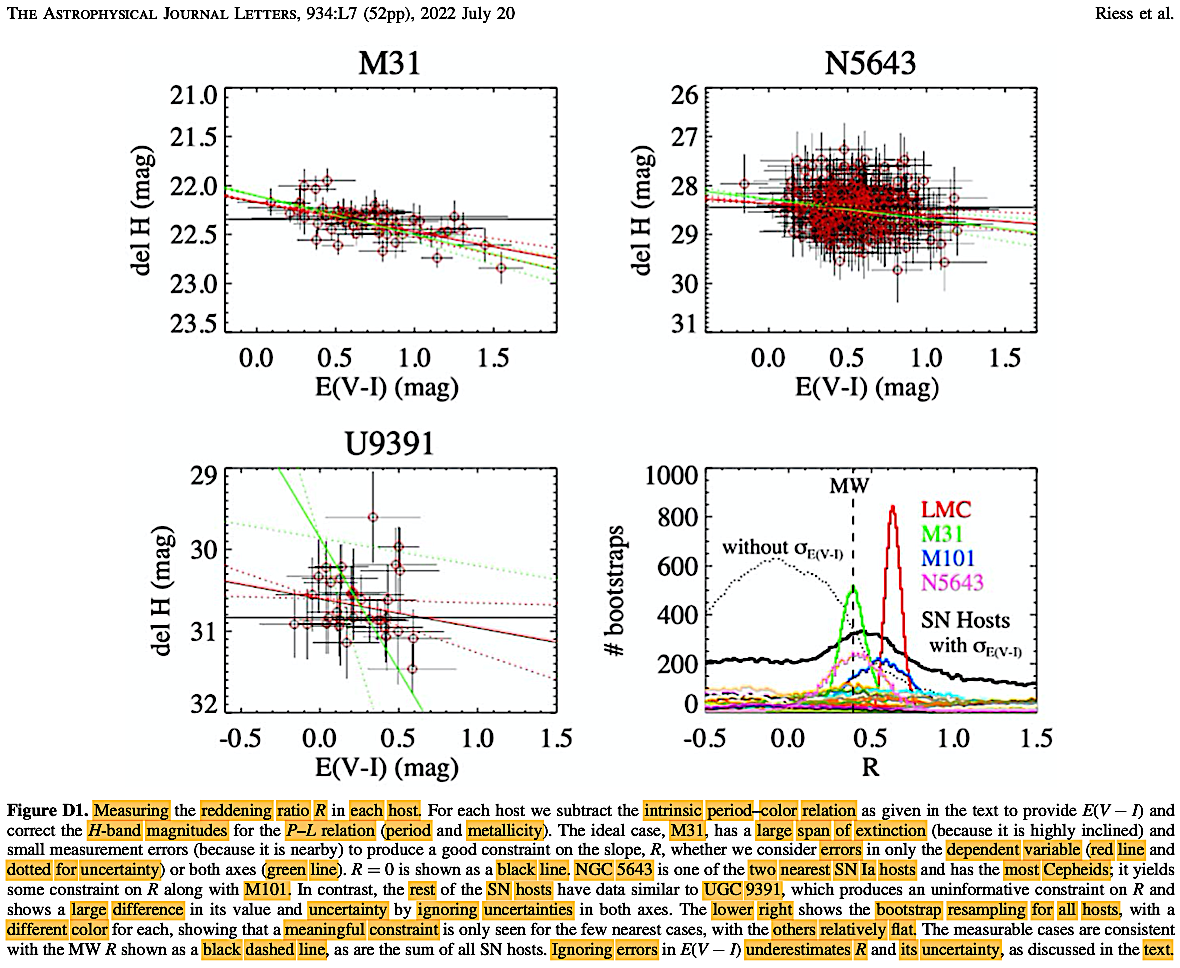
|
Riess et al. (2022).
A followup paper
by the Riess
team came with
further data on
anchor galaxies
NGC 4258 and NGC
5584: Riess, A.
et al.
2023. Crowded no
more: The
accuracy of the
Hubble constant
tested with
high-resolution
observations of
cepheids by
JWST. (arXiv
release 28 July
2023: https://arxiv.org/abs/2307.15806).
ApJ Letters
956, L18.
https://doi.org/10.3847/2041-8213/acf769.
They examined
>320 Cepheids
in these two
anchor galaxies
across two
observational
epochs with the
JWST NIRCAM, at
a median
distance in the
HST SH0ES data
set to determine
if there had
been a
photometric bias
with the HST
data set. JWST
with its far
superior source
separation
resolution was
able to largely
rule out
source-crowding
confusion in the
HST data set
while achieving
a >2.5X
reduction in
dispersion of
Cepheid
period-luminosity
(P-L)
relations from
0.45 to 0.17
mag, yielding an
increased
individual
Cepheid
precision from
20% to 7%. The
JWST-HST
differences in P–L
relation
intercepts are
slight with 0.00
± 0.03 mag for
NGC 4258 and
0.02 ± 0.03 mag
for NGC 5584.
The JWST-HST
difference in
determination of
H0
from these
intercepts at
0.02 ± 0.04 mag
is robustly
insensitive to
JWST zero-points
and count rate
nonlinearity
(CRNL) because
of error
cancellation
between the
rungs of the
distance ladder
with the data
sets.
Furthermore, a
series of
analysis
variants
(including
passband
combinations,
phase
corrections,
measured
detector
offsets, and
crowding levels)
show that the
baseline
determinations
of H0
are robust.
The 'Hubble
tension' between
the local Type
Ia supernovae
(SNeIa) data
calibrated by
Cepheid
variables
determination of
H0
= 73.0 ± 1.0 km
s−1
Mpc−1
(Riess et al.
2022) and the
Cosmic Microwave
Background ΛCDM
model-based
determination
(Planck
Collaboration et
al. 2020)
of H0
= 67.4 ± 0.5 km
s−1
Mpc−1
is again shown
not to be the
result of
systematic
errors in HST
Cepheid
photometry.
Riess et al.
(2023) data
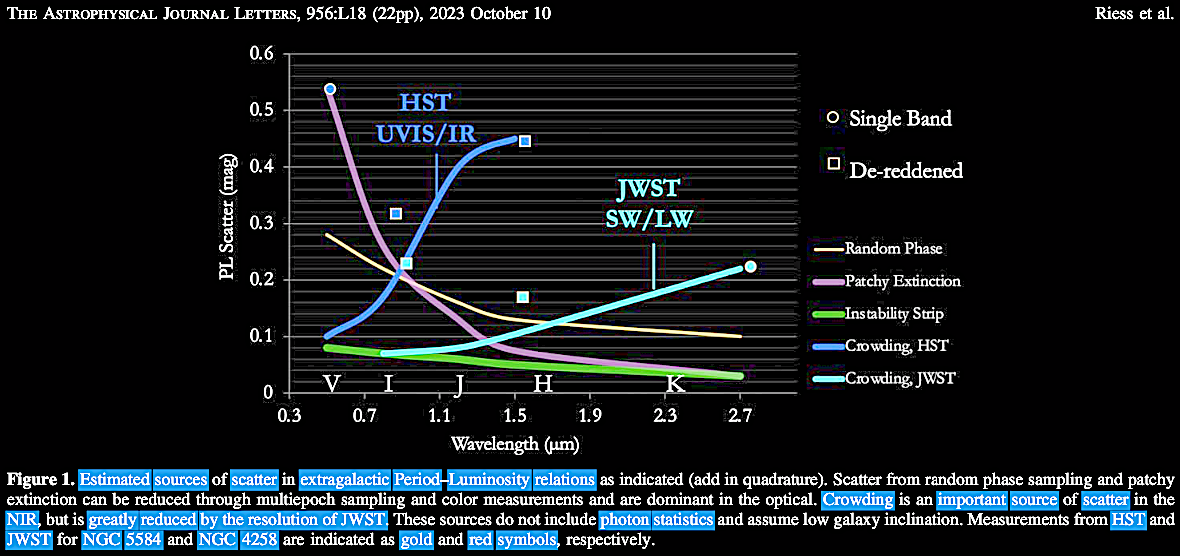
|
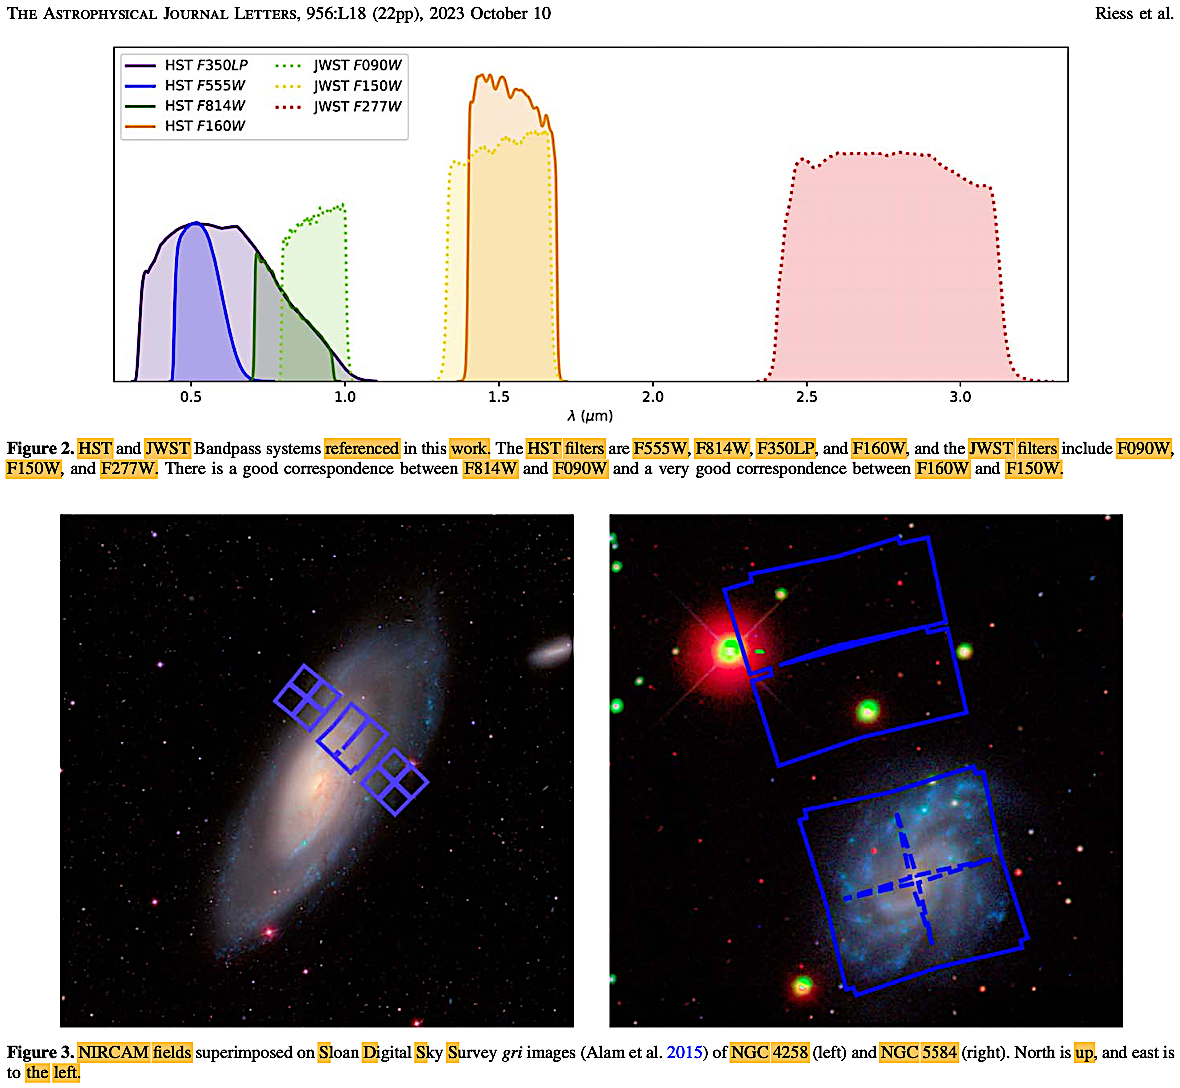
|
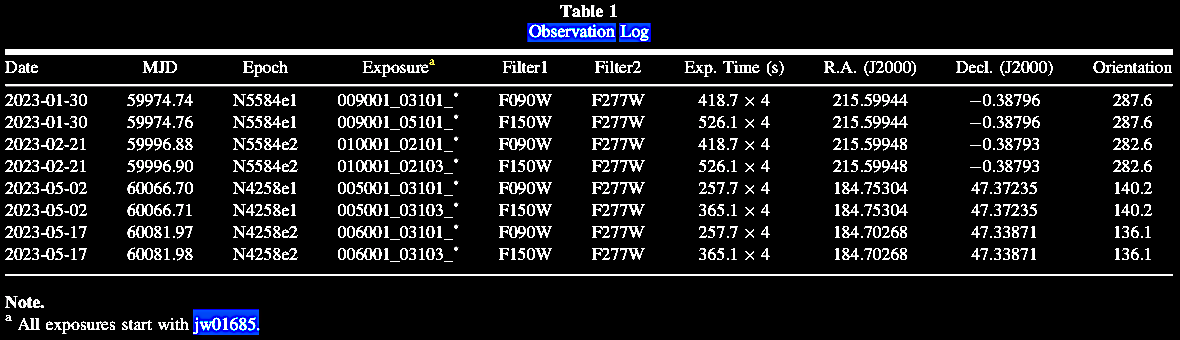
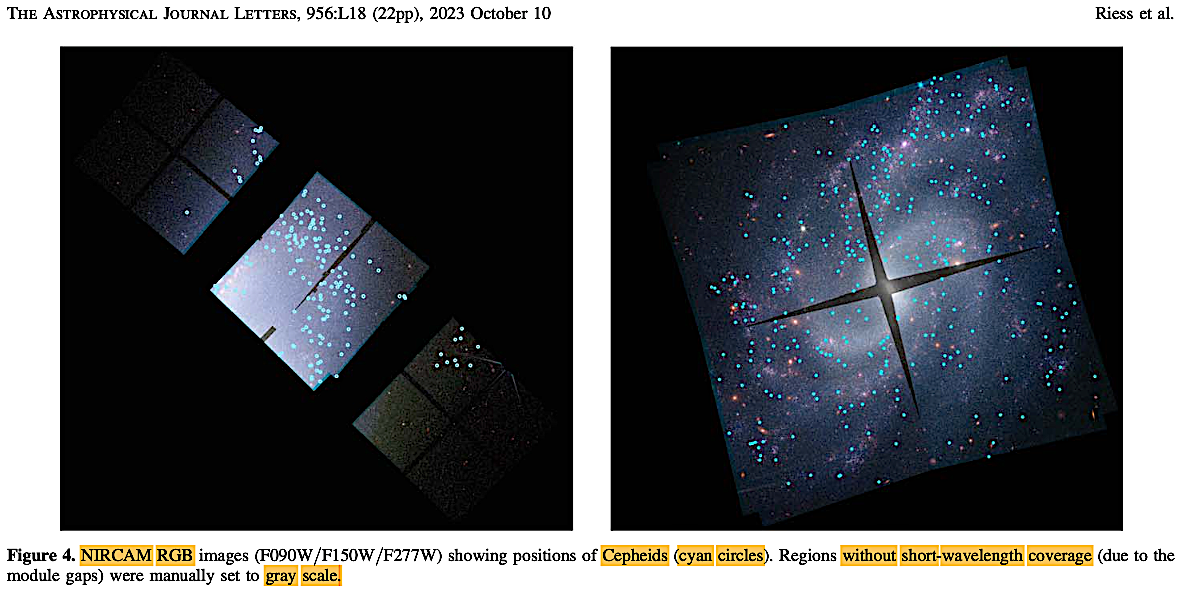
|
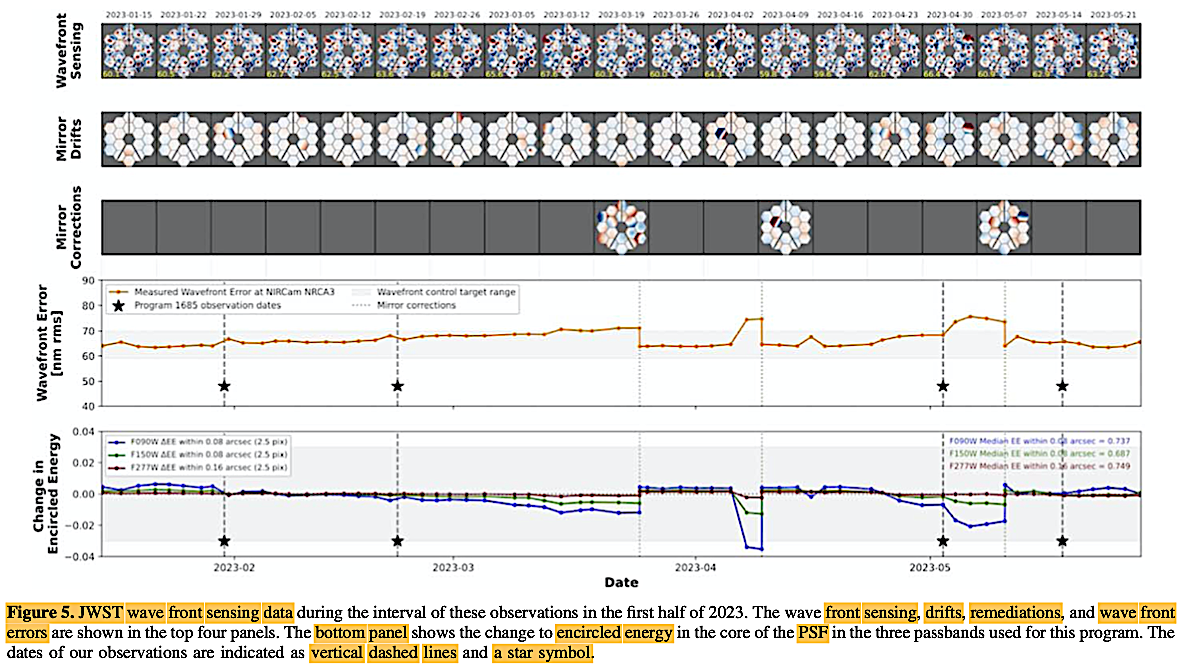
|
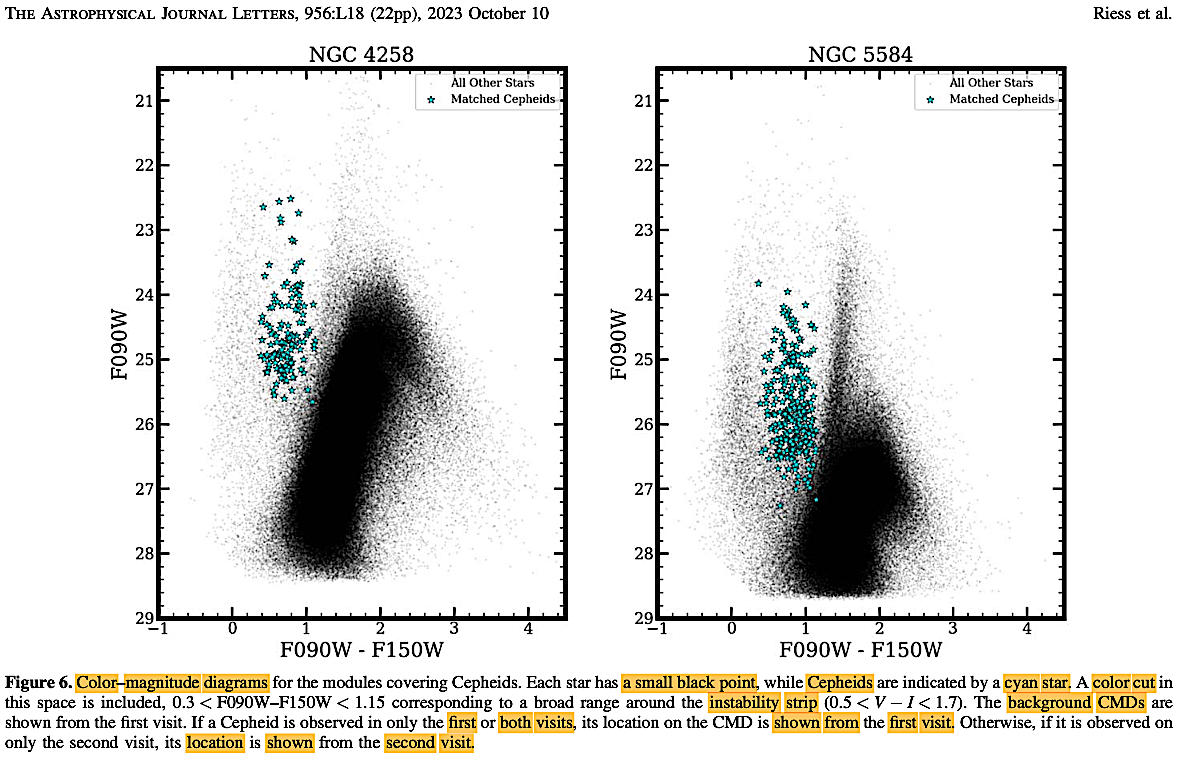
|
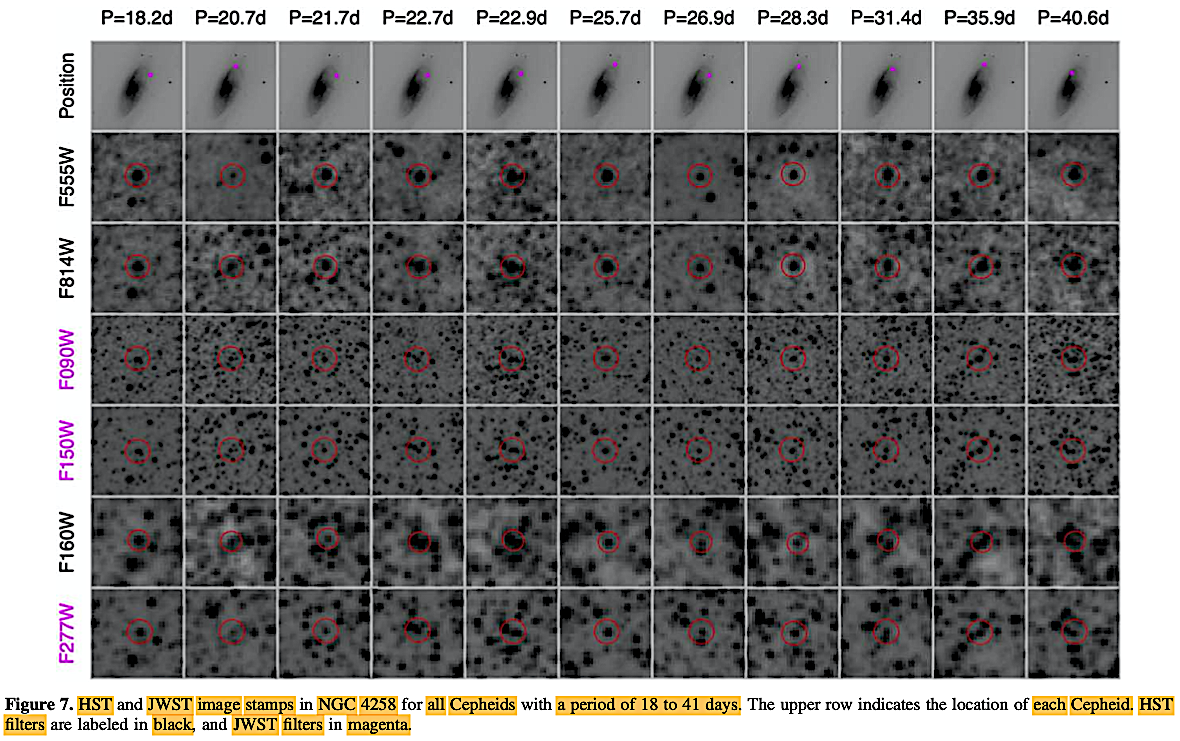
|
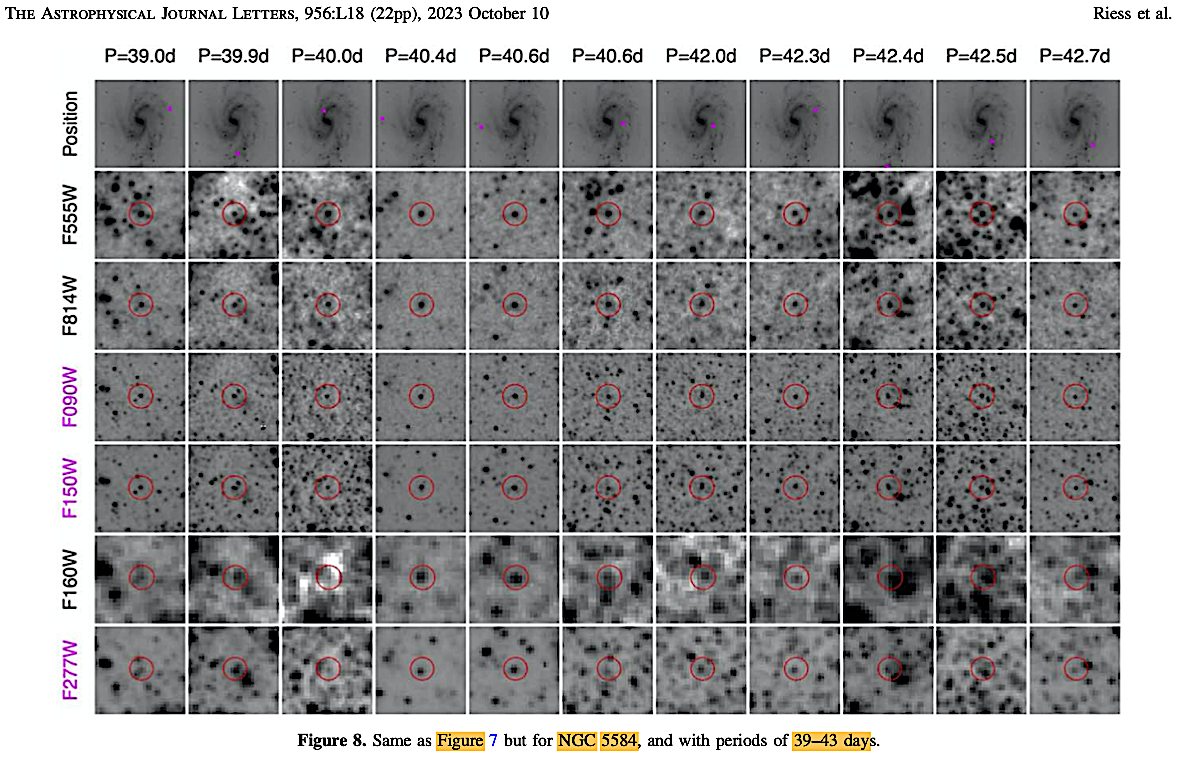
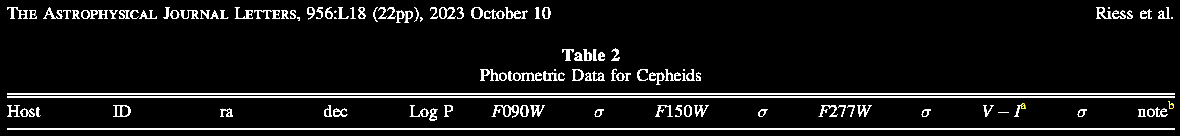
.... [For the full multi-page Riess et al.
(2023) Table 2, please consult the reference
links]....

|
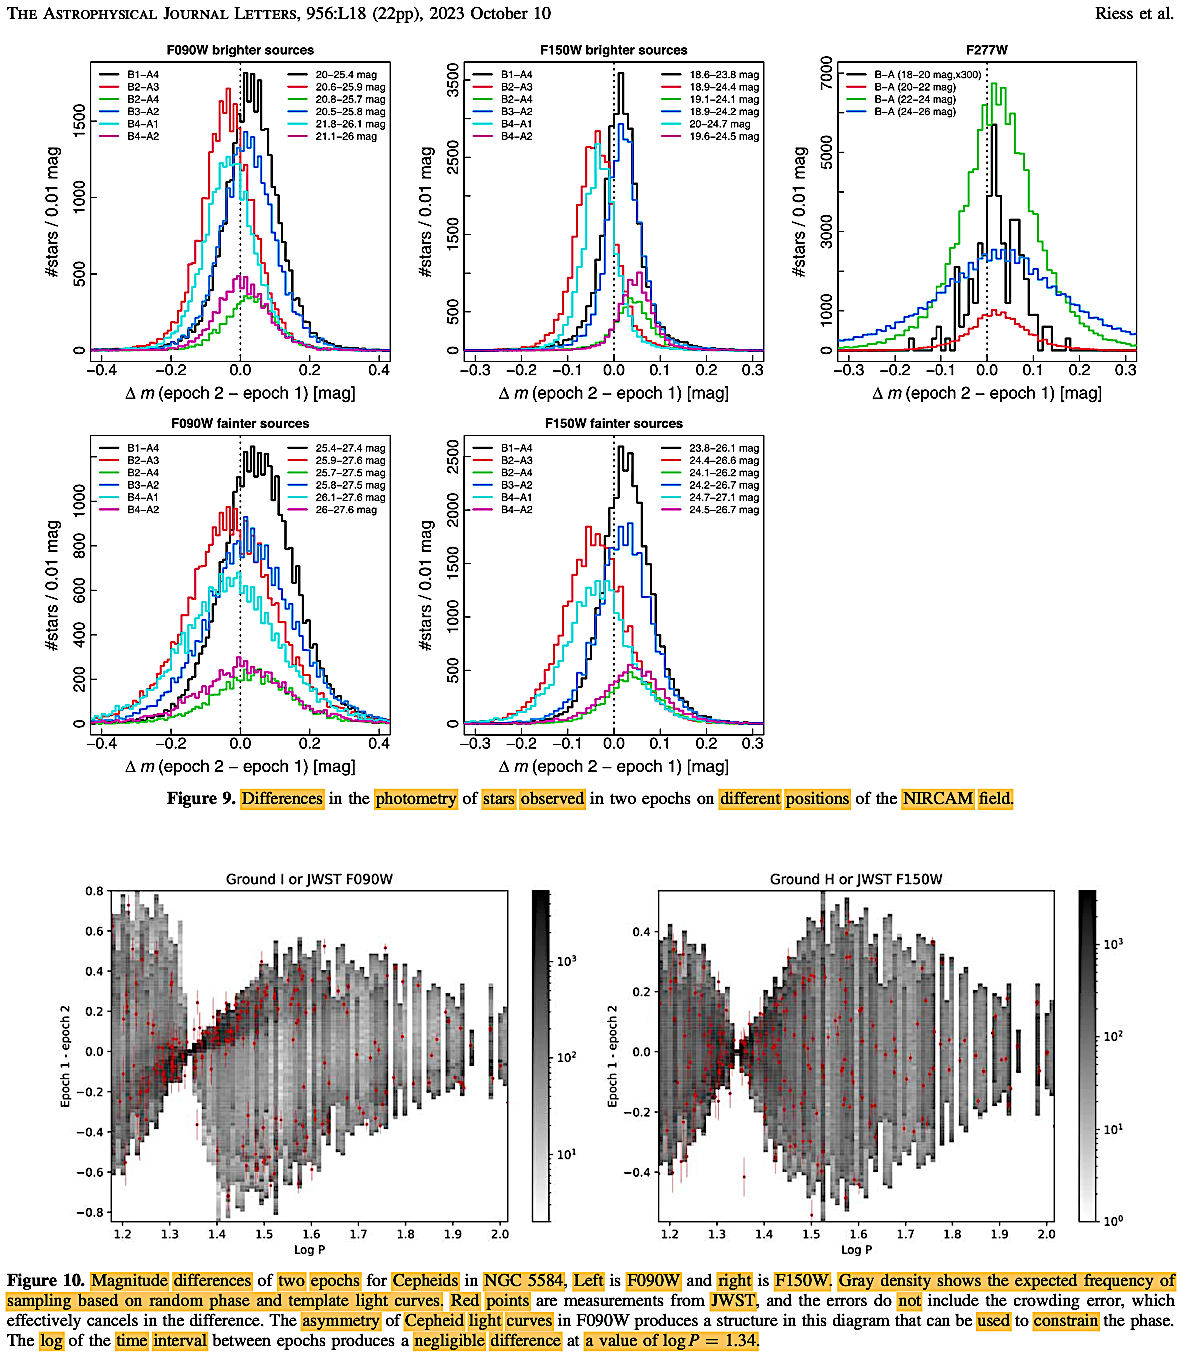
|
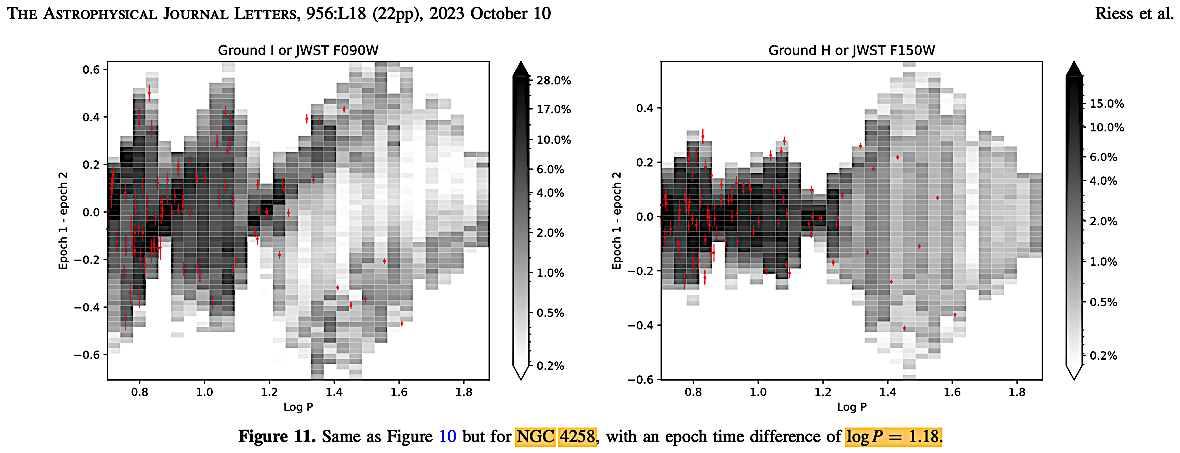
|
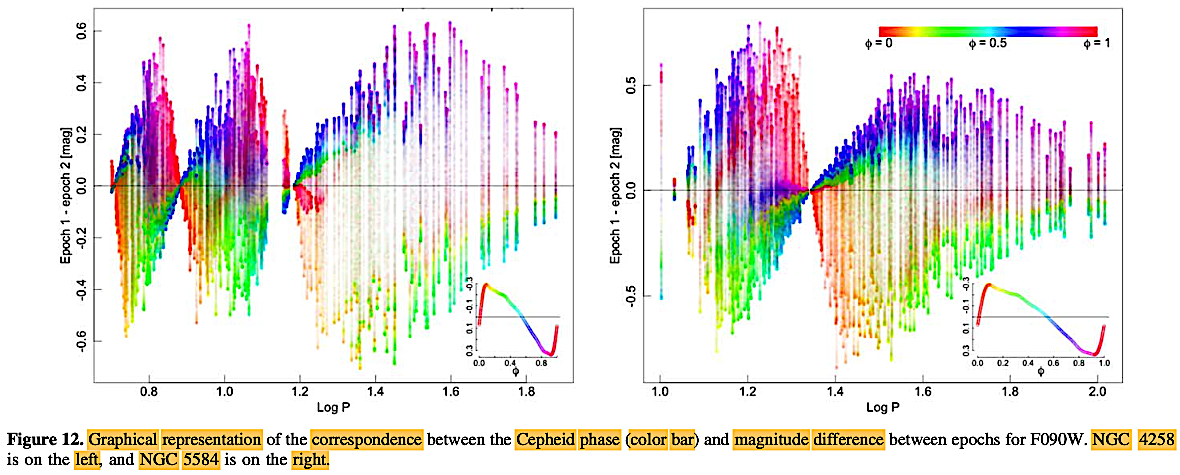
|
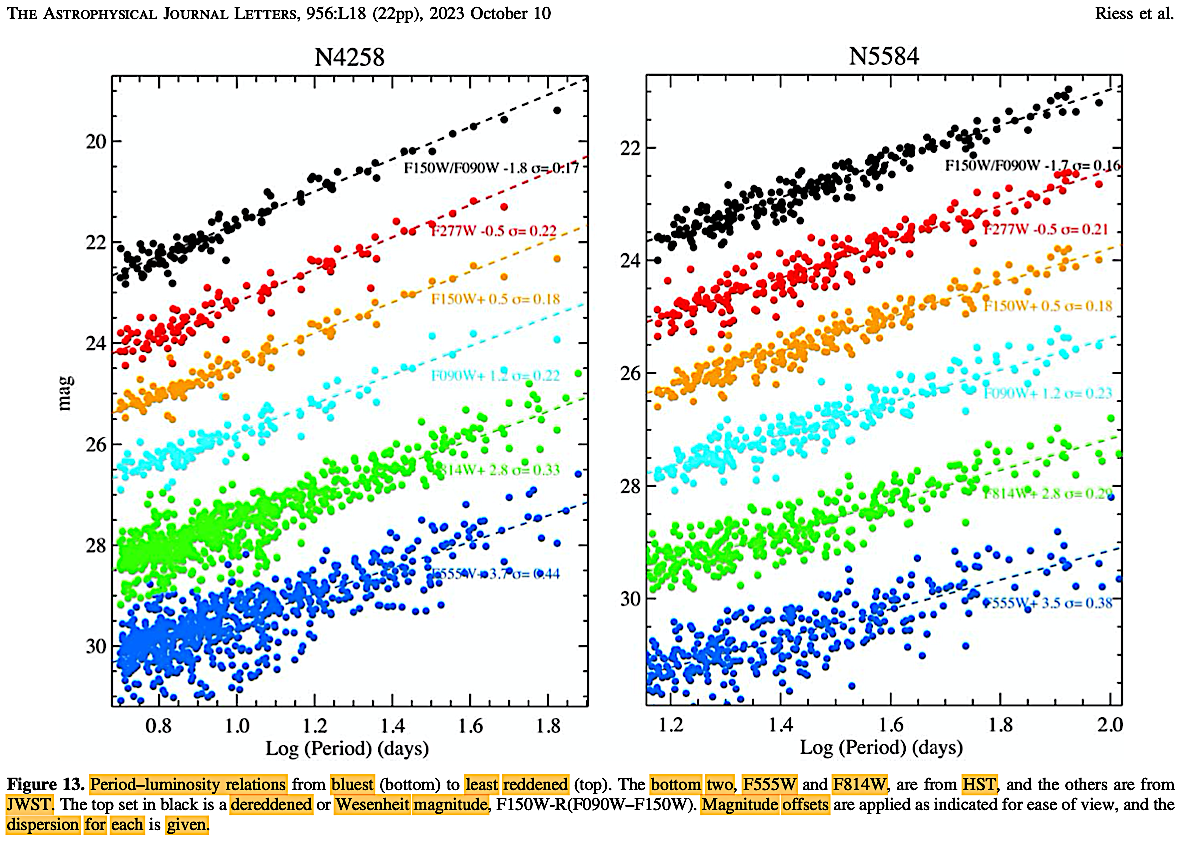 |
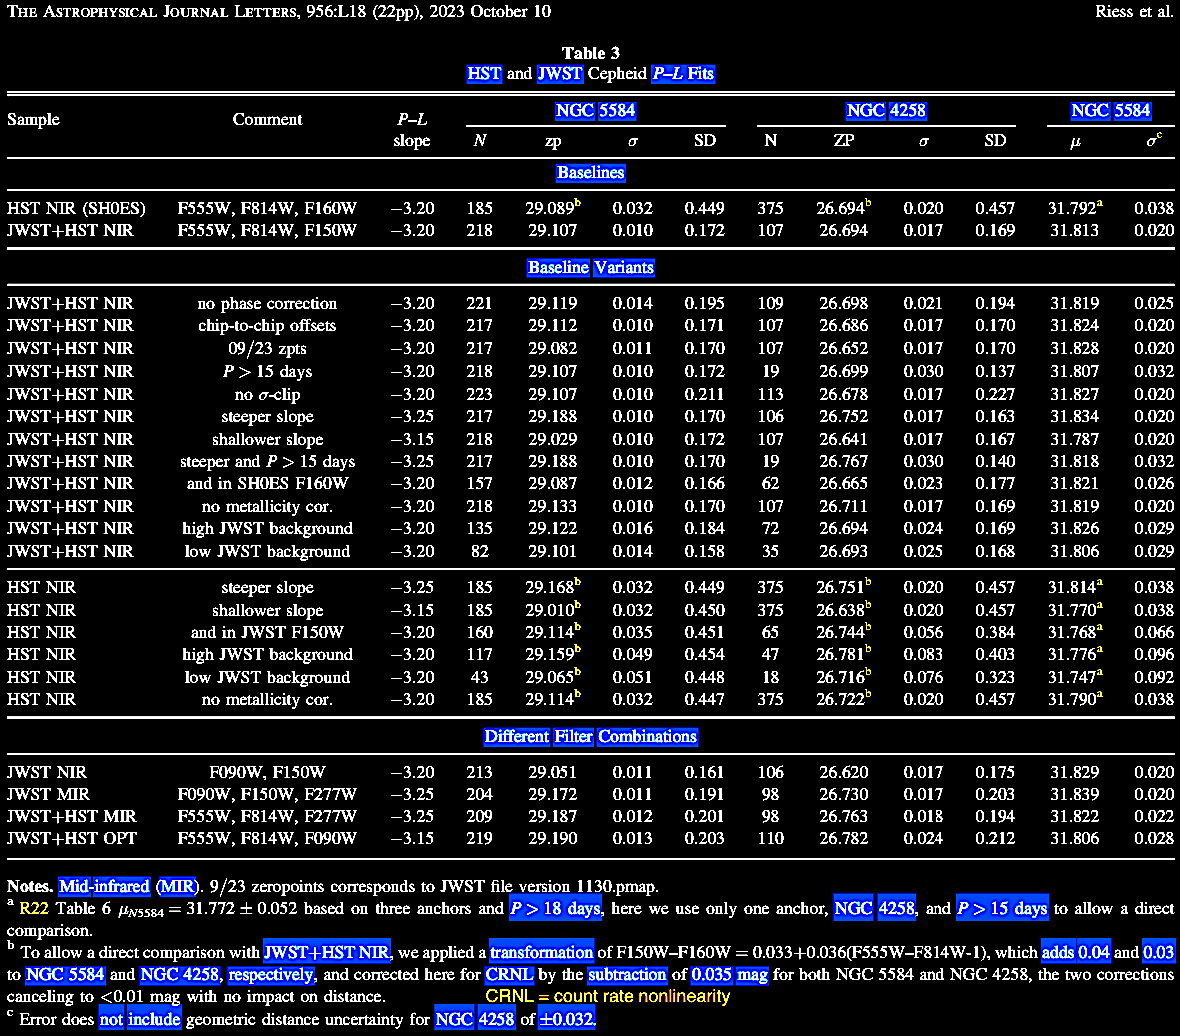 |
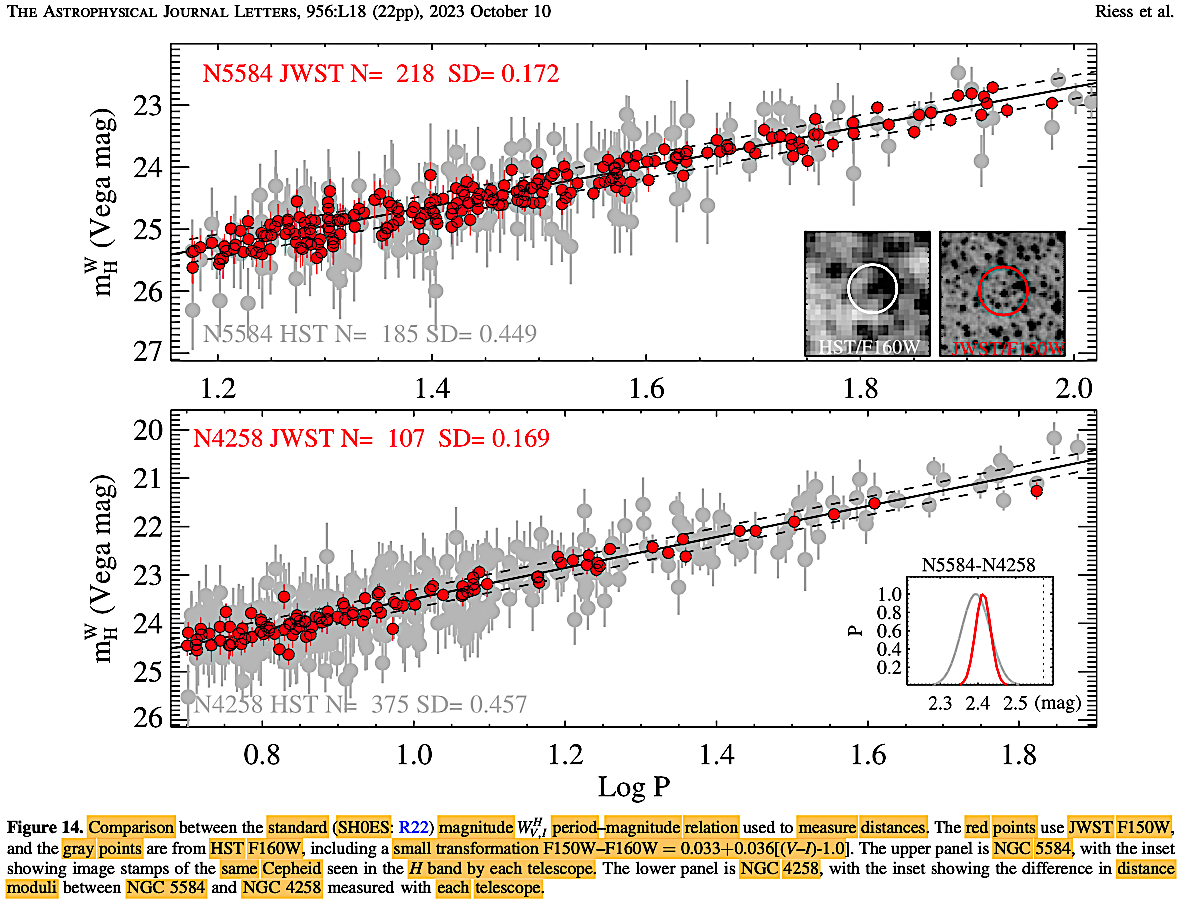 |
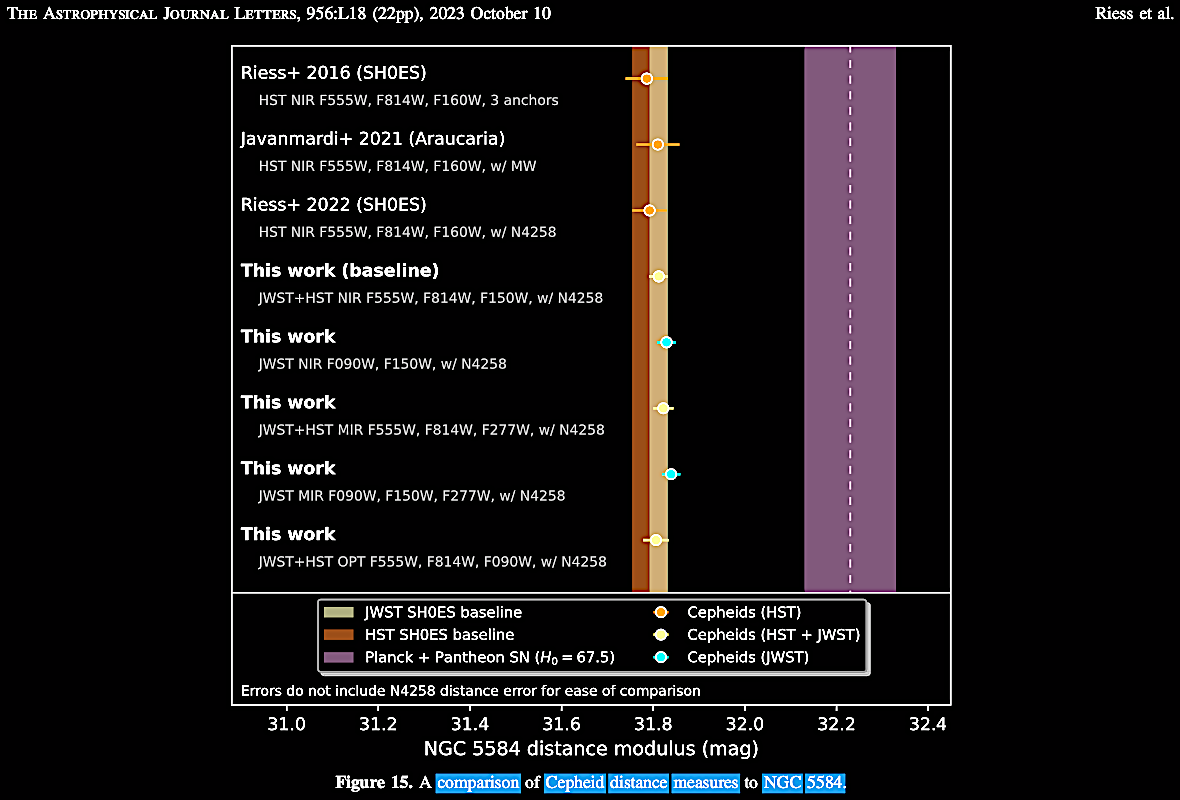
|
Riess et al. (2023).
In October 2023,
a review paper
discussed progress being
made,
including with
red giant
distance-calibration
measurements
and analyses,
in direct
measurements
of H0:
Freedman, W.
L. &
Madore, B. F.
(2023;
November).
Progress in
direct
measurements
of the Hubble
constant. Journal
of Cosmology
and
Astroparticle
Physics (JCAP)
2023,
1-35.
JCAP11(2023)050.
https://iopscience.iop.org/article/10.1088/1475-7516/2023/11/050/pdf;
https://doi.org/10.1088/1475-7516/2023/11/050.
Suppose that
Freedman and
colleagues had
indeed succeeded
in doing away
entirely with
the 'Hubble
tension' between
direct stellar
distance ladder
measurements and
calibrations of
H0
and the
indirect CMB
cosmological
model-driven
determinations
of H0
(which they do
not claim),
then what?
Does that
solve the
redshift-based
questions in
cosmological
models? It
still does
not, even for
the empirical
category of
extragalactic
redshifts:
Now,
let's examine
the Freedman
team review of
results, their
methodology, and
their
conclusions
(which made a
splash of
interest at the
American
Physical Society
or APS meetings
in March of
2024: https://march.aps.org/). They begin by
reviewing the
growing
accuracy in
direct
astrophysical
measurements
of the local H0
values,
through
overcoming of
systematic
uncertainties,
and how that
compares with
the local H0
determined
from indirect,
model-dependent
measurements
of the
temperature
and
polarization
fluctuations
of the CMB, as
data-fitted by
the ΛCDM
model; i.e.,
the 'Hubble
tension.' They
also found it
critical to
show that the
local Universe
measurements
are
'convincingly
free of
residual
systematic
errors in
measurement.'
The 'Hubble
tension' or
'the
inconsistency
between the
local value of
the Hubble
constant and
the
cosmologically[-]modeled
value could be
interpreted as
an inadequacy
in the
theory,' the authors assert,
thus 'begging
the
questions':
- 'Is cosmology in a
crisis?'
- 'And is our current
model of the universe now in need of new physics?'
The authors wisely
suggest that
the answers
will emerge by
gathering data
and improving
our techniques
for
eliminating
both
statistical
and systematic
errors in the
data sets used
for the
distance scale
in measuring H0.
They then
review the
definite
improvements
made in
statistical
and systematic
precision in
three
methodological
areas of data
collection to
calibrate the
supernovae
(SNe Ia)
distance data,
editorializing:
"The past 20
years have
been referred
to as the era
of 'precision
cosmology'. We
must now
ensure that we
have
convincingly
entered the
era of
'accurate
cosmology'."
- (a) the measurement
of the Cepheid
period-luminosity
Leavitt (L-P)
function
(2001-2023),
starting with
such programs
as the HST Key
Project (2001)
H0
= 72 ± 3
(stat) ± 7
(sys) km s−1
Mpc−1,
wending with
increasing
precision,
through data
sets from Hipparcos,
HST, Gaia,
Gaia Early
Data Release 3
(EDR3), SH0ES,
and of course,
the JWST
results
. See their
Figures below
(and also Fig.
5 from
Freedman, W.
L. &
Madore, B. F.
2023. The
Cepheid
extragalactic
distance
scale: Past,
present, and
future. In
Richard de
Grijs,
Patricia
Whitelock, and
Marcio
Catelan,
(eds.). Proceedings
of IAU
Symposium 376.
arXiv release
(Aug 2023): https://arxiv.org/pdf/2308.02474.
Far from
illustrating
the advancing
convergent
harmonization
of the H0
values from
diverse data
sets, the
increasing
precision of
each reveals
the divergence
of the 'Hubble
tension'
(summary Fig.
6).
Fig. 6; Freedman &
Madore (2023; August).
-Freedman%20&%20Madore_f6.png)
- (b) The Tip of the
Red Giant
Branch (TRGB)
stars on the
Hertzsprung-Russell
(H-R) related
color
magnitude
diagram (CMD)
as distance
ladder
markers, which
can be
calibrated
with Cepheid
variables. The
astrophysical
theory as to
why TRGB may conceivably
serve as
excellent
standard
candles is
because they
are low mass
stars (M
≲ 2 M⊙)
which as they
evolve up the
red giant
branch of the
H-R diagram
burn / fuse H
above a
degenerate He
core. Whatever
the initial
mass of the
star, when the
core reaches a
standard
threshold of ~0.5 M⊙,
while in the
degenerate He
core which
cannot expand,
the
temperature
careens
upward. Upon
reaching about
~108
K at a density
of 105
g cm
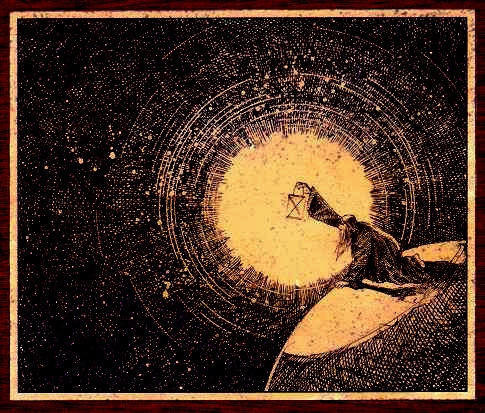
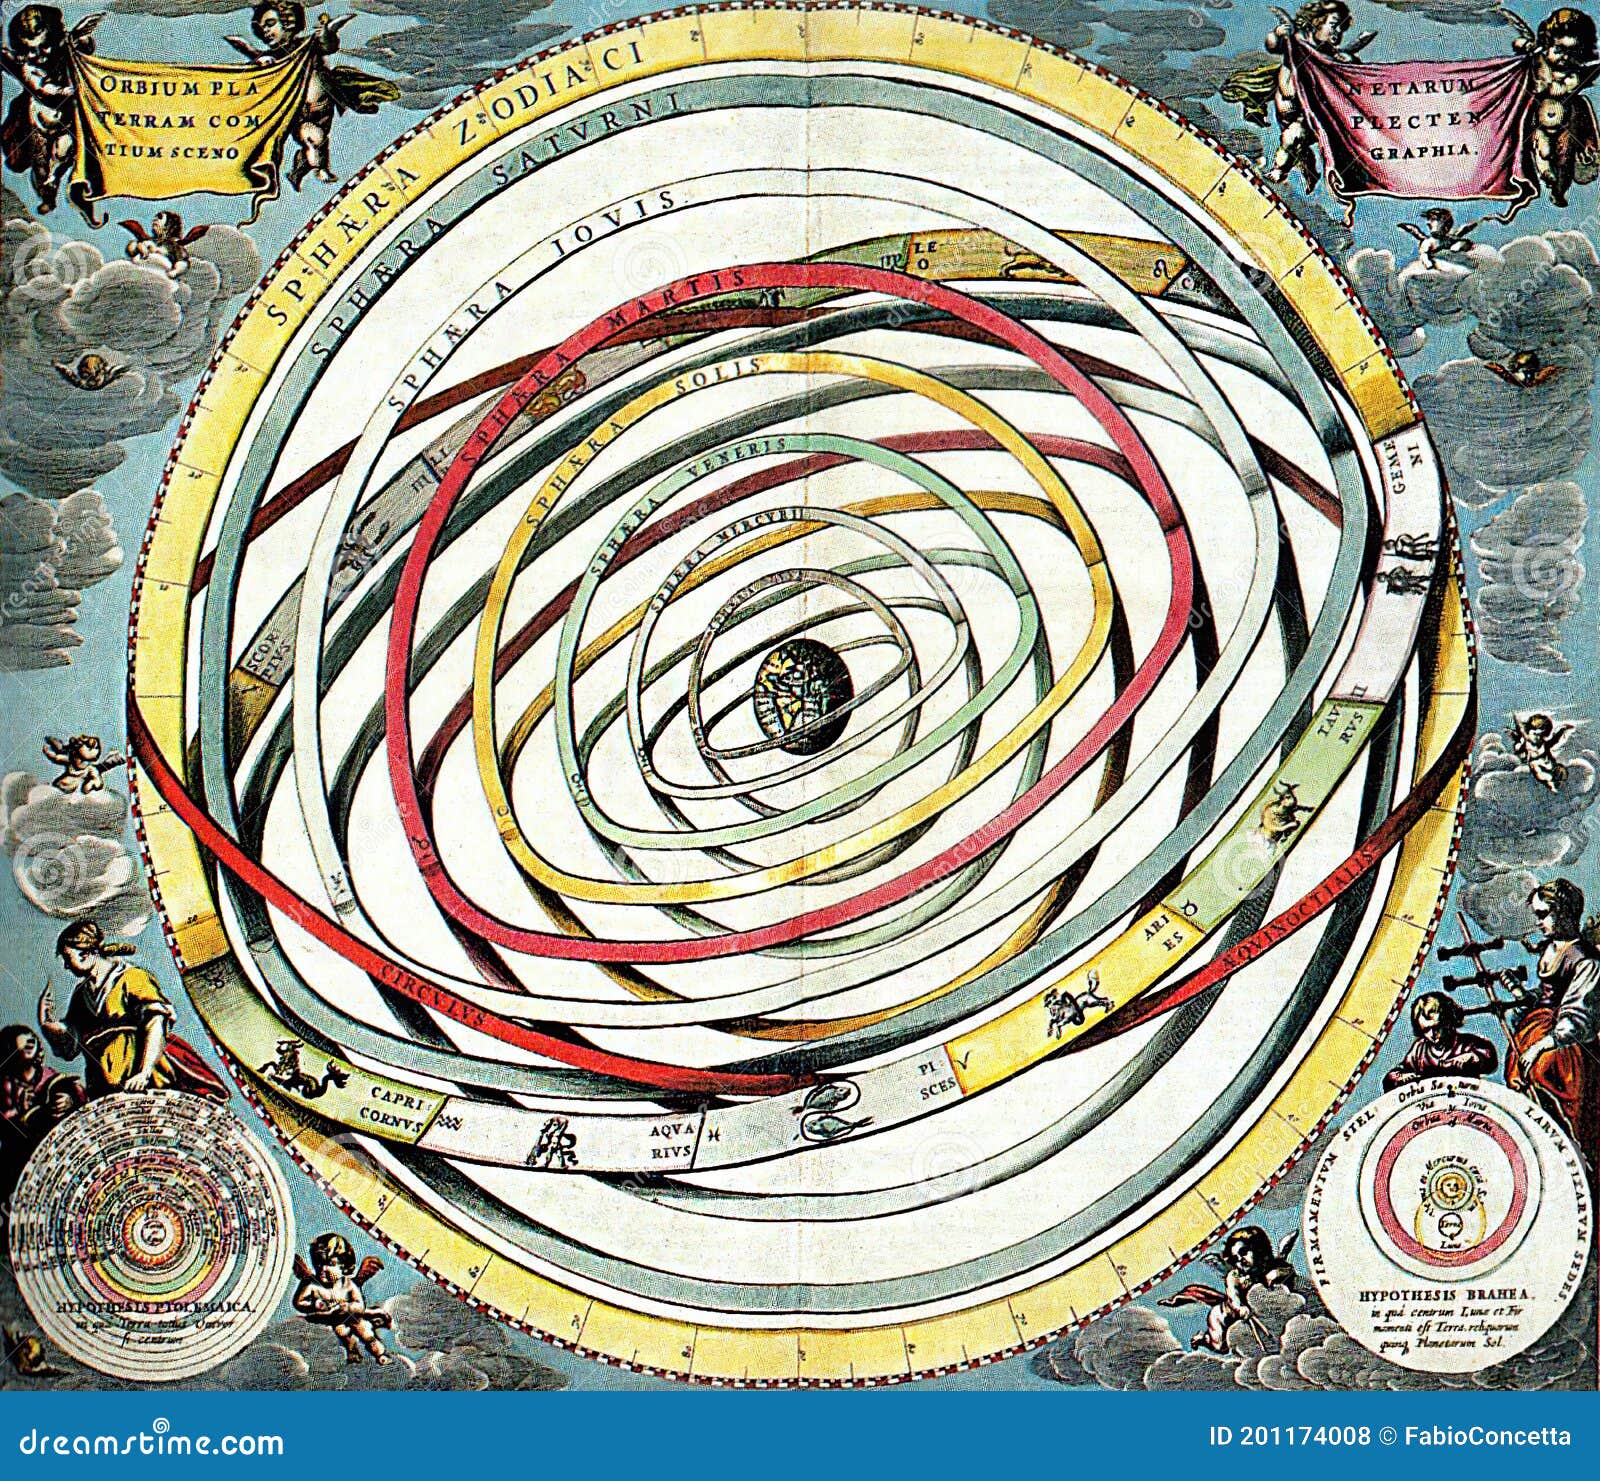
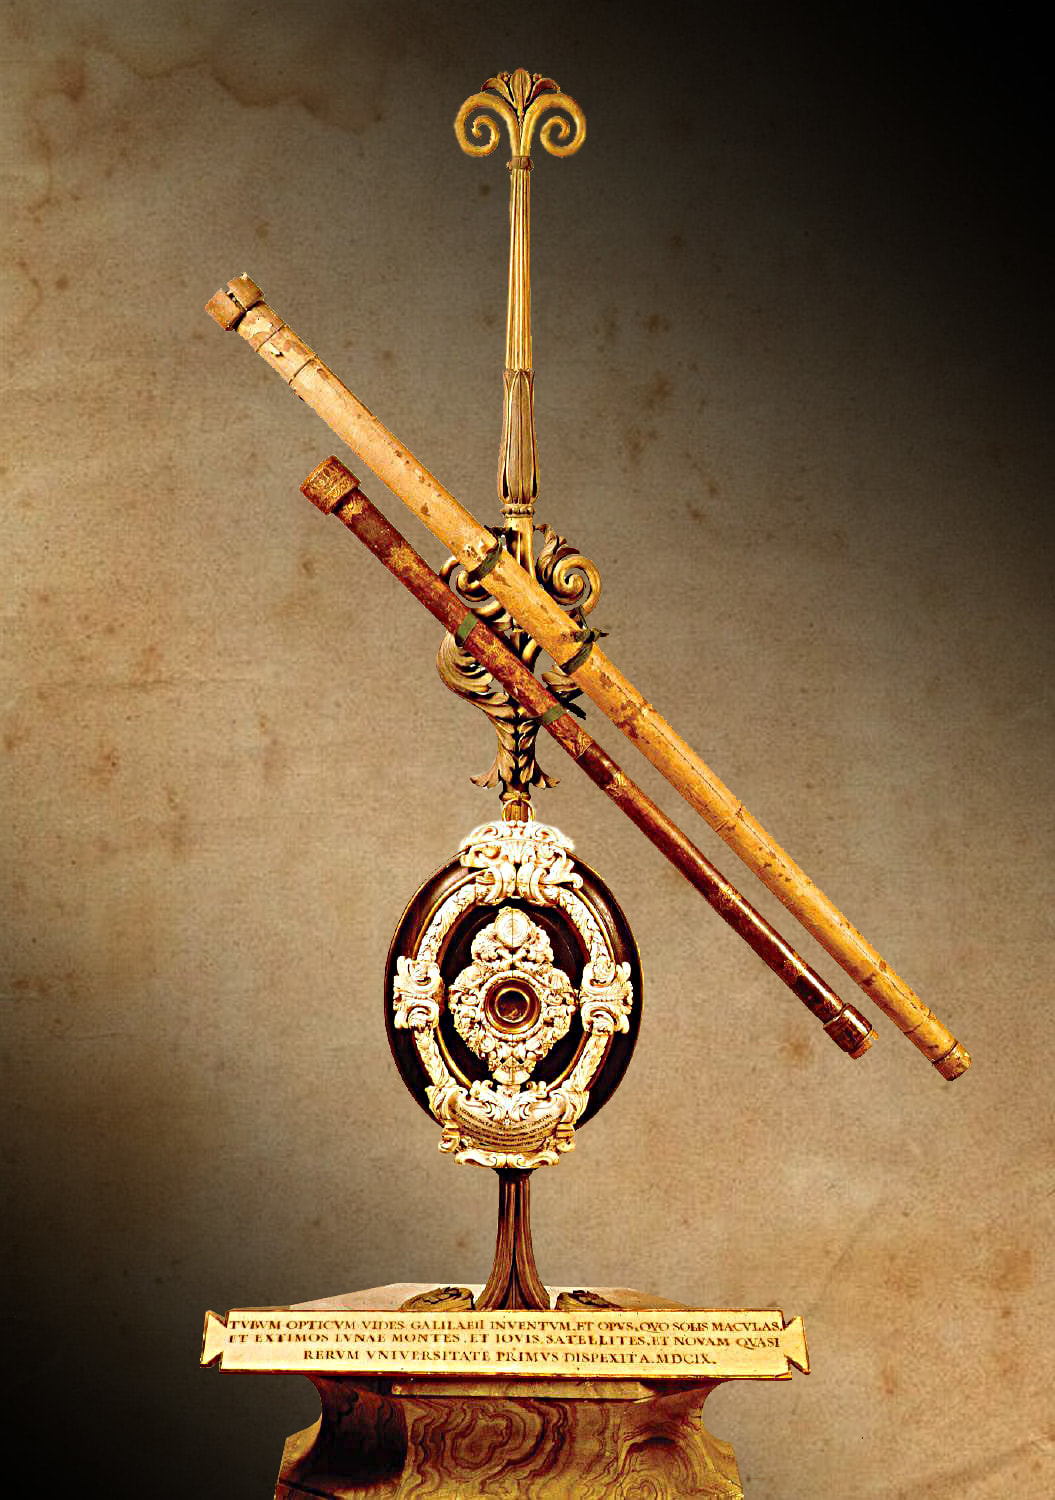


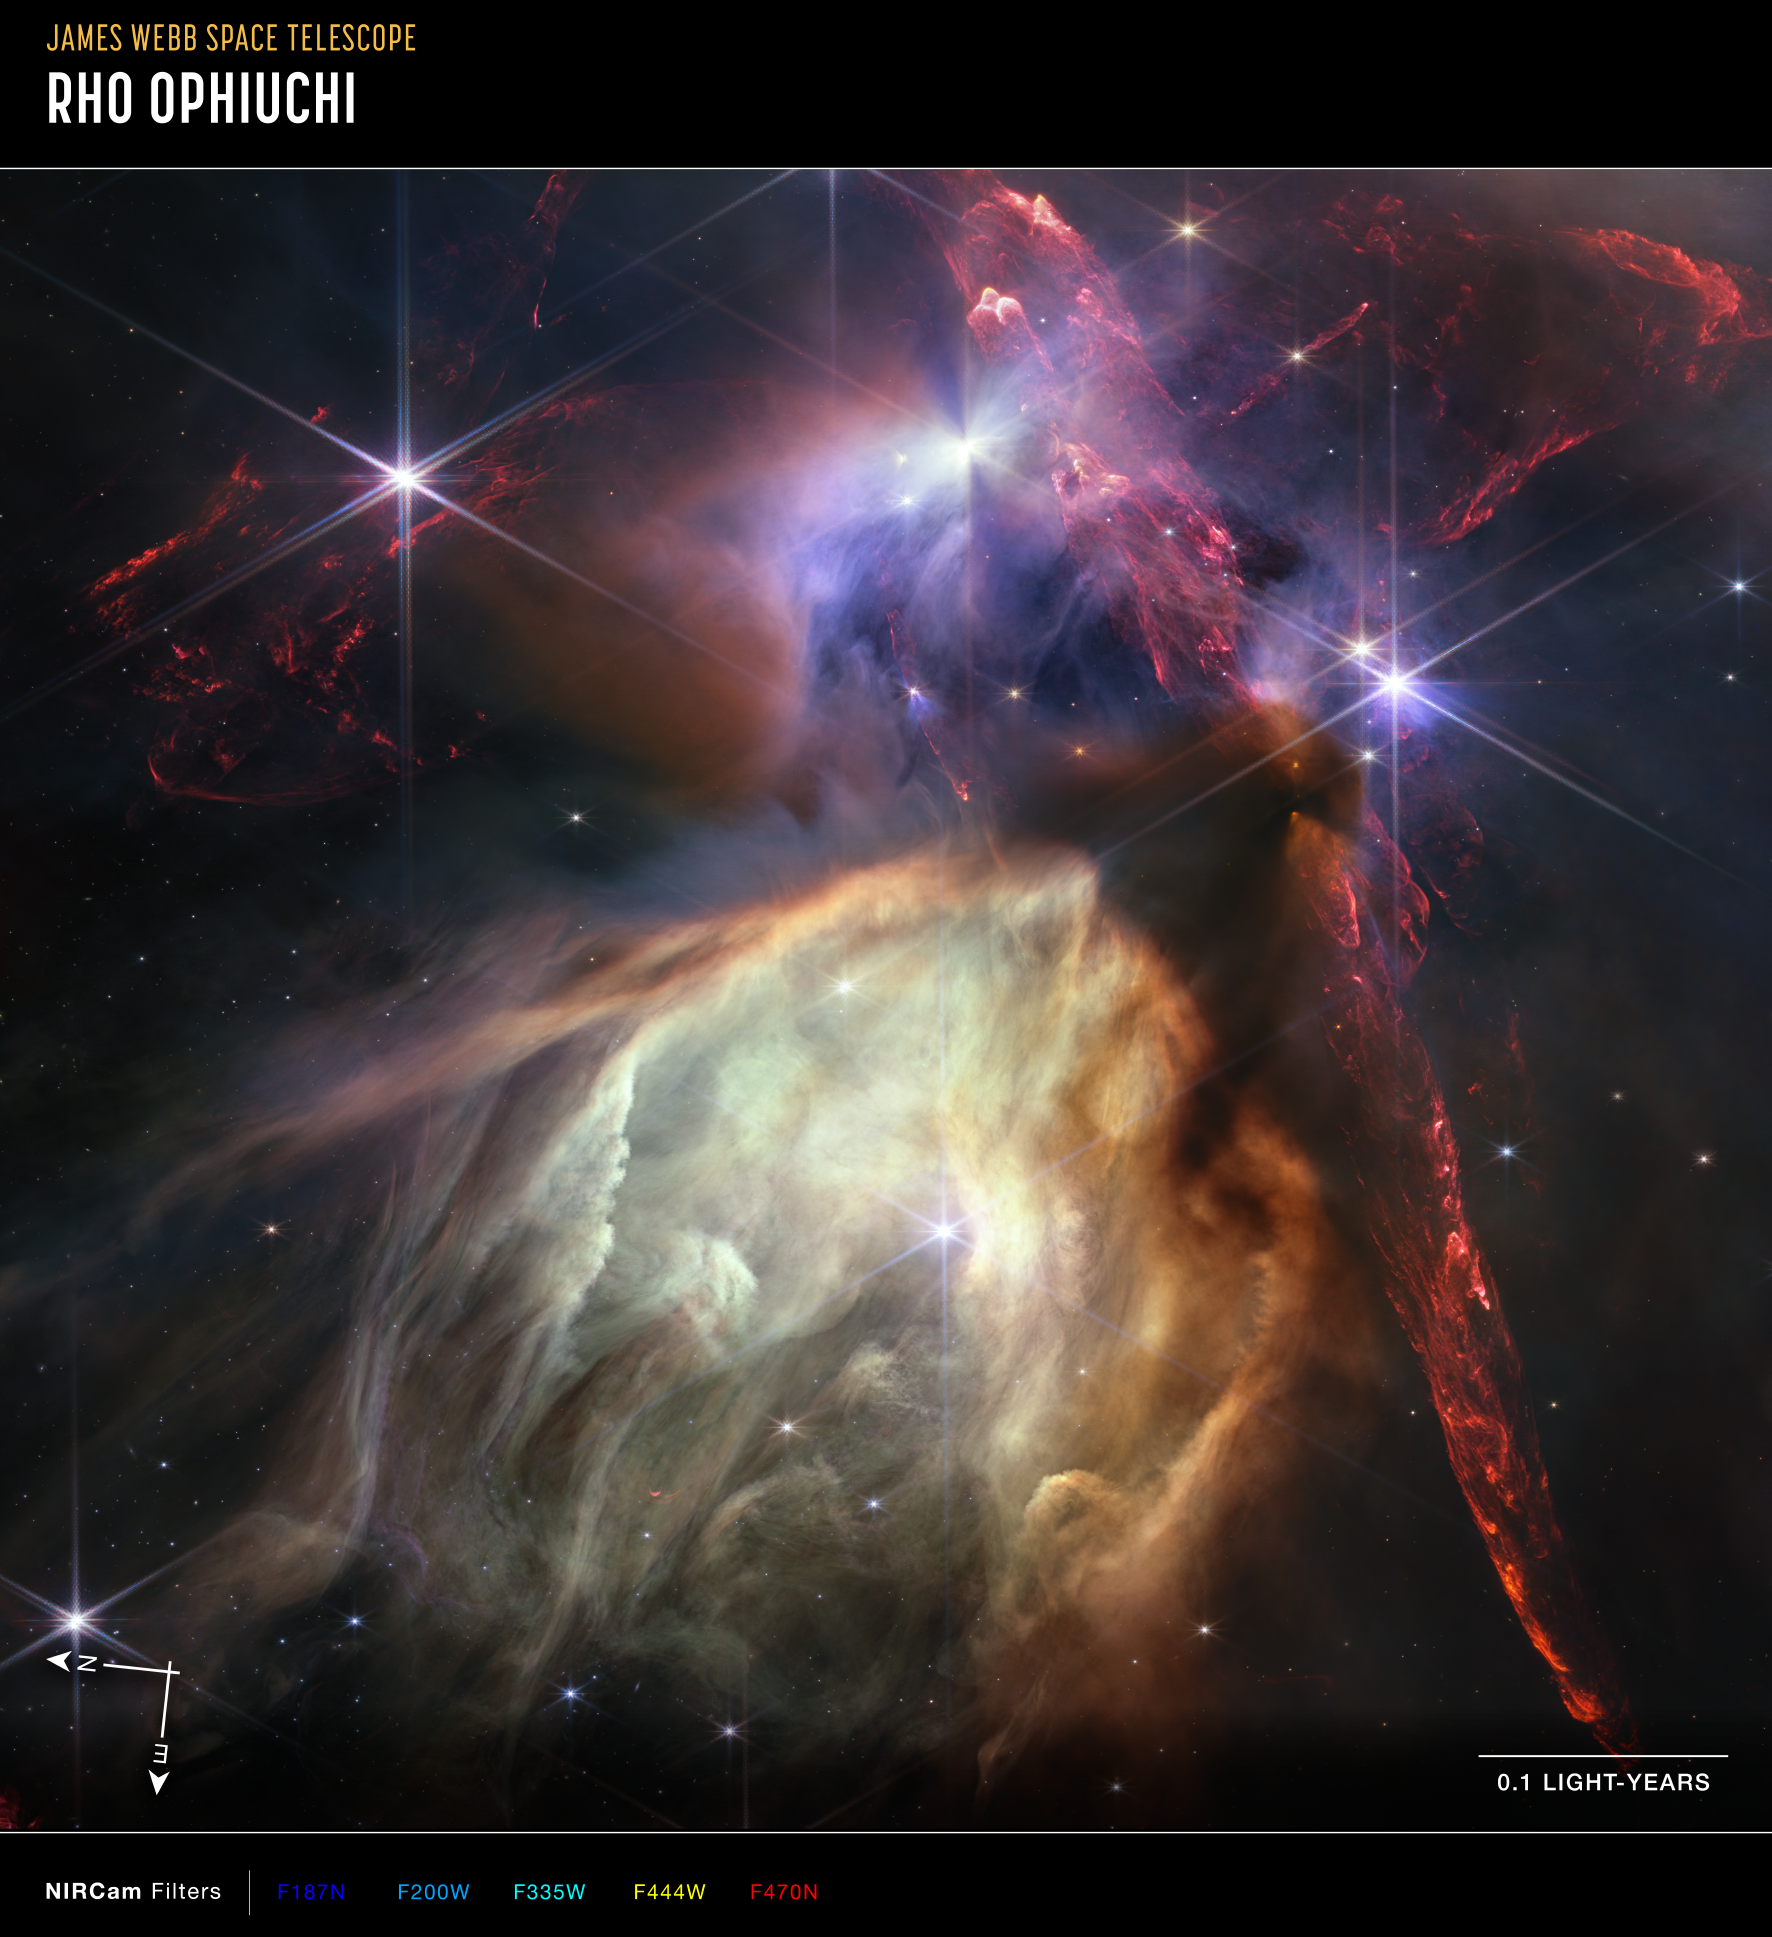
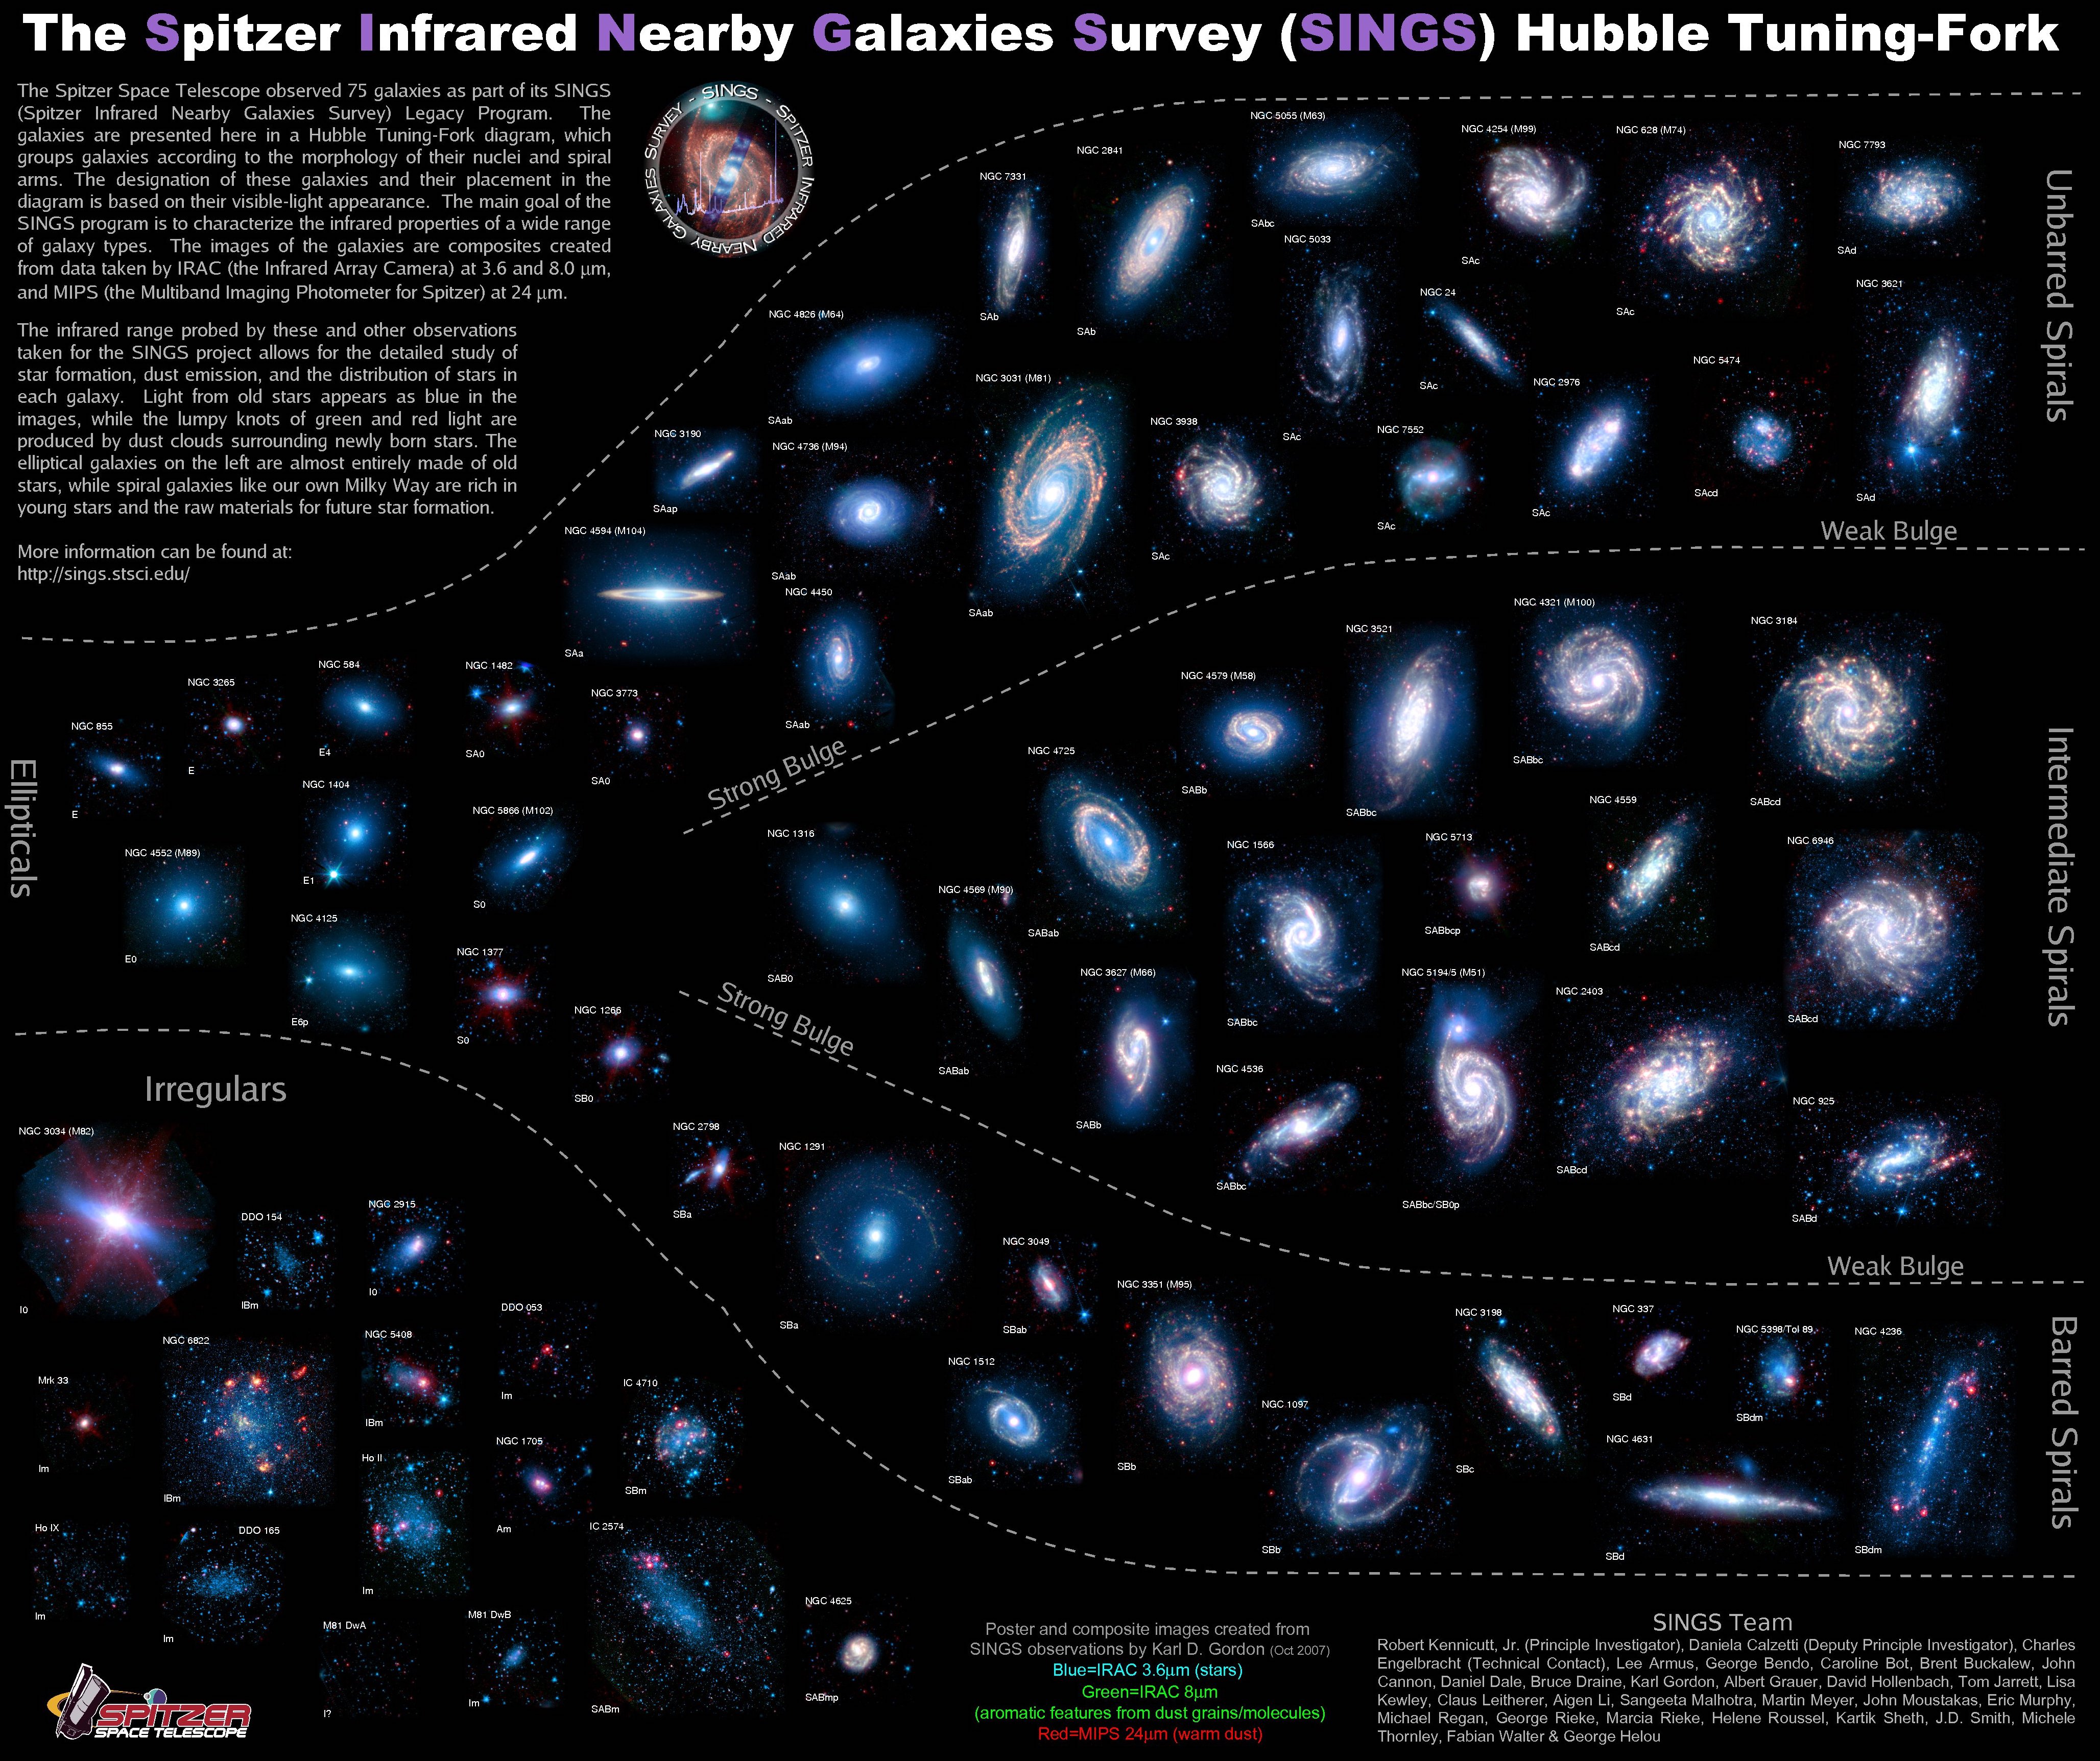
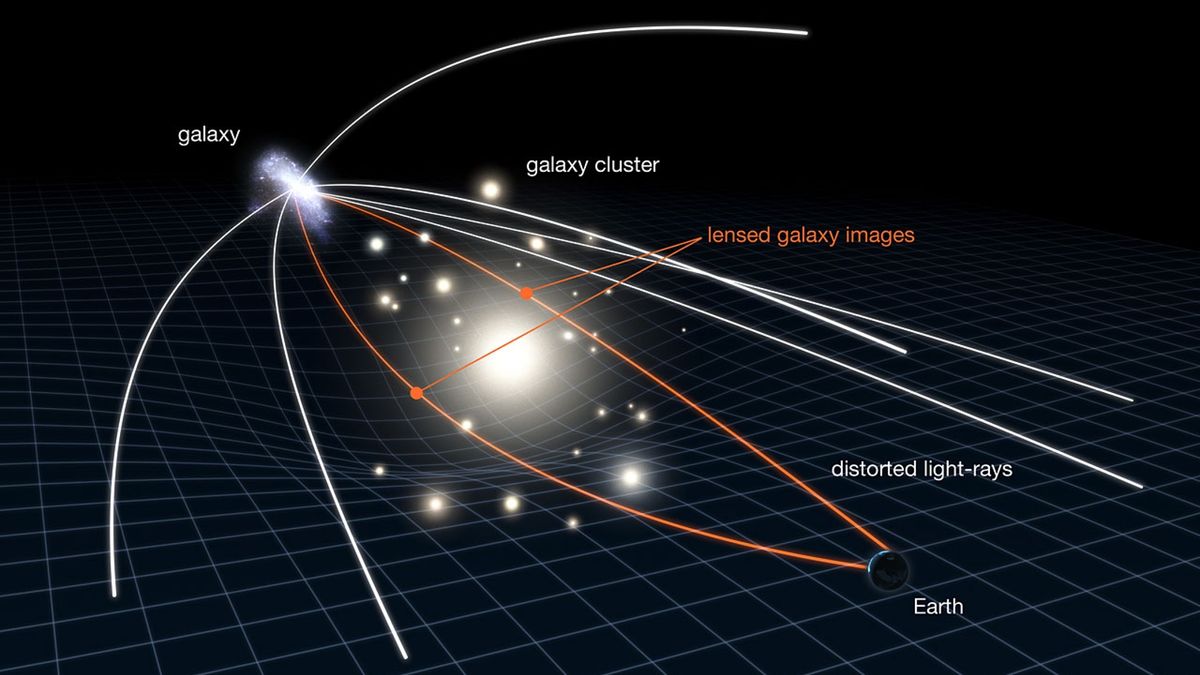
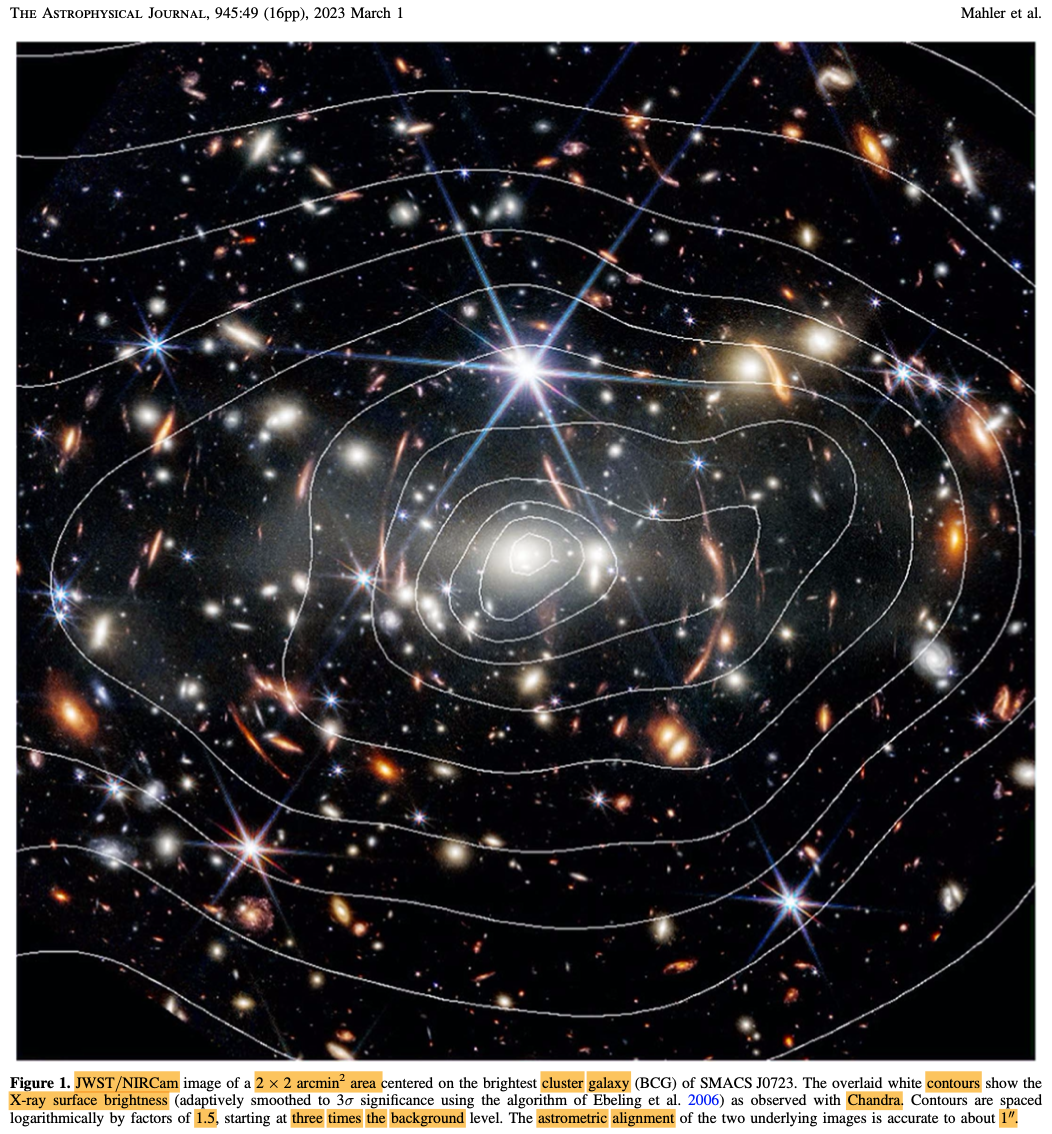
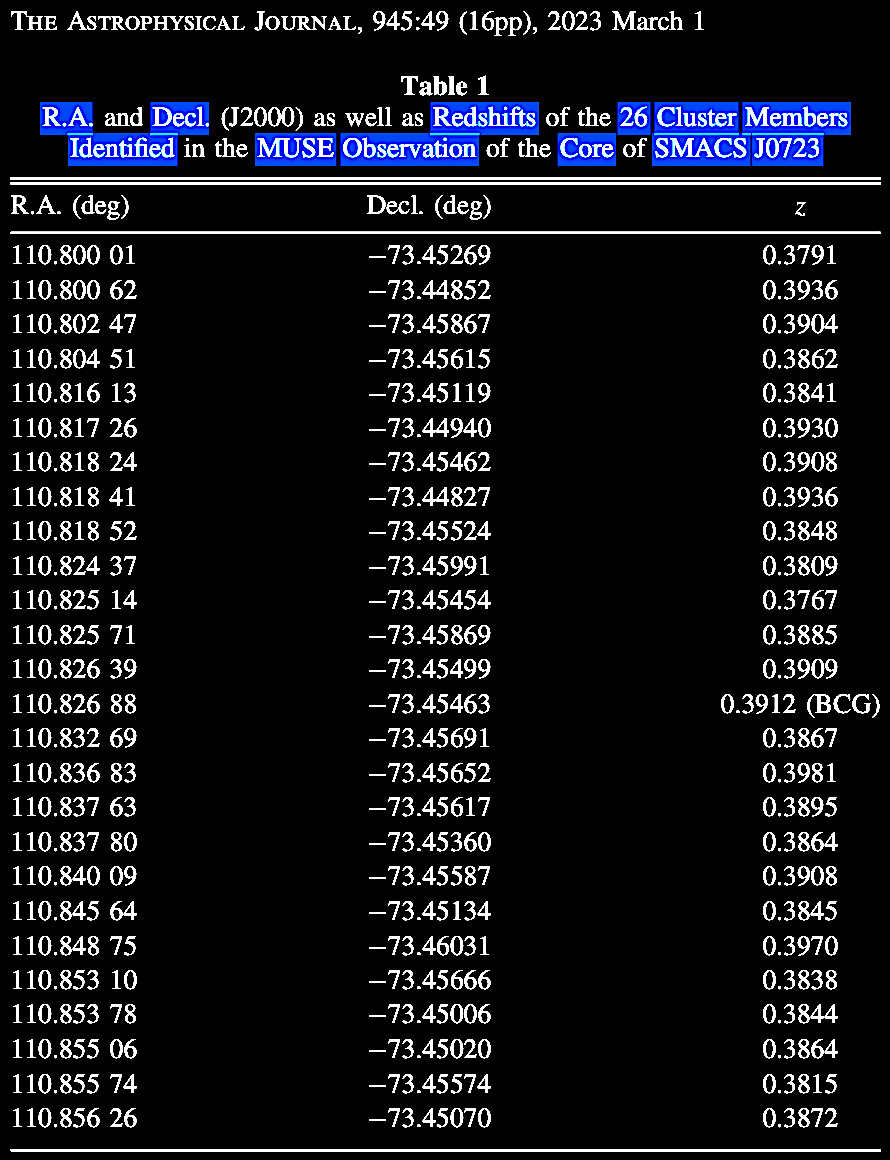
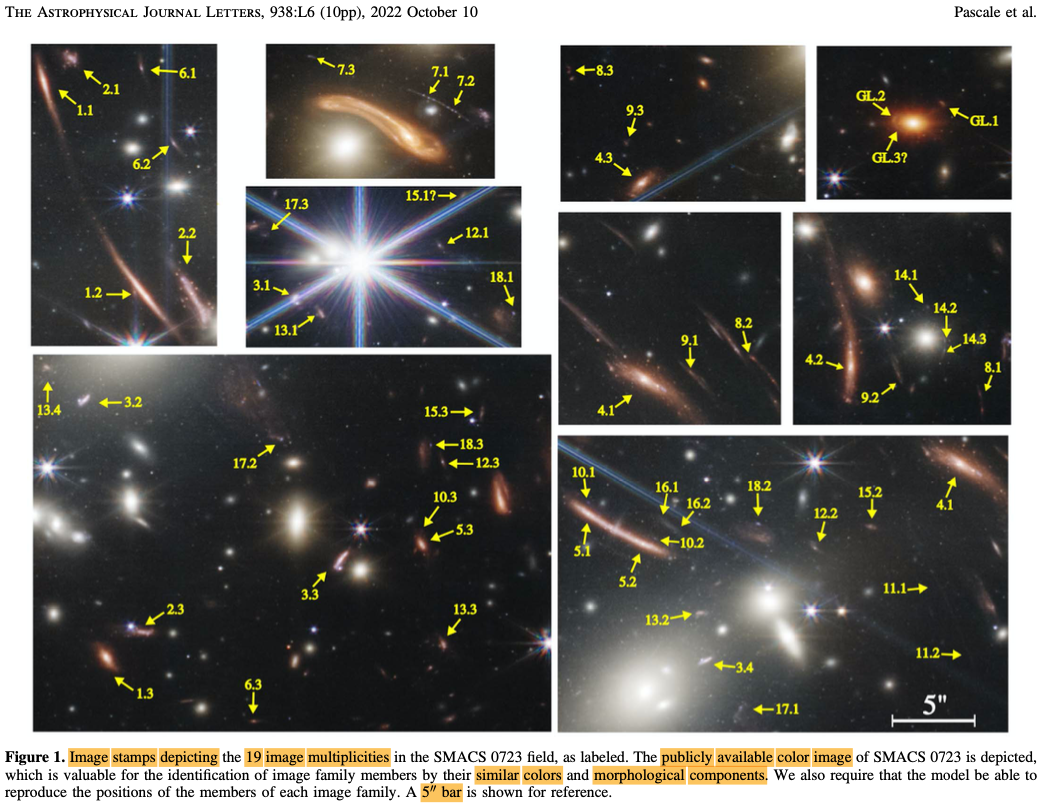
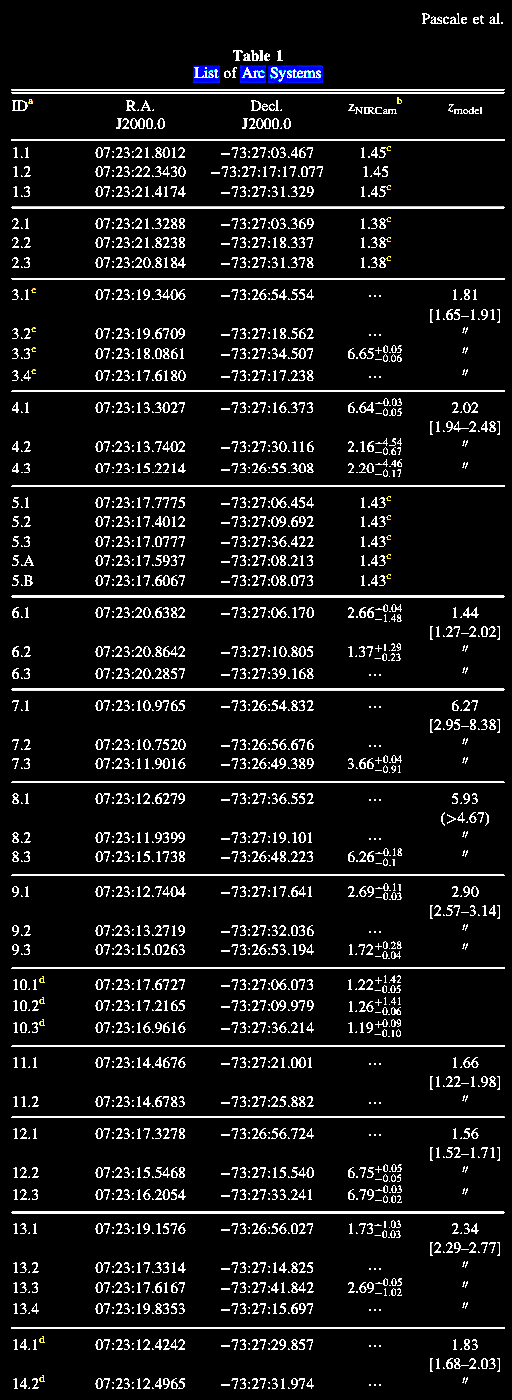
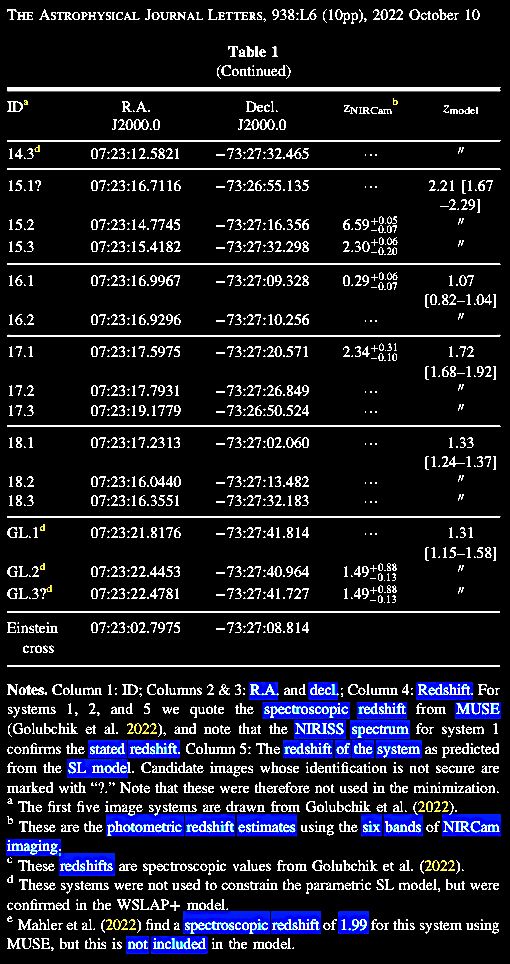
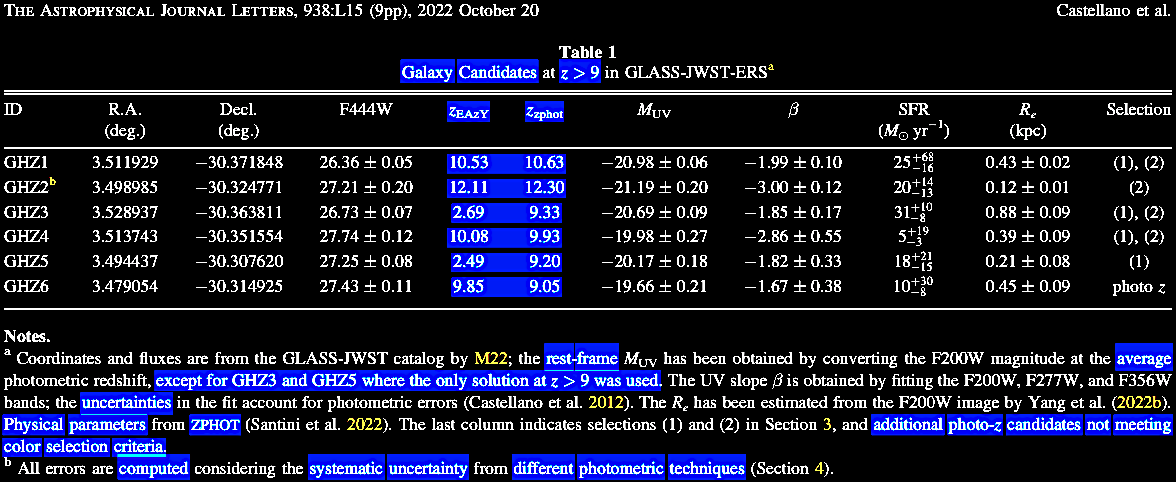
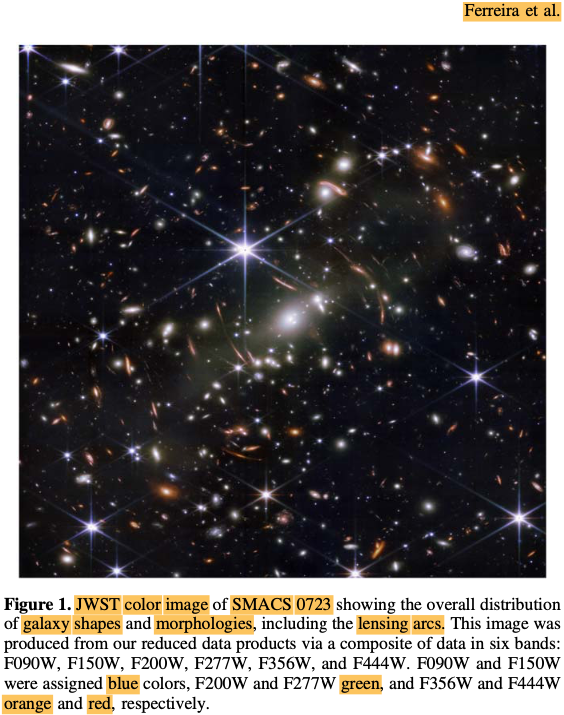
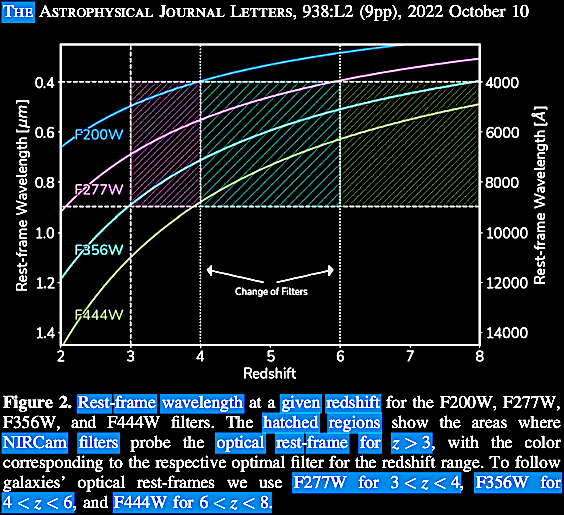
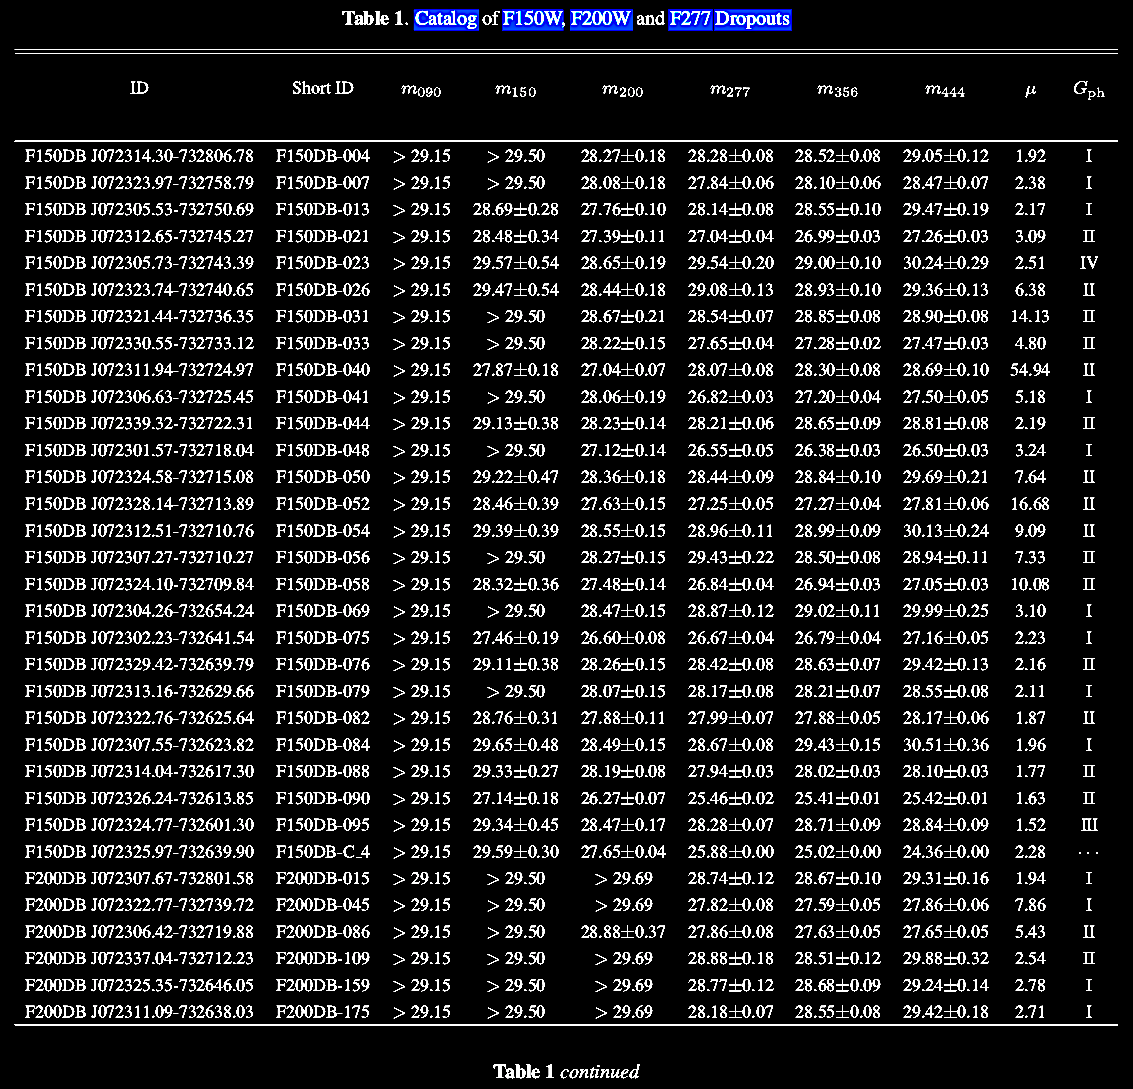
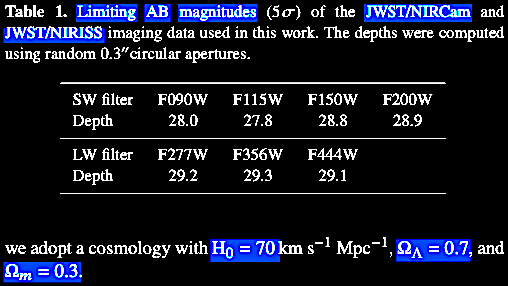
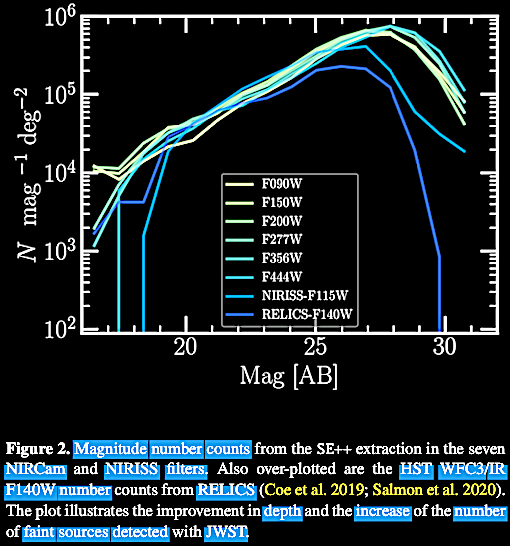
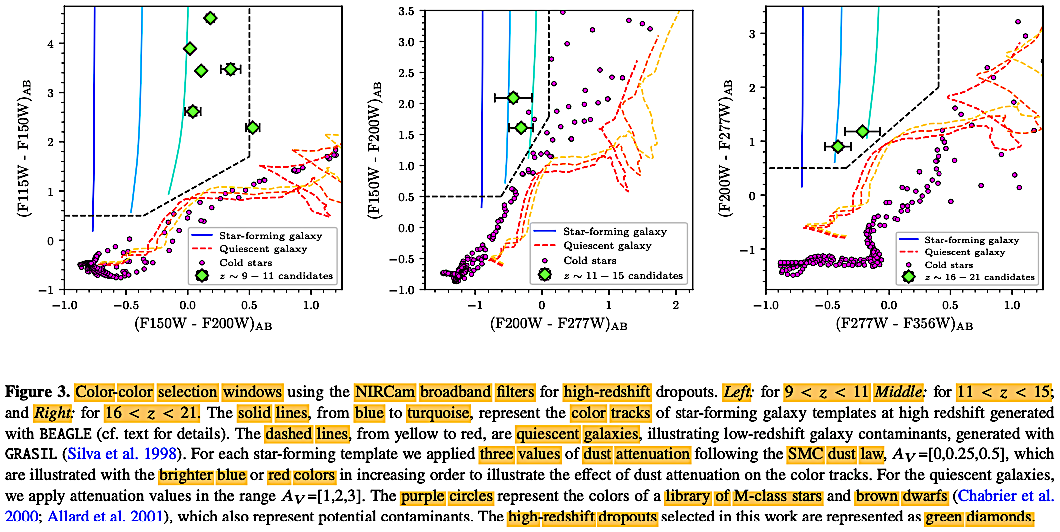
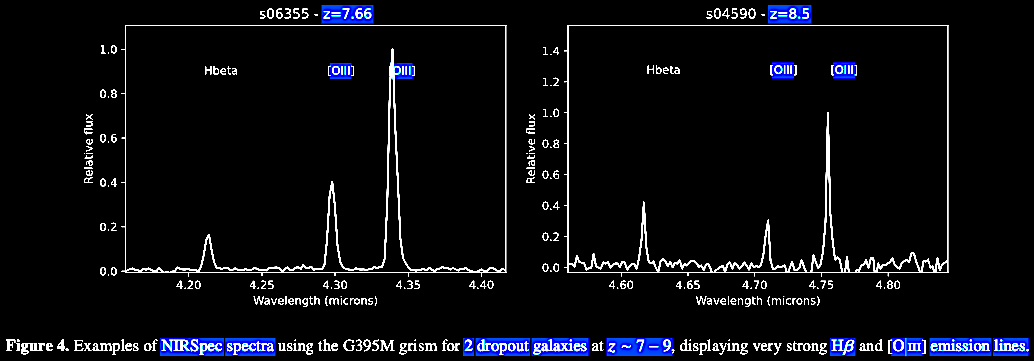 Note
Note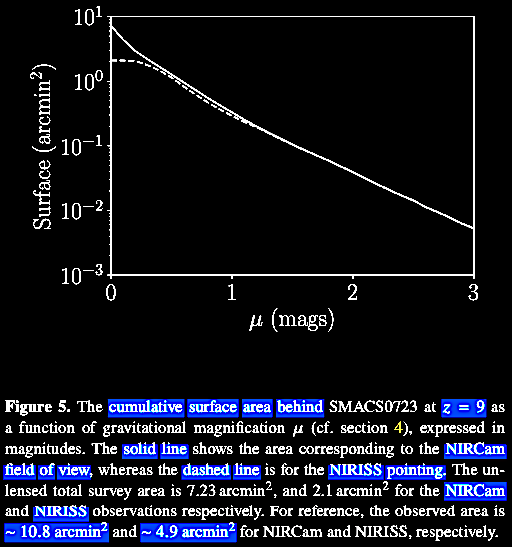
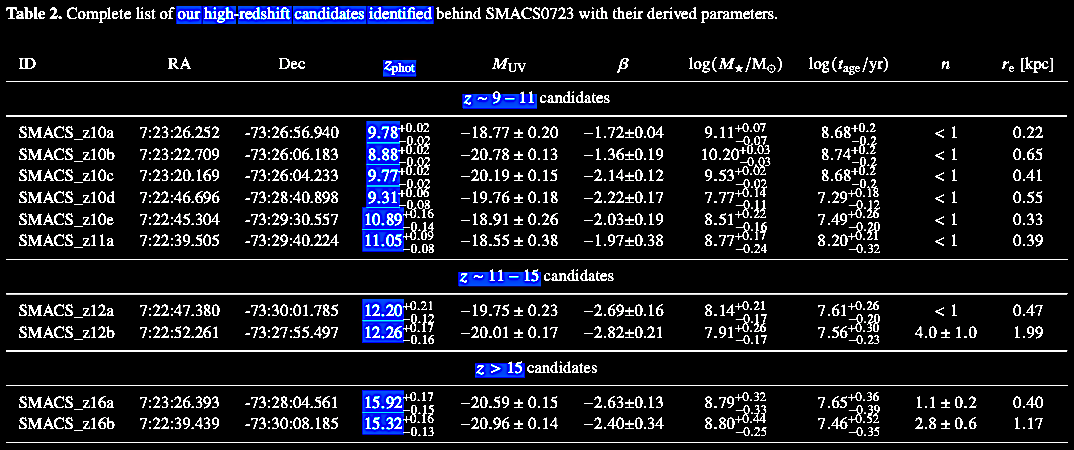
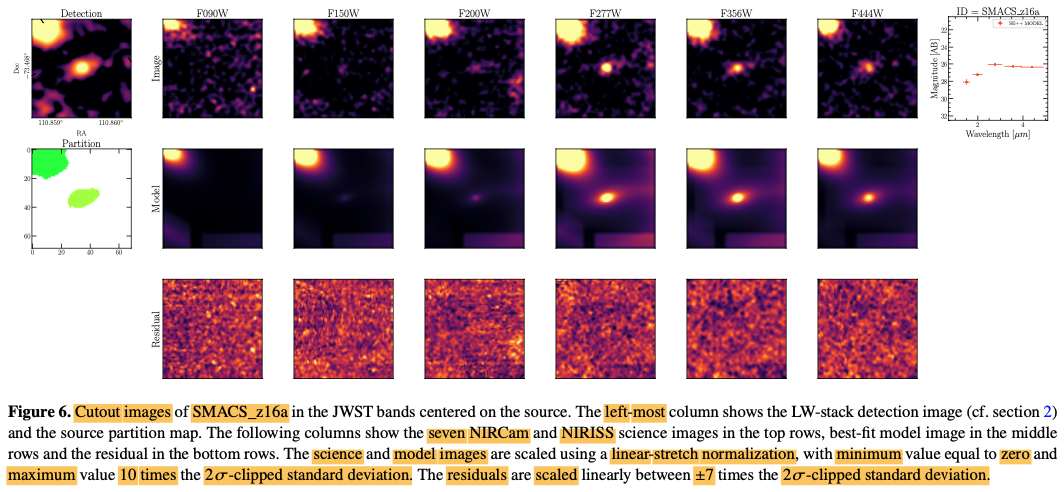
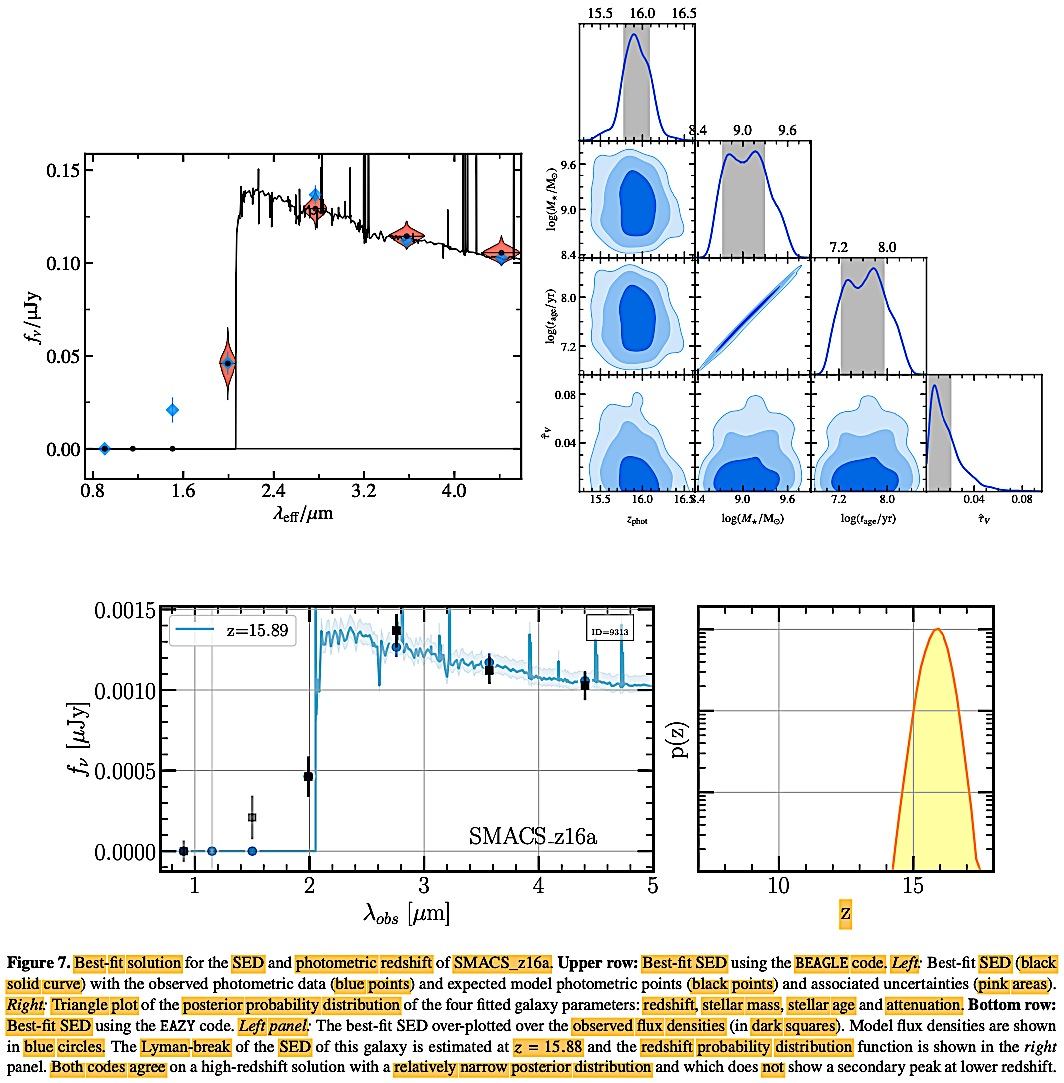
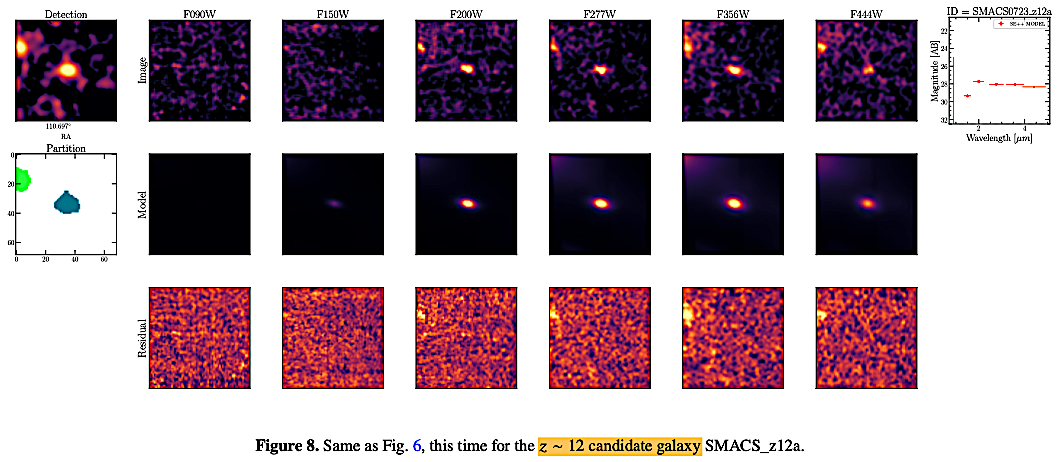
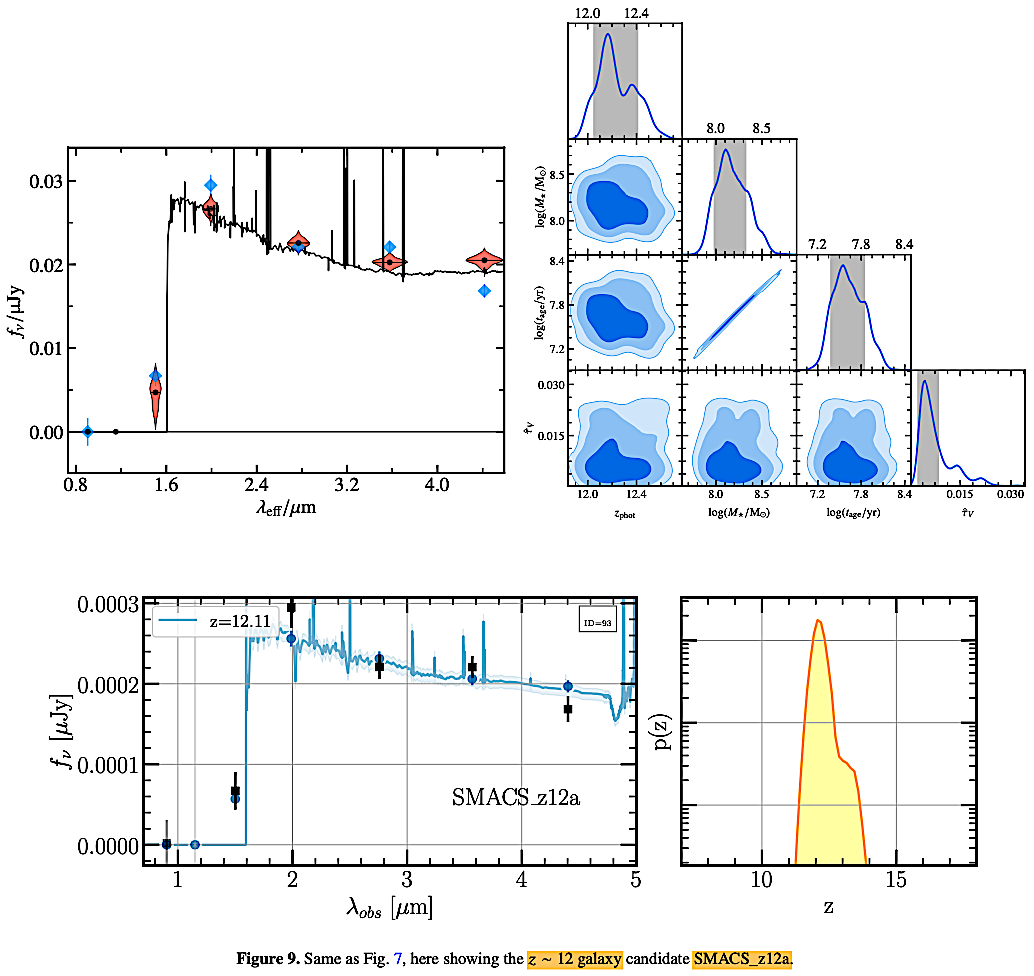
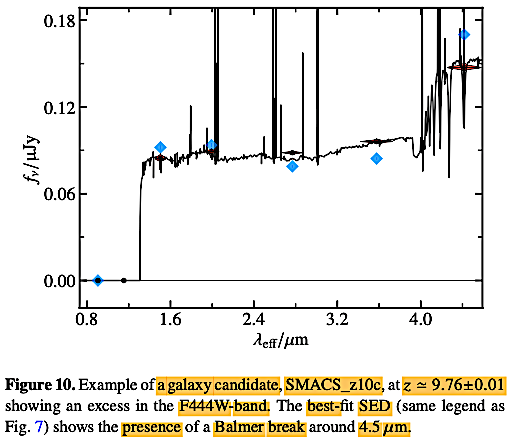
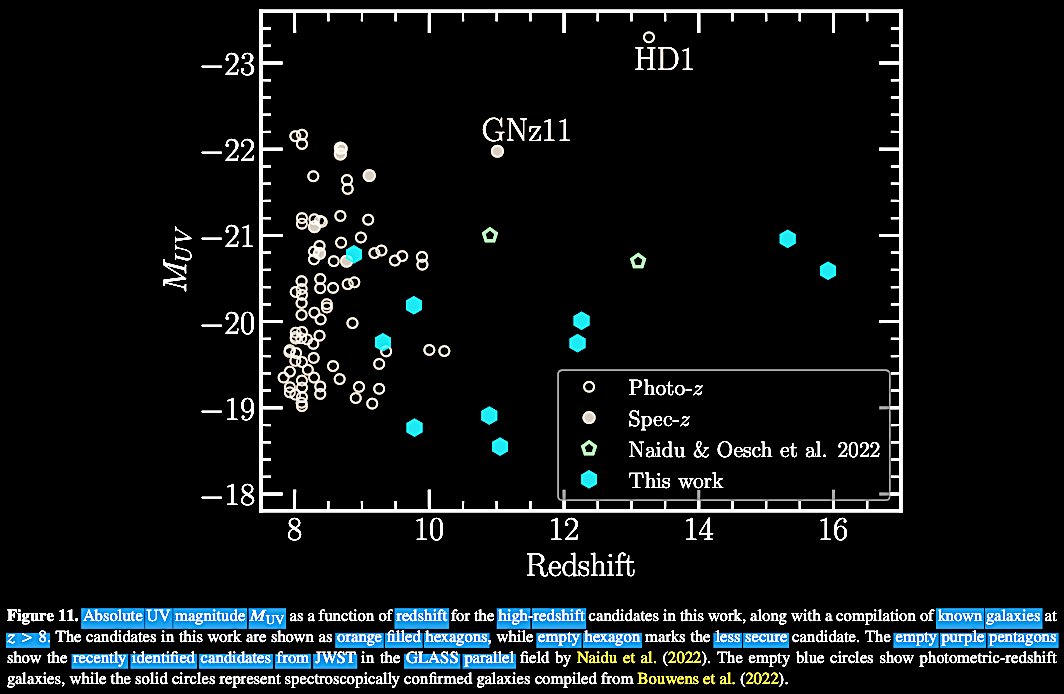
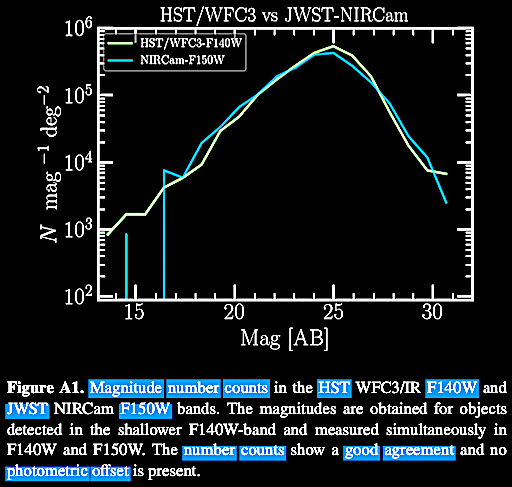
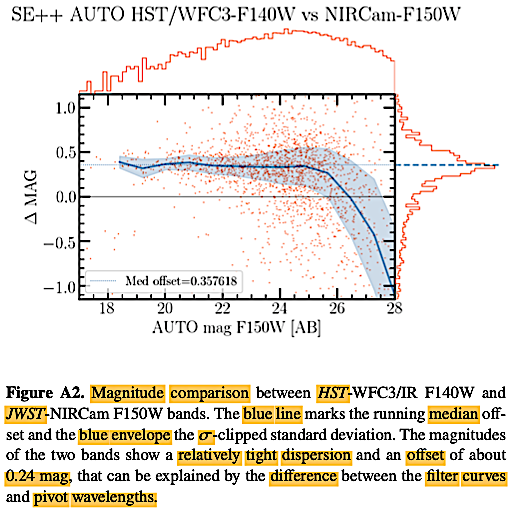
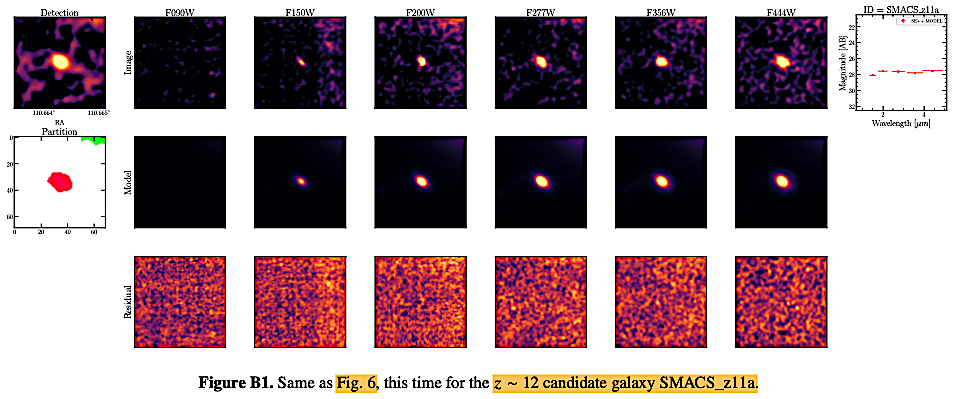
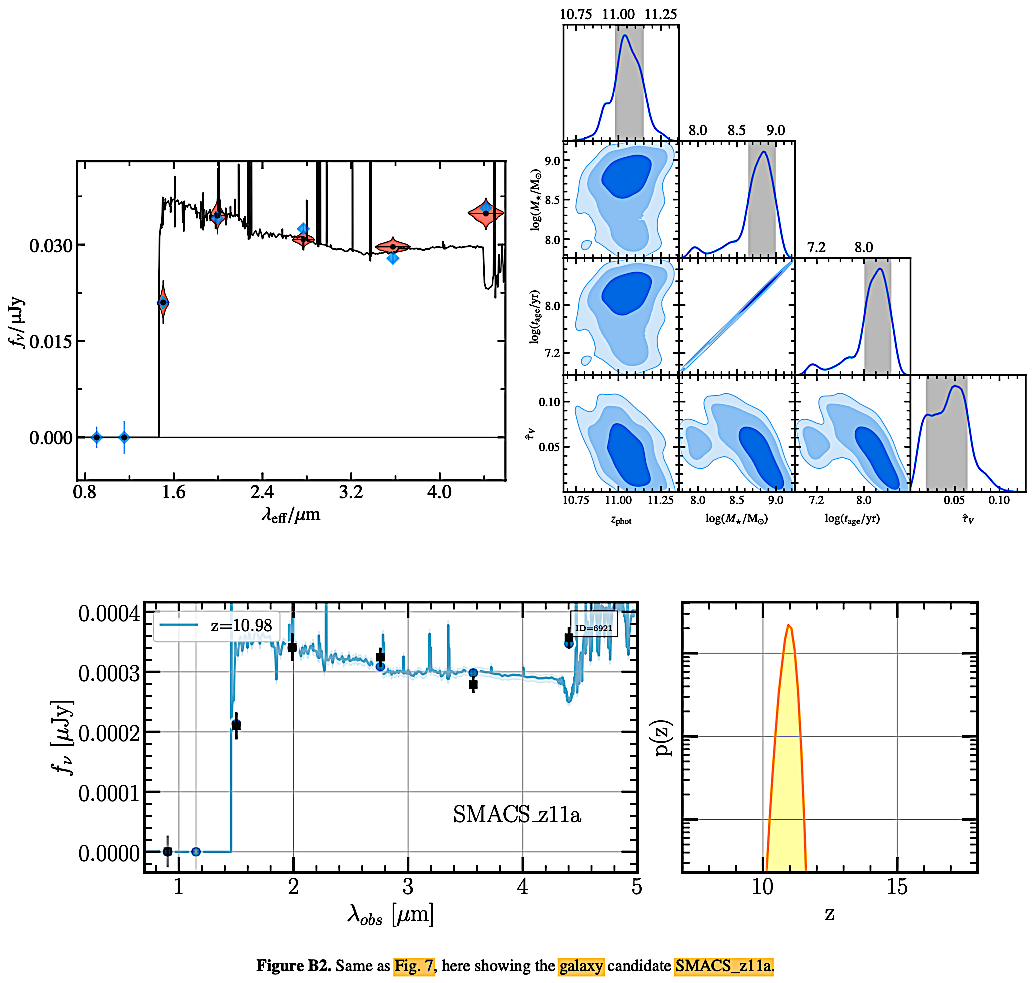
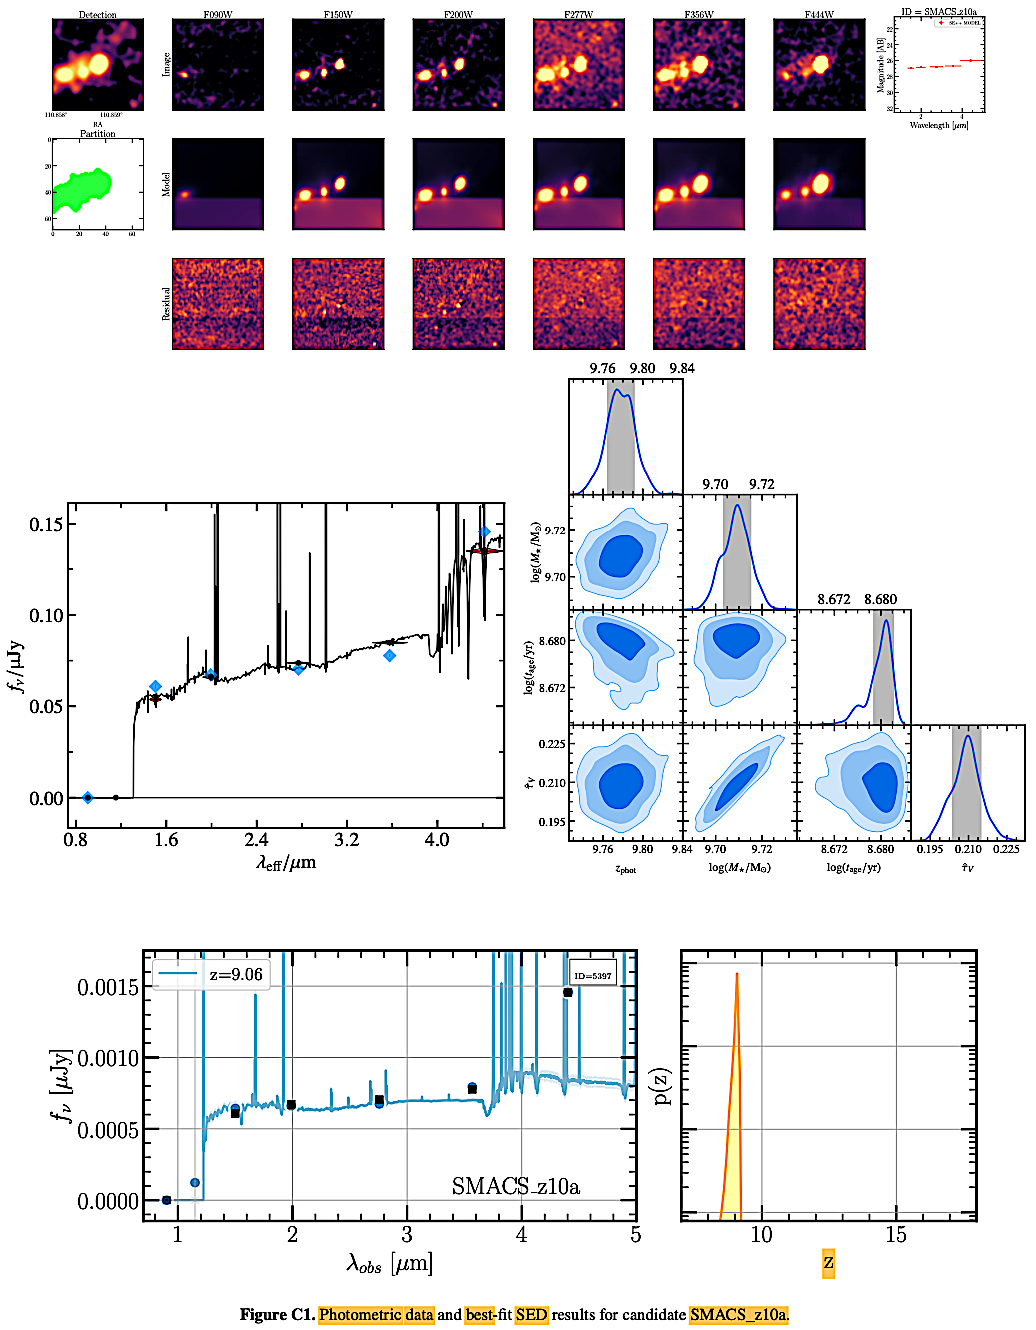
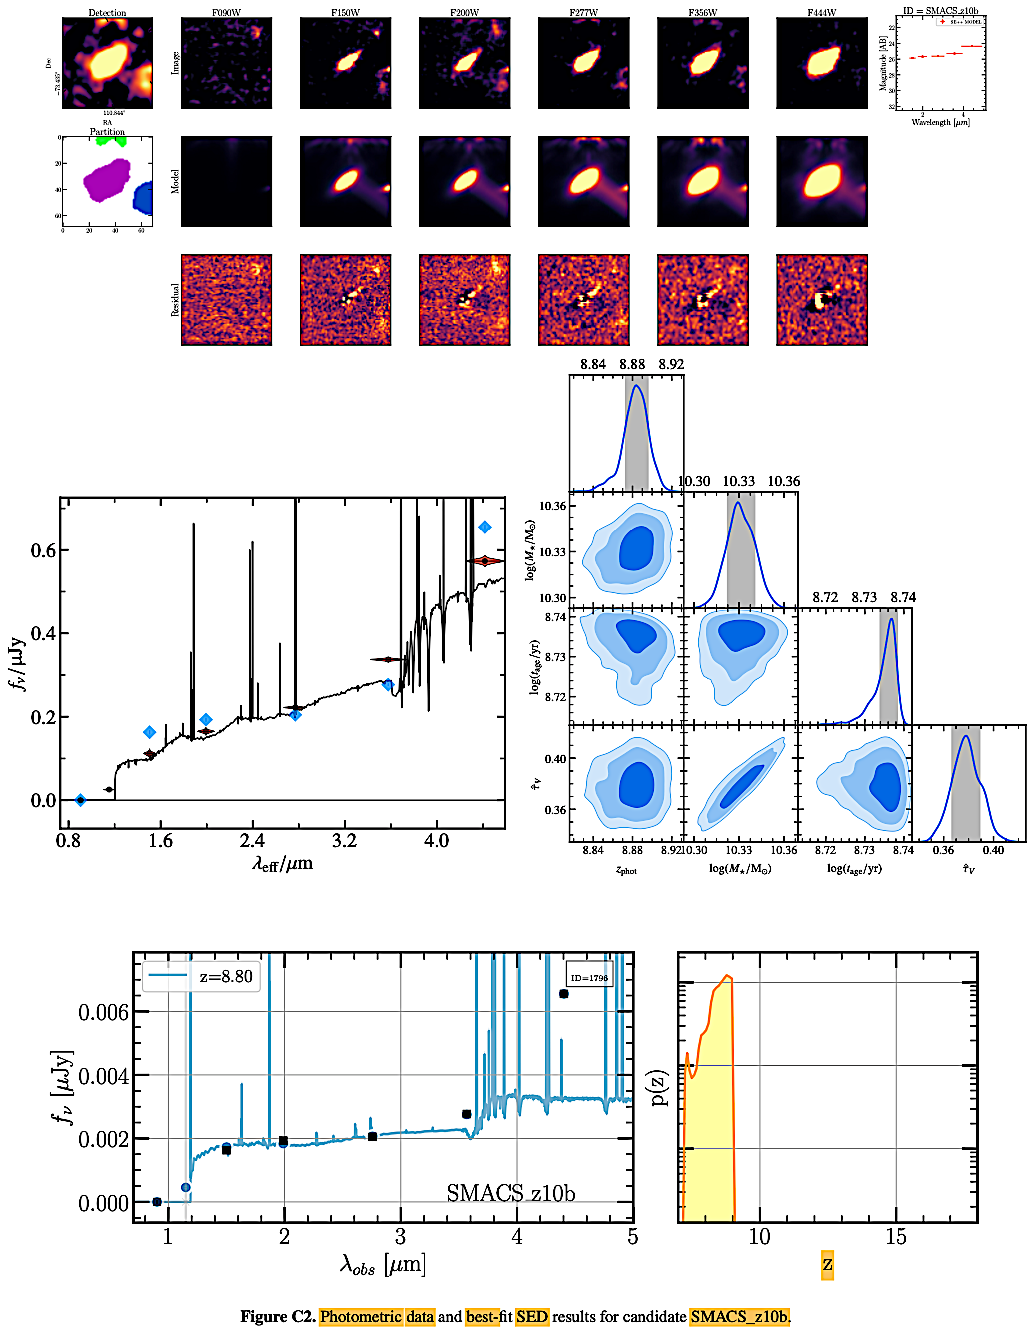
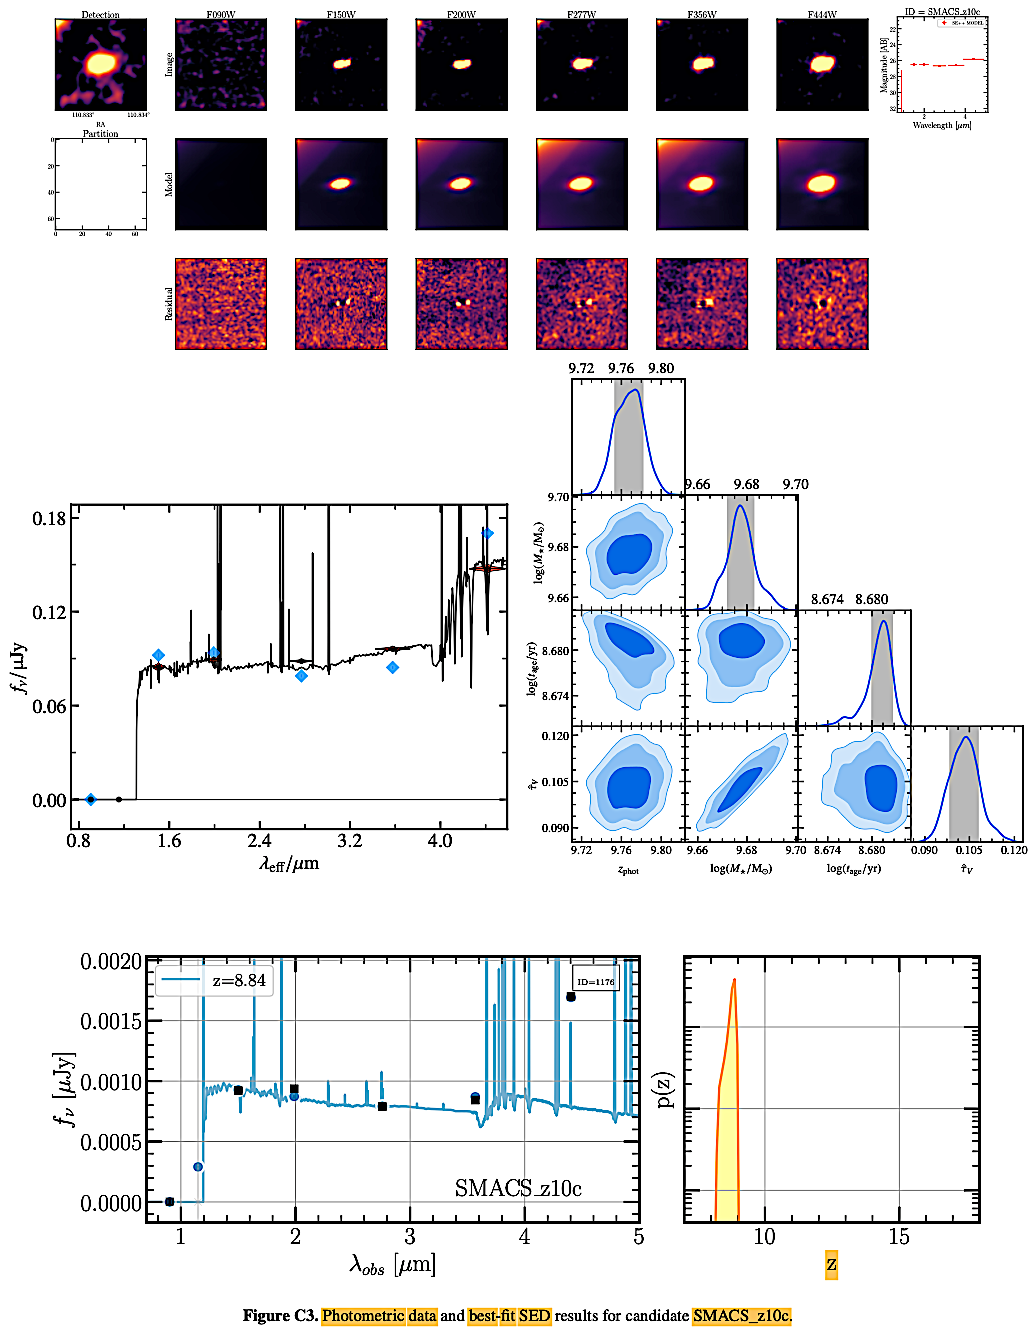
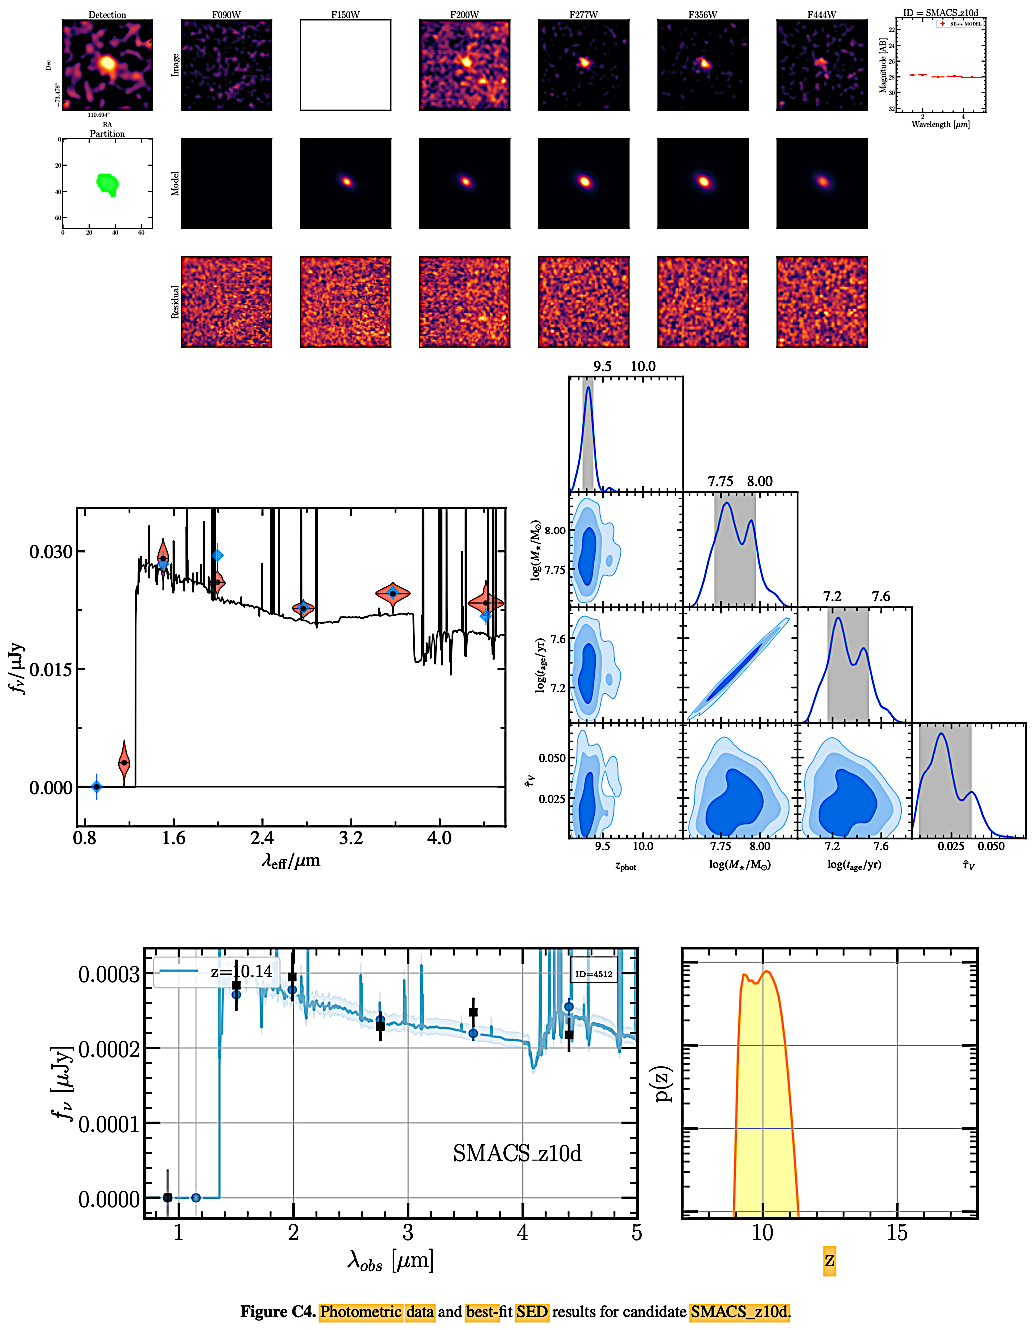
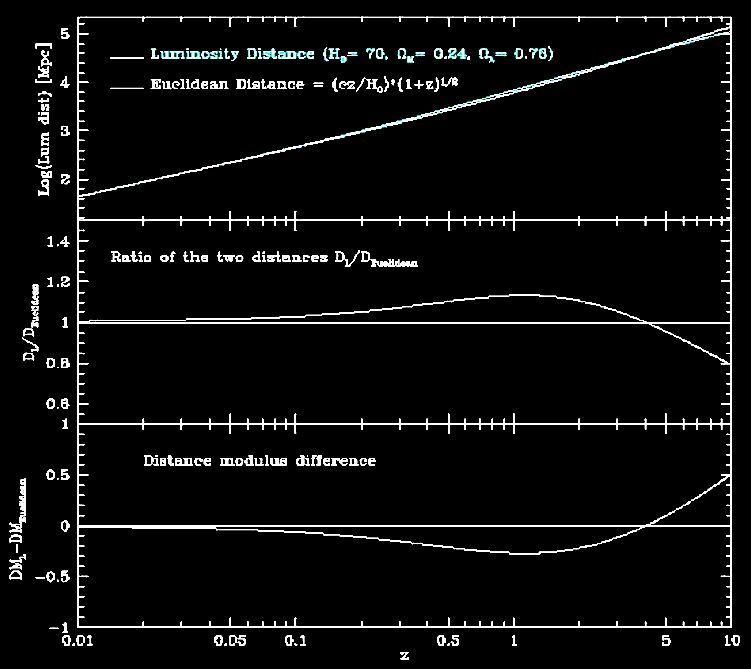
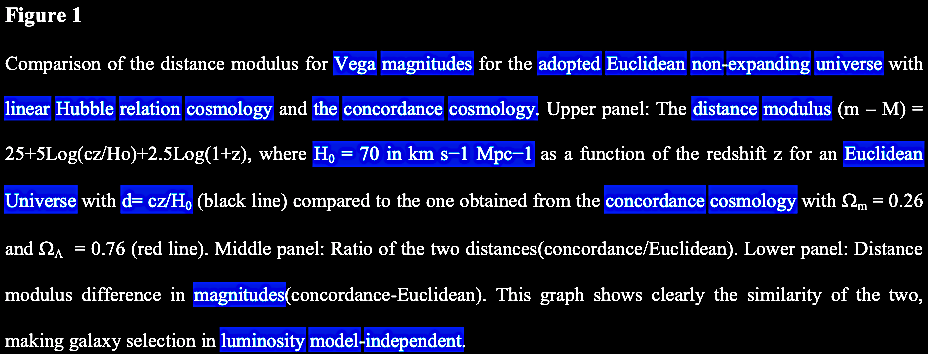
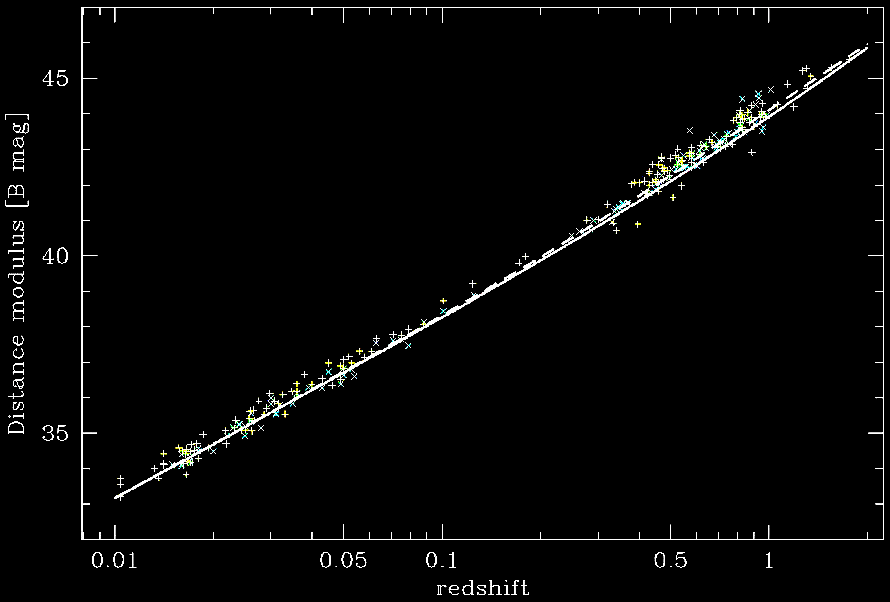
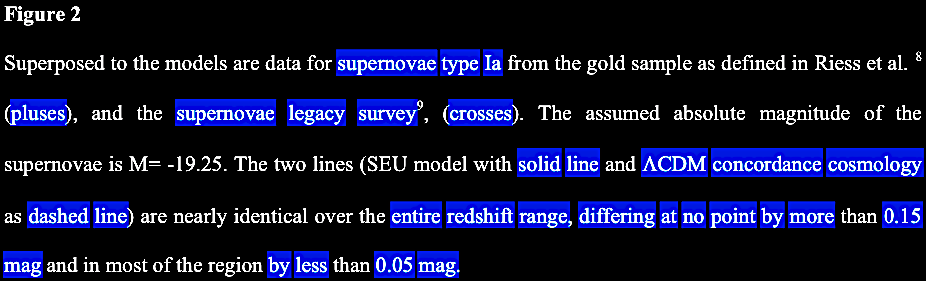
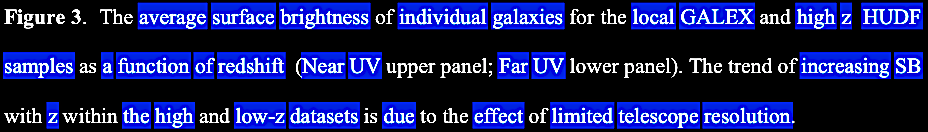
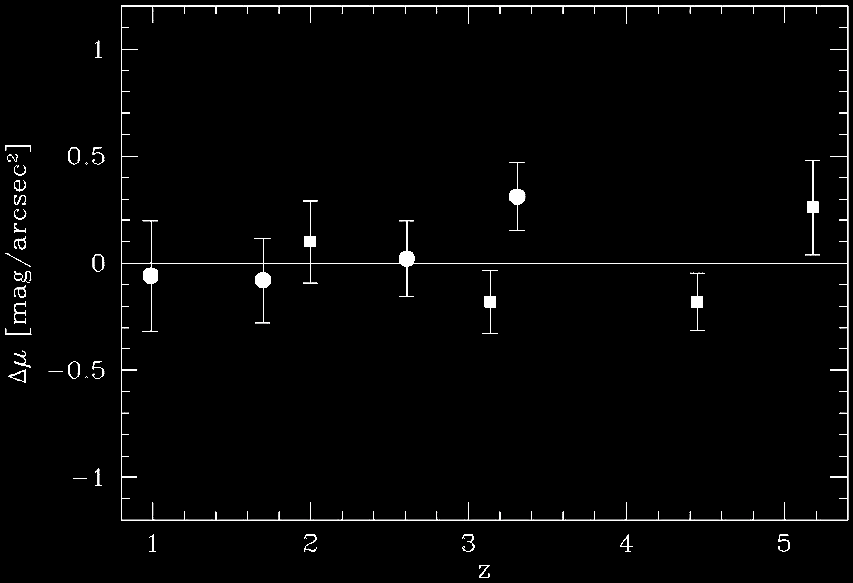
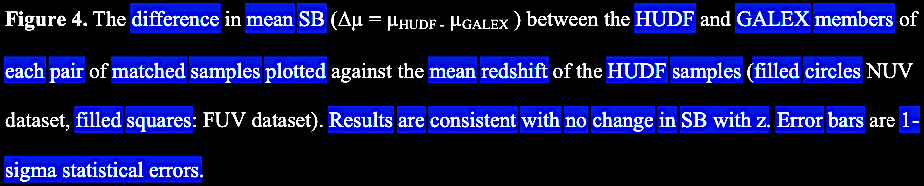
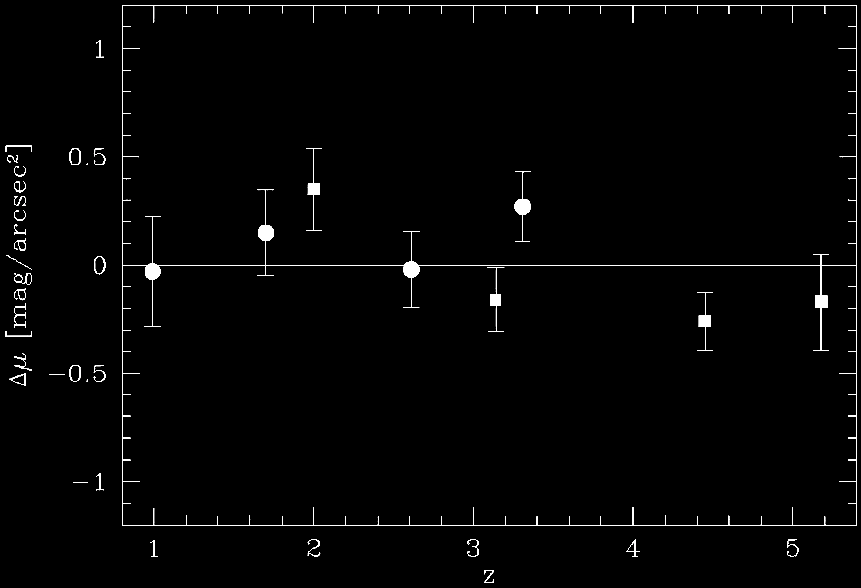
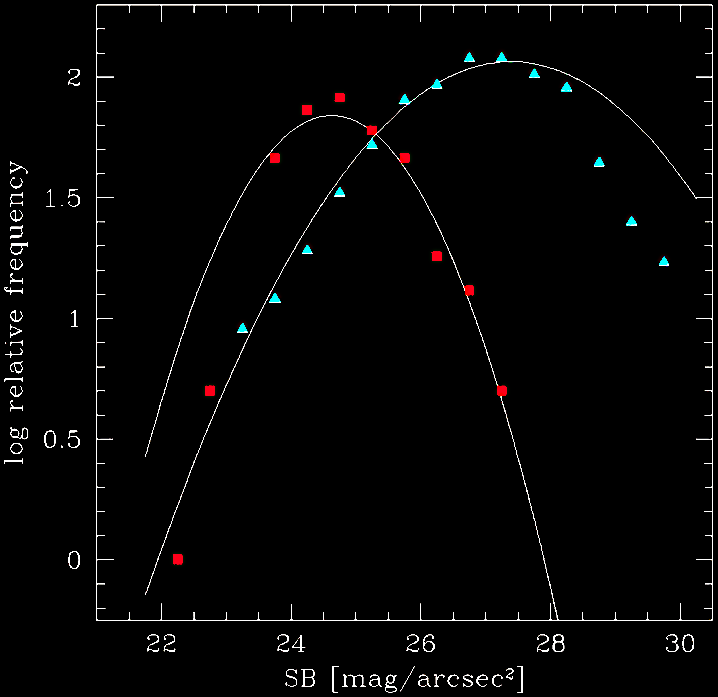
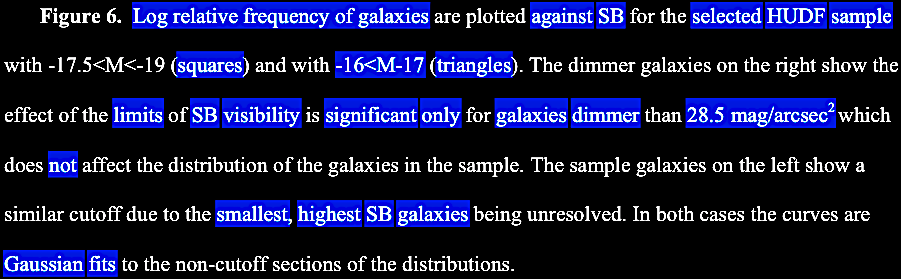
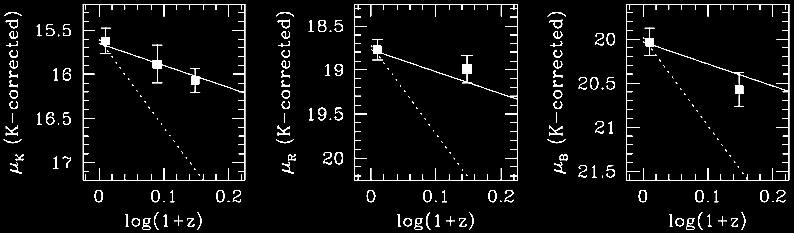
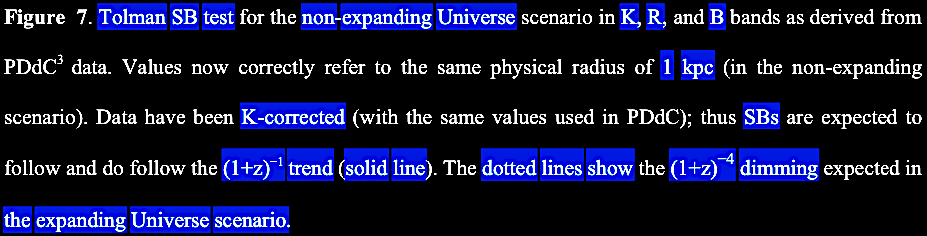
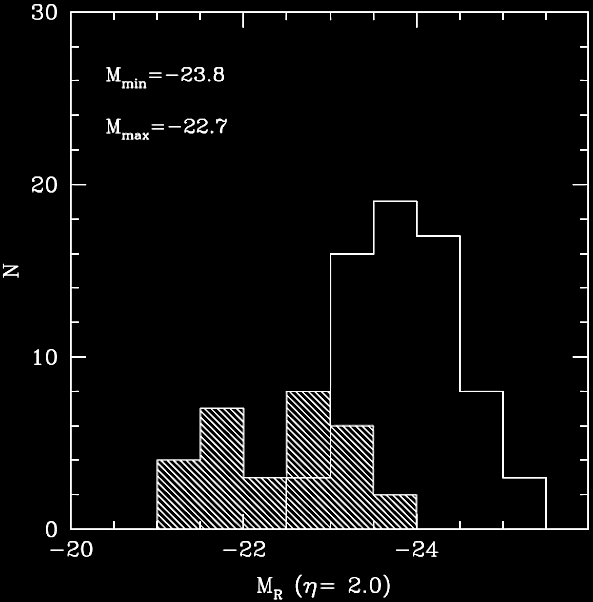
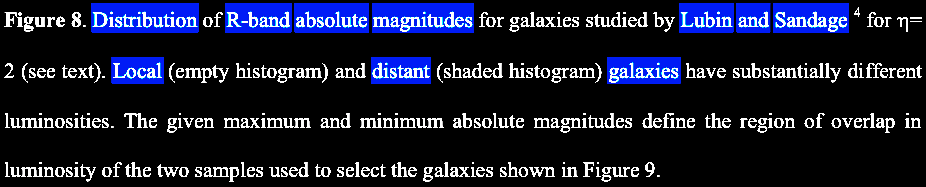
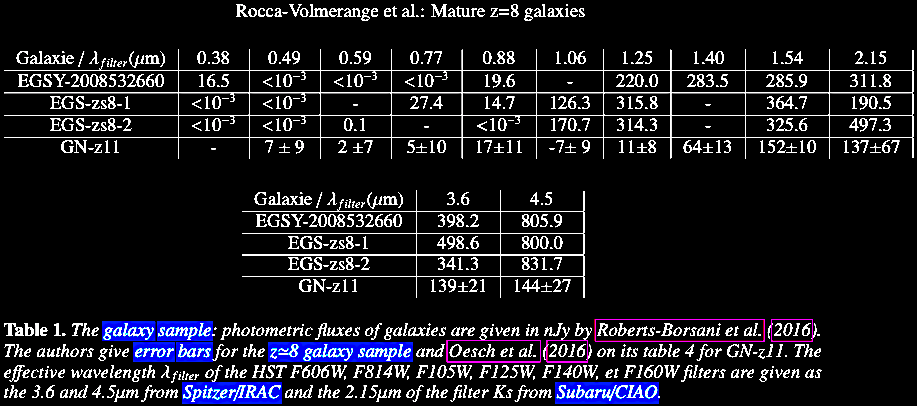
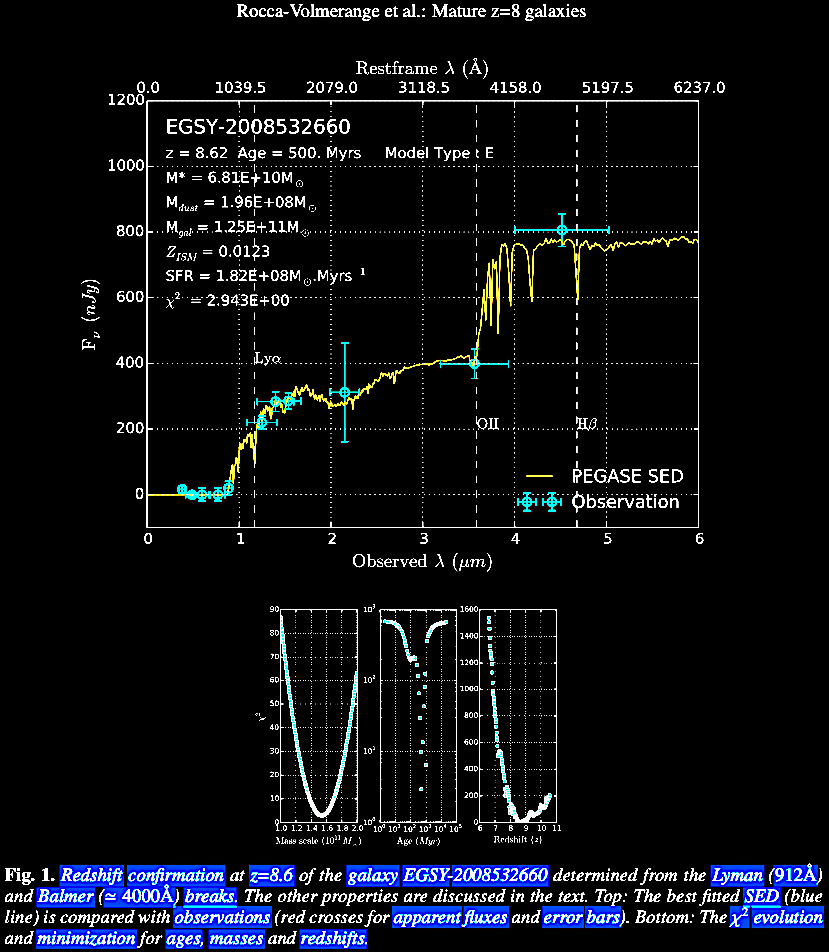
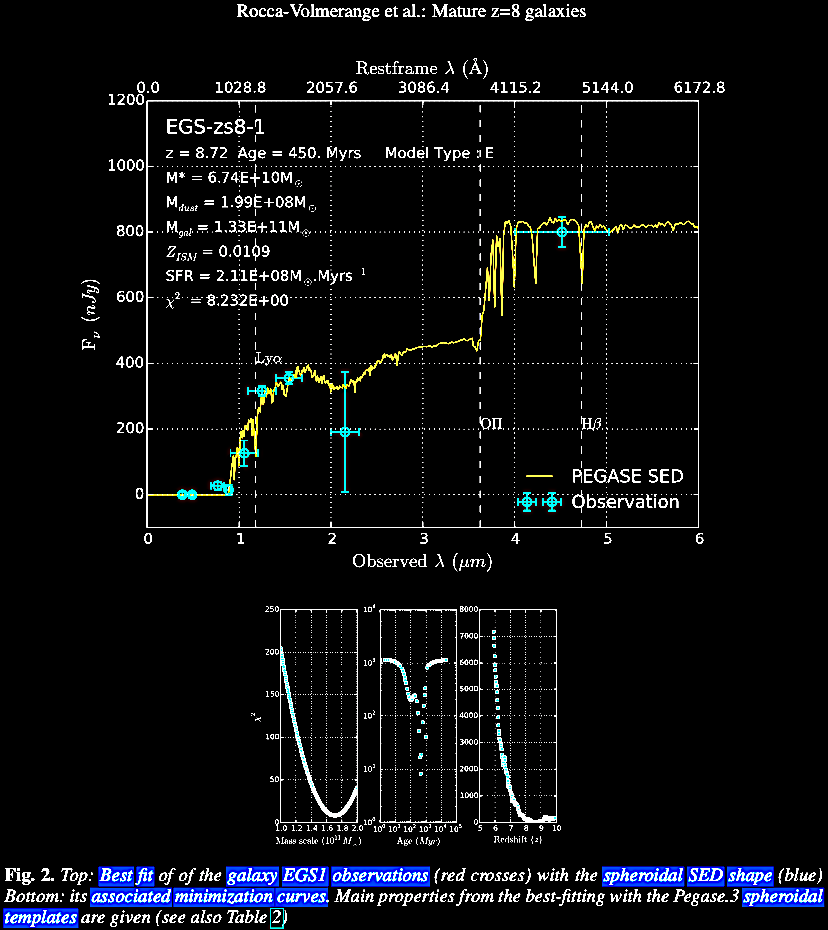
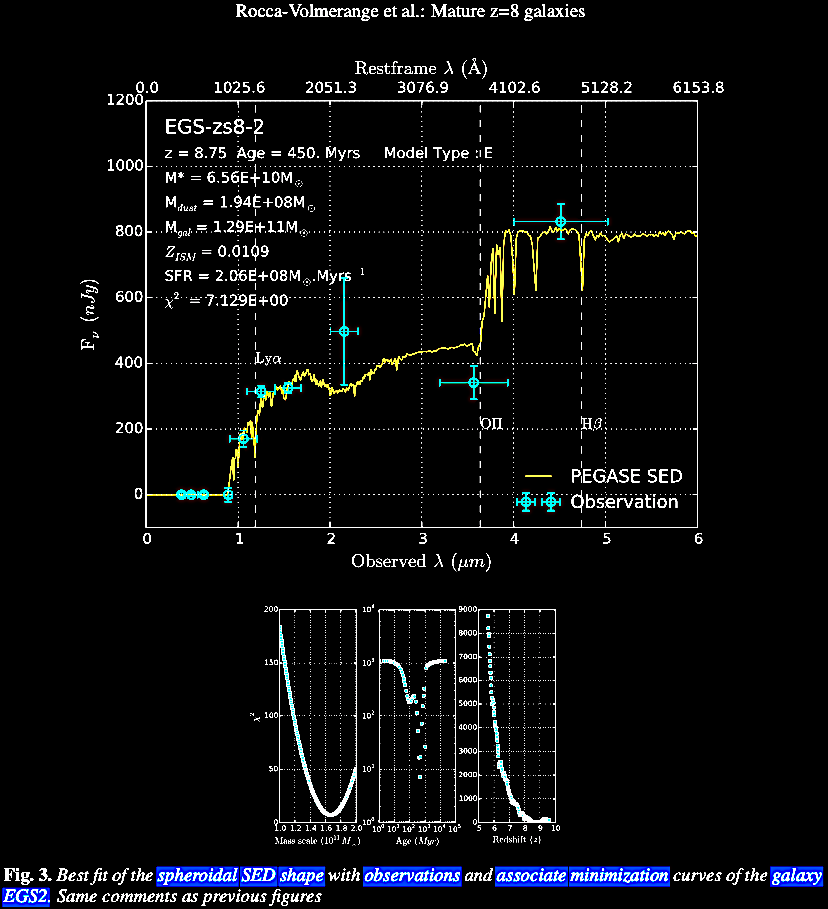
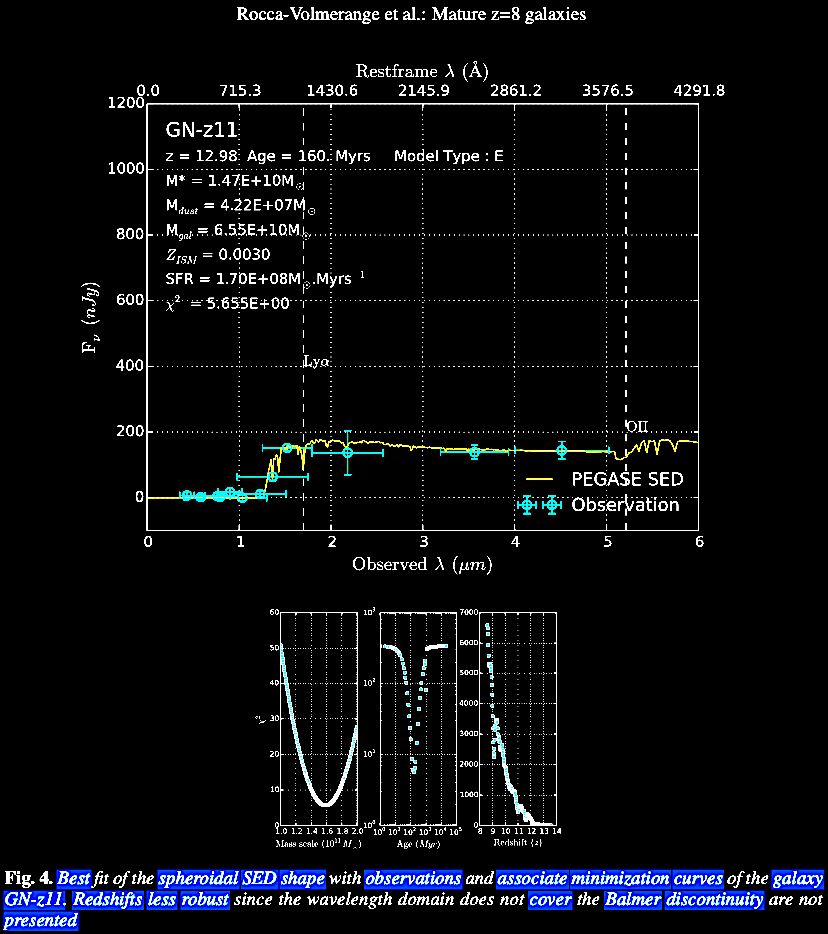
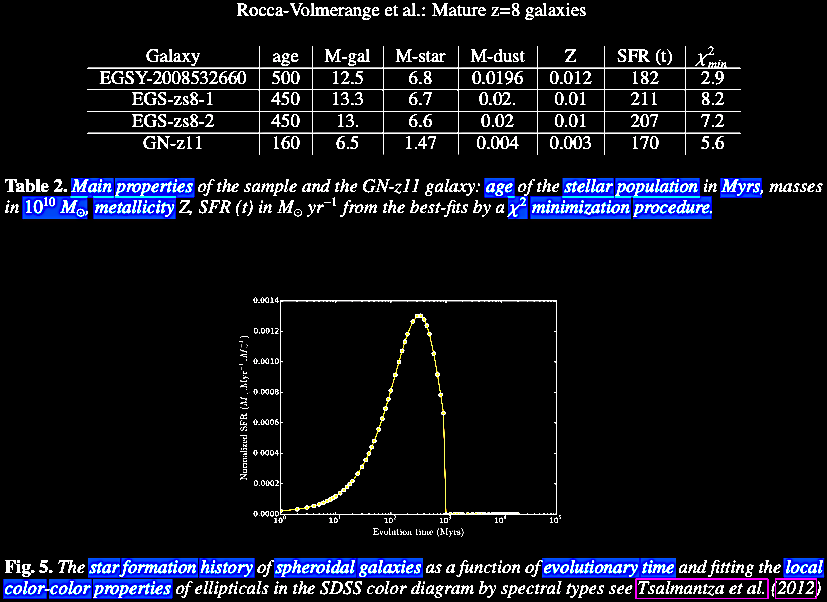
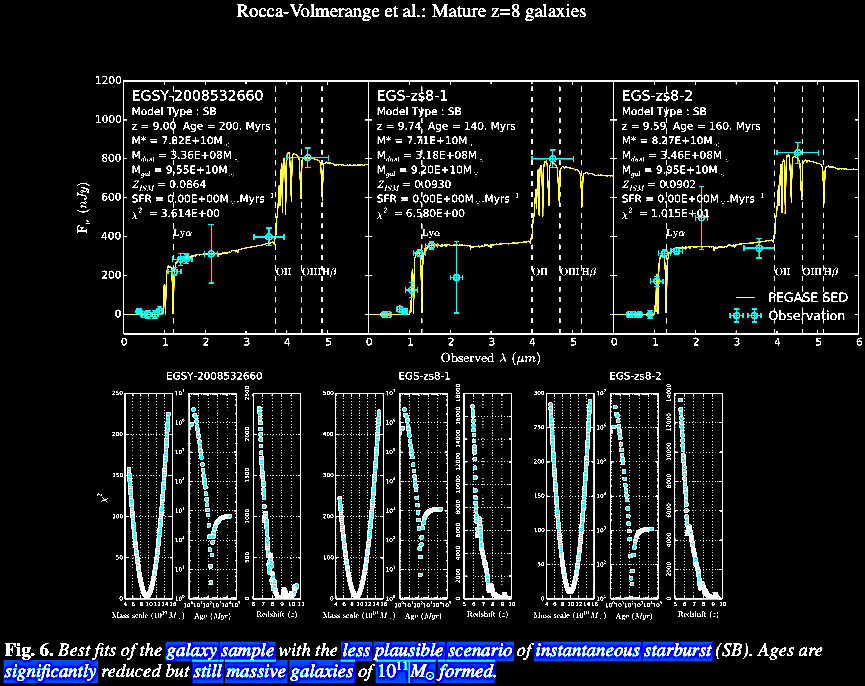
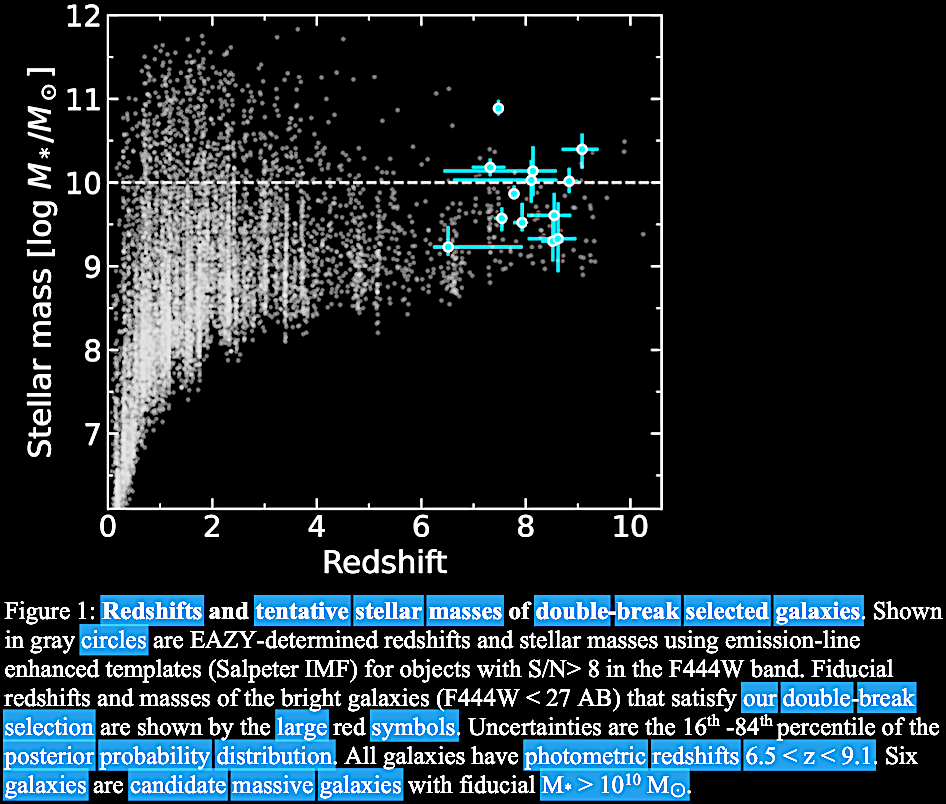
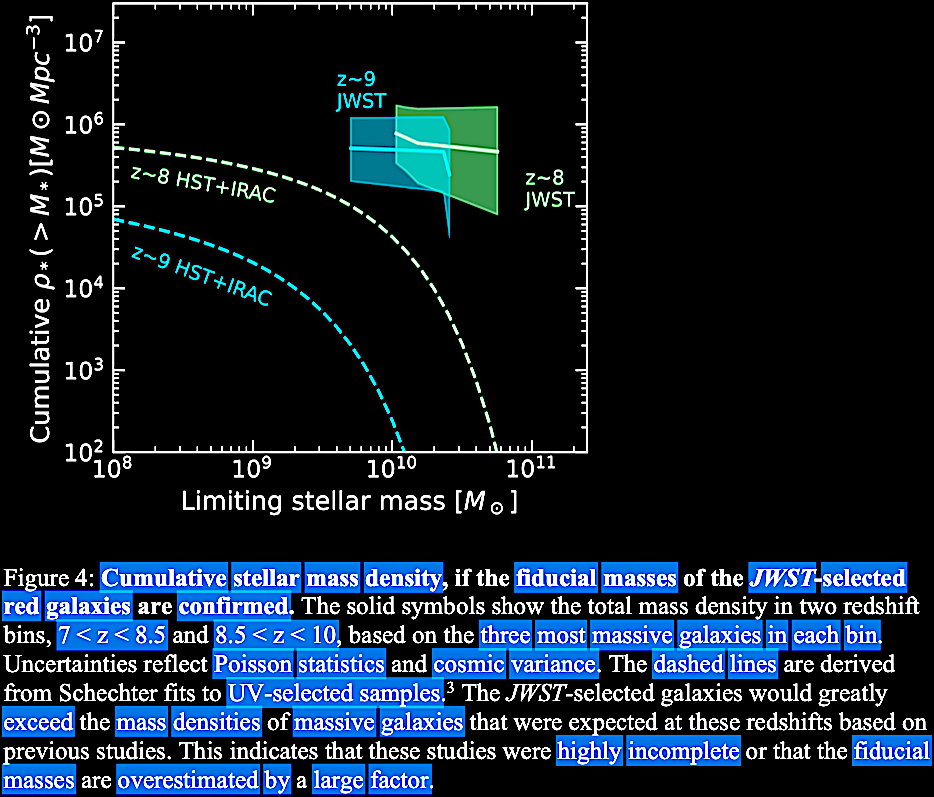
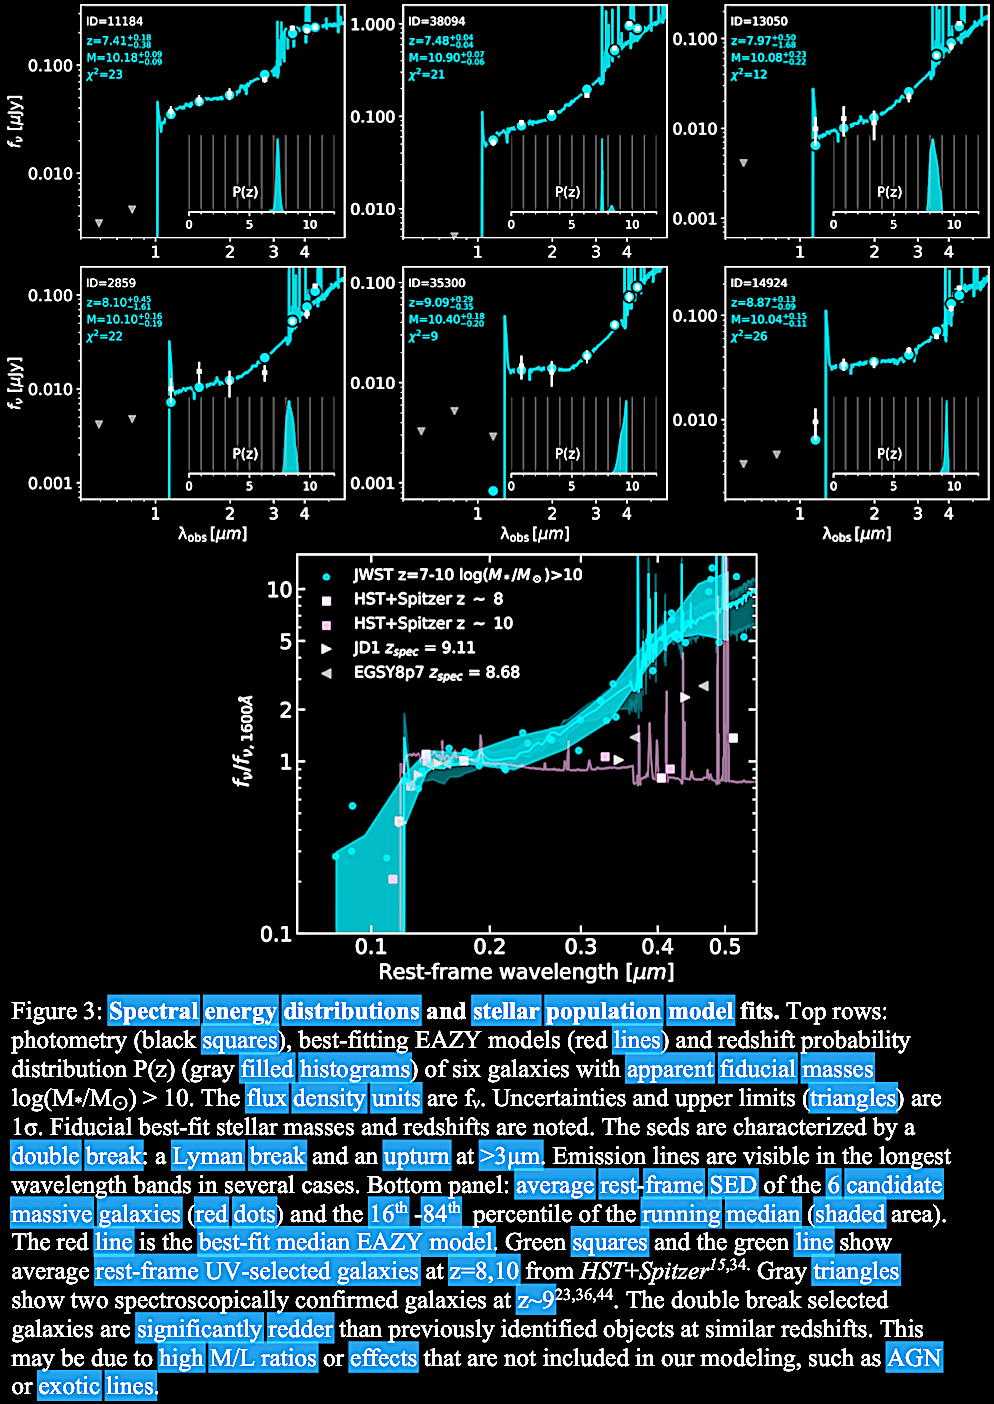
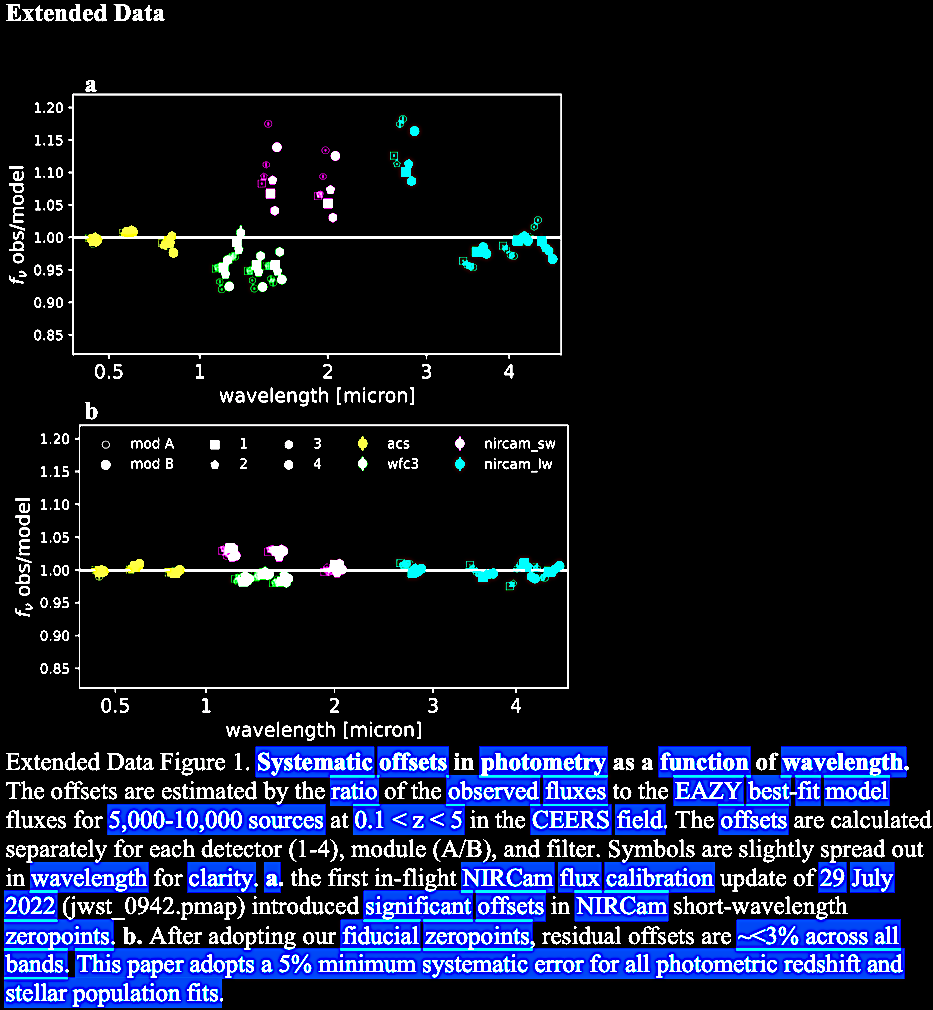
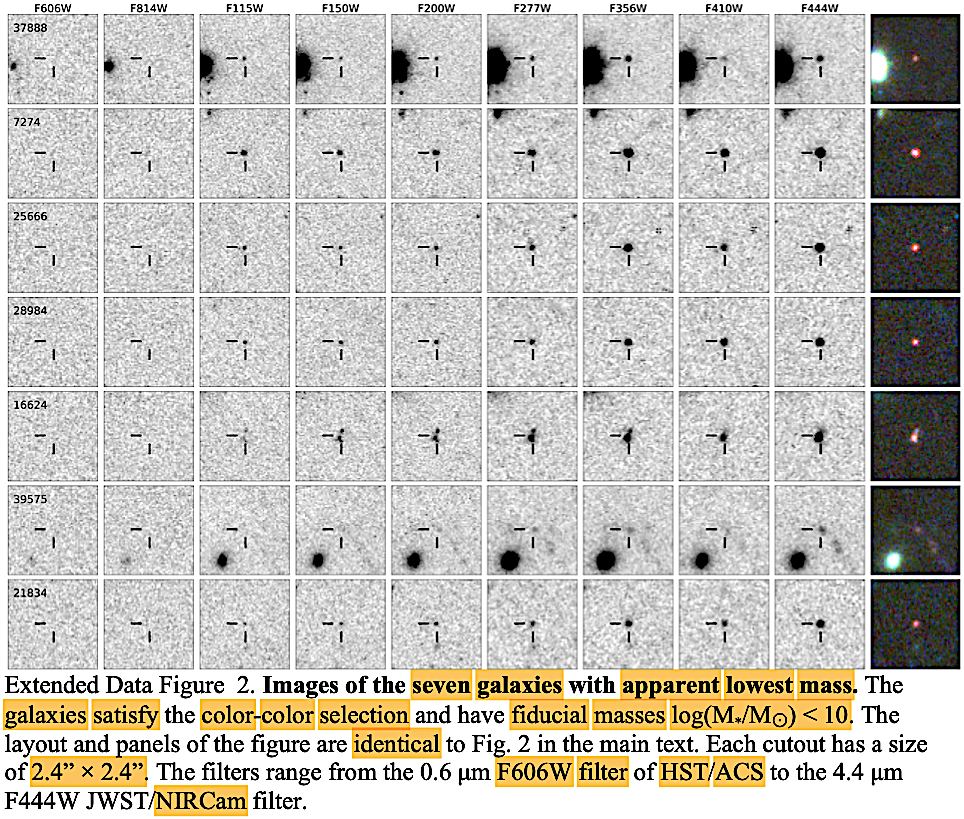
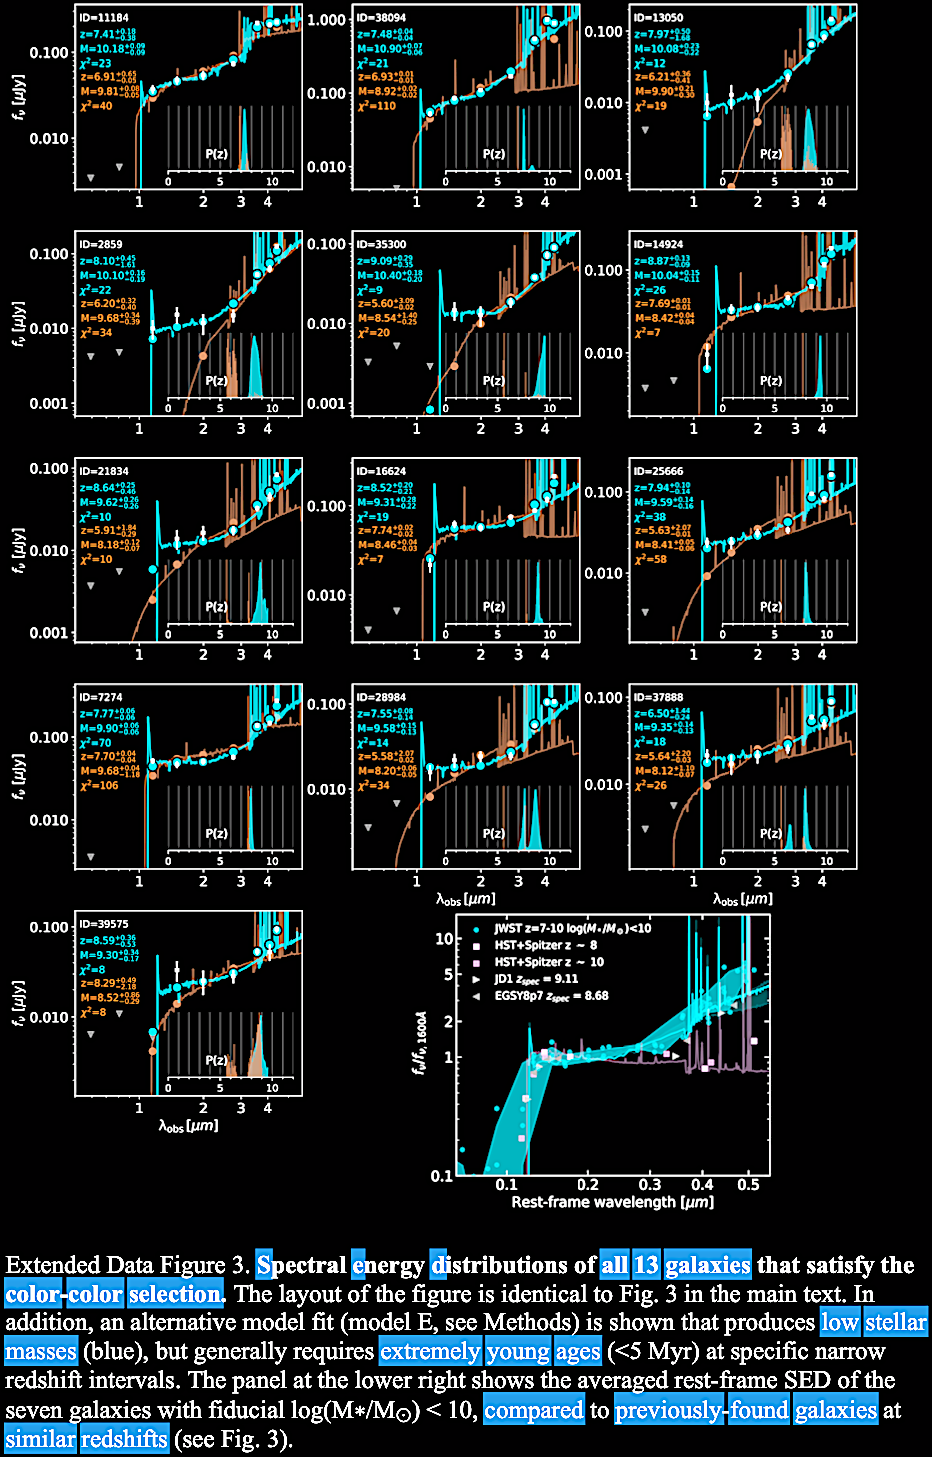
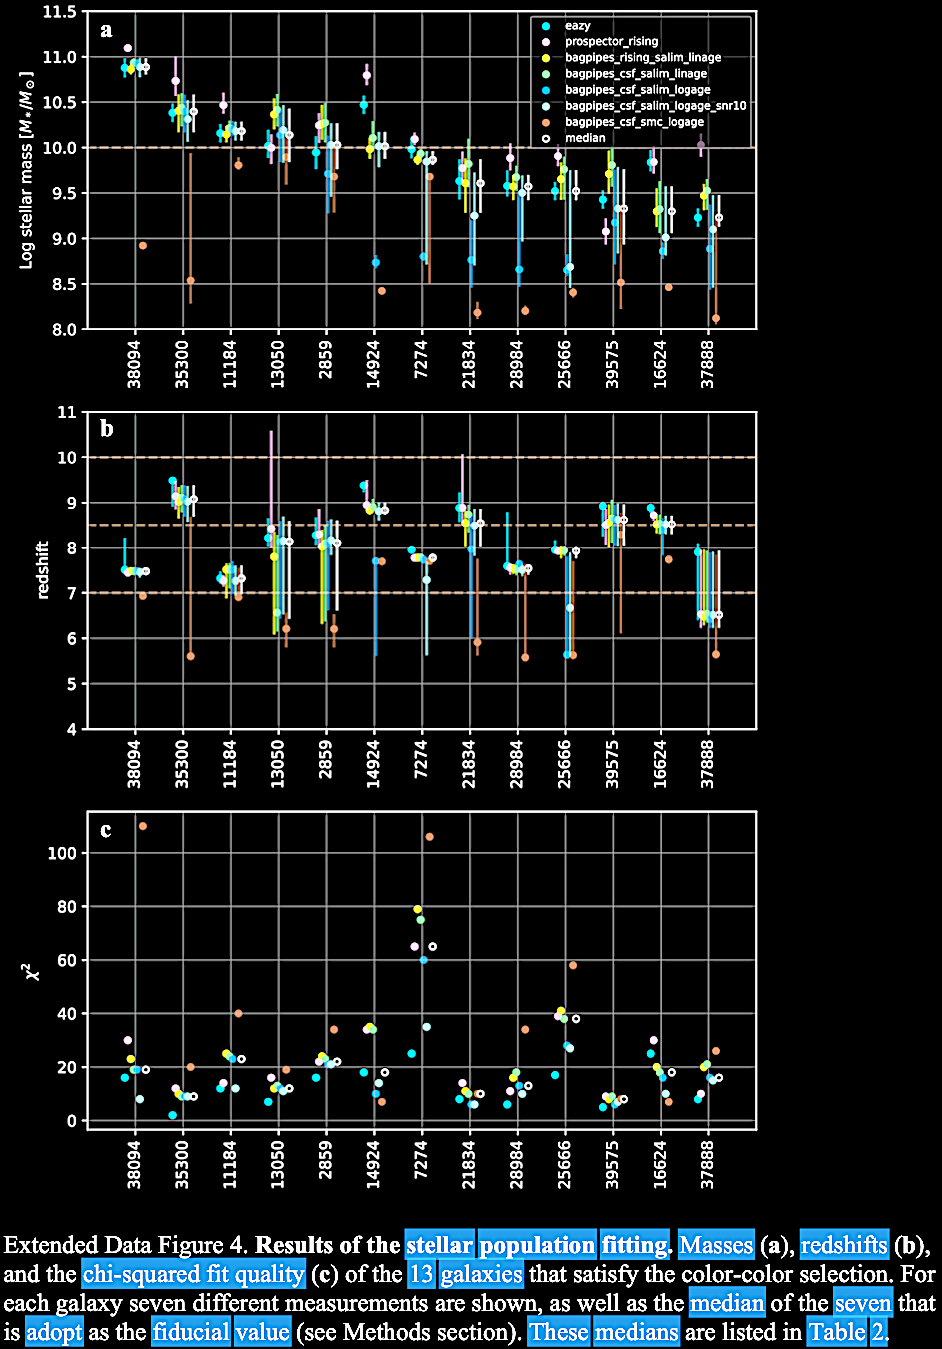
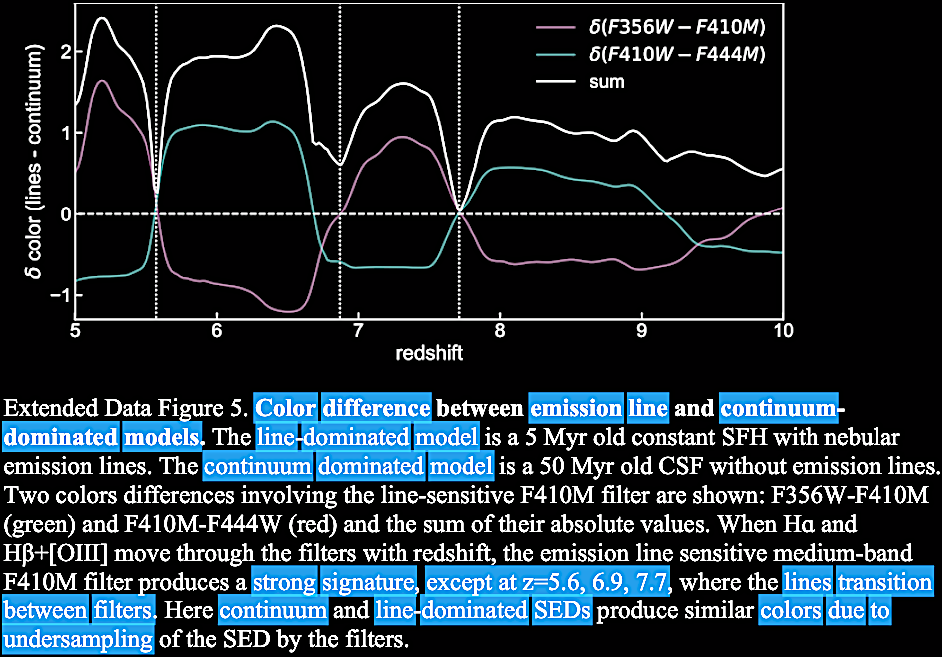
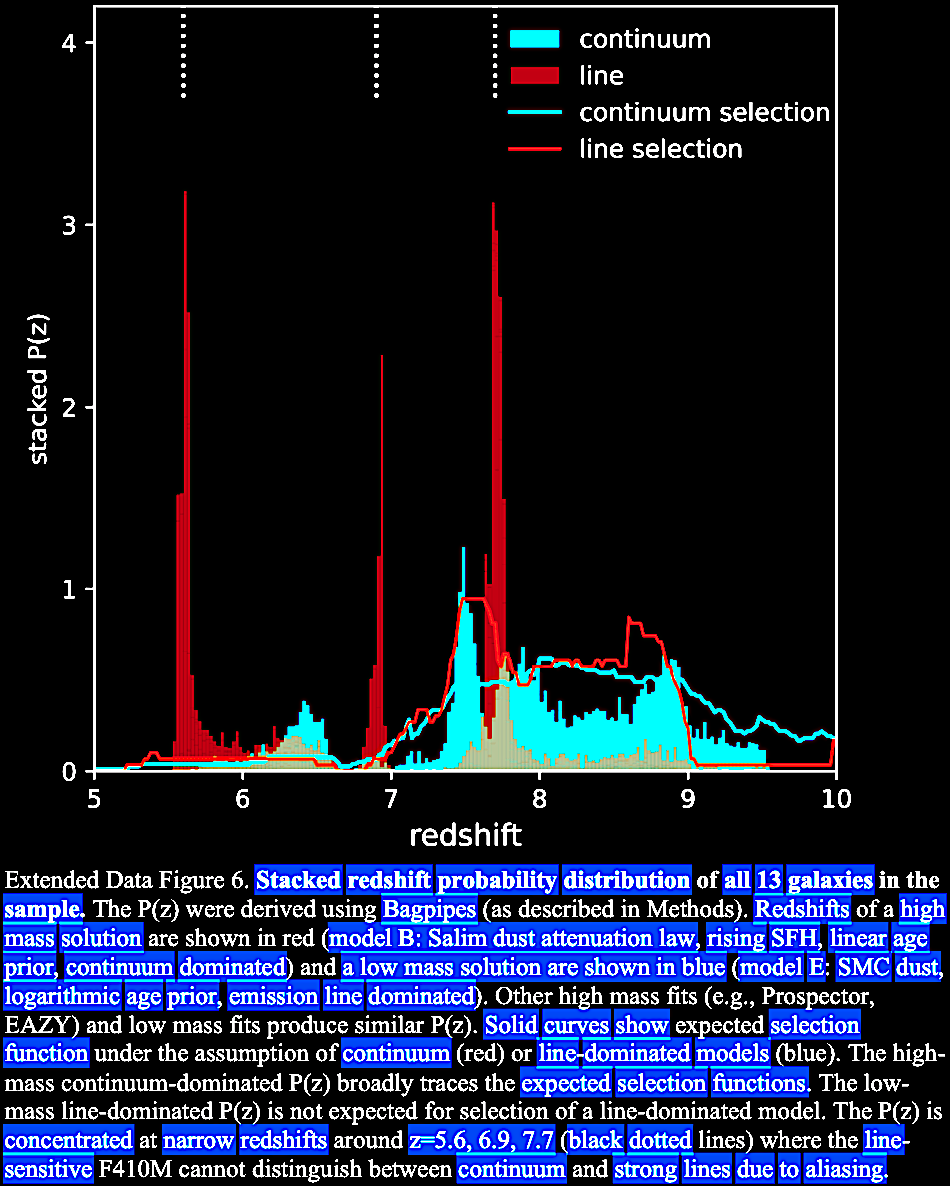
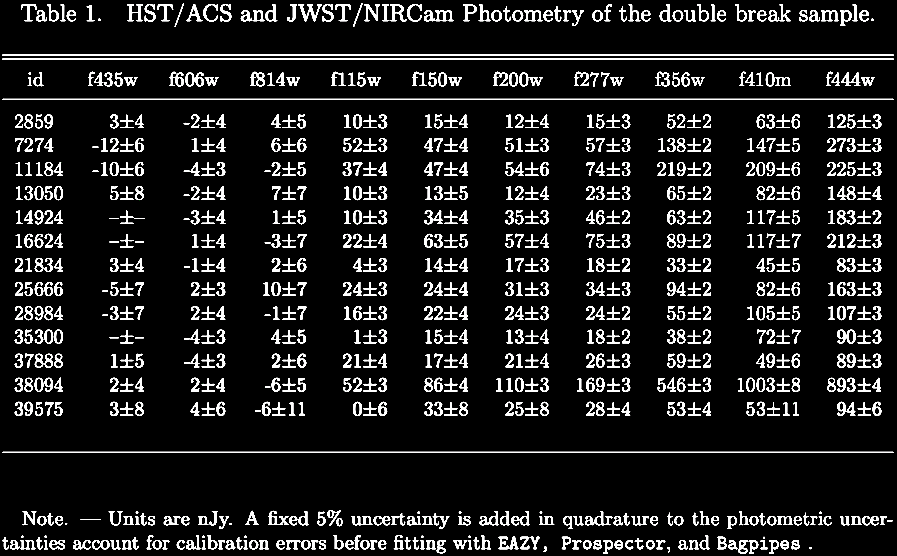
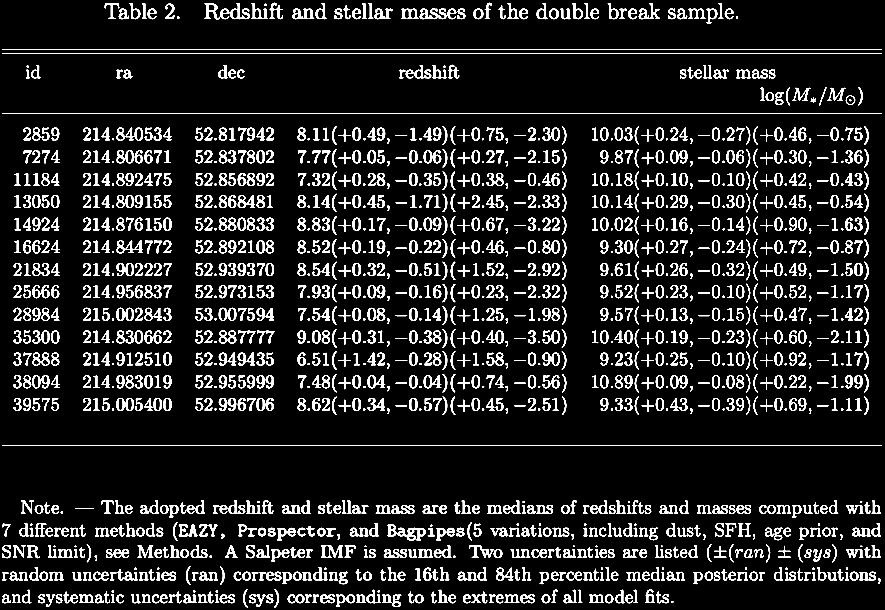
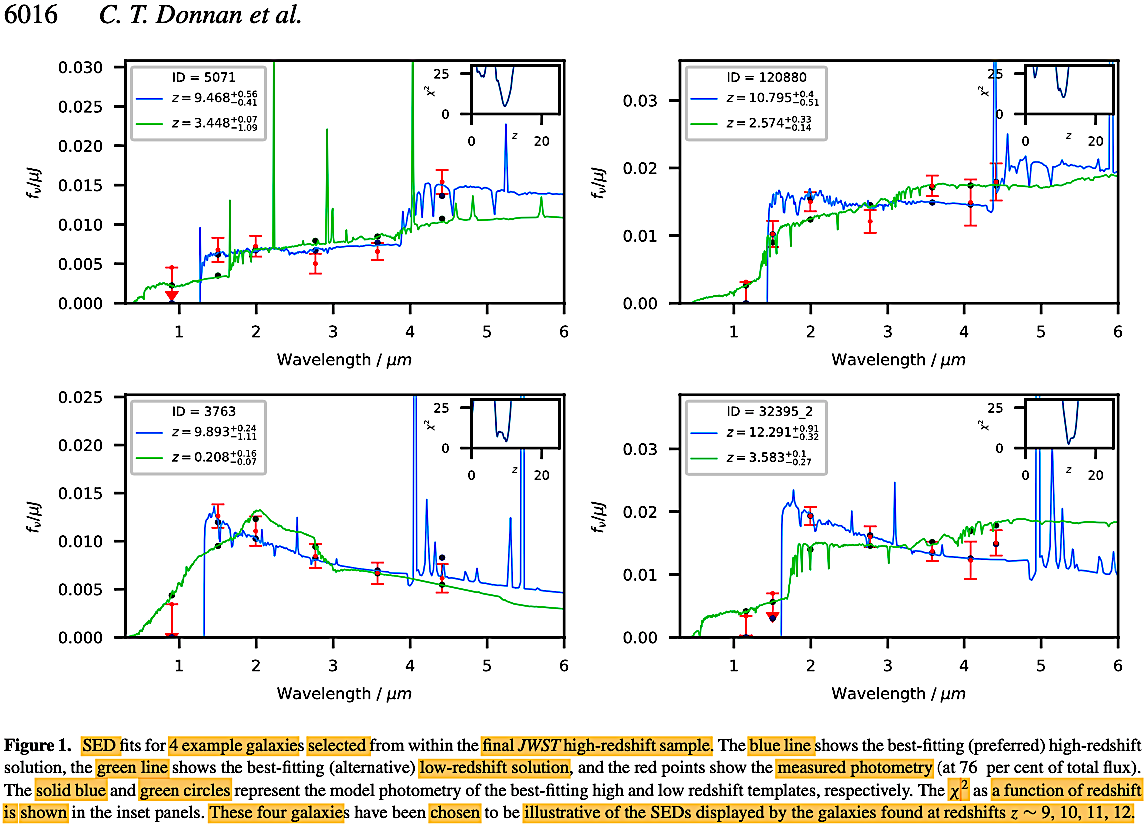
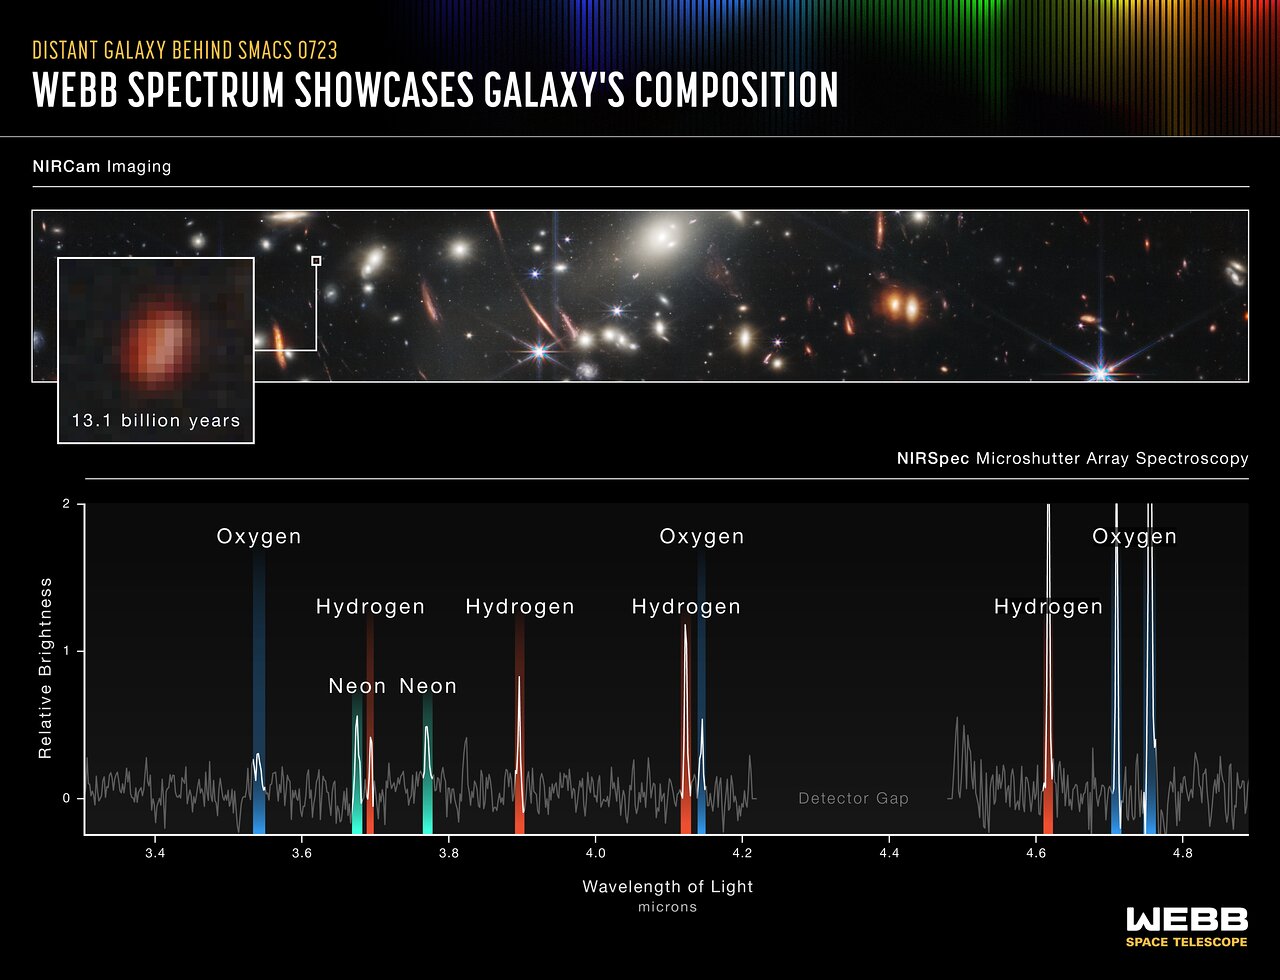
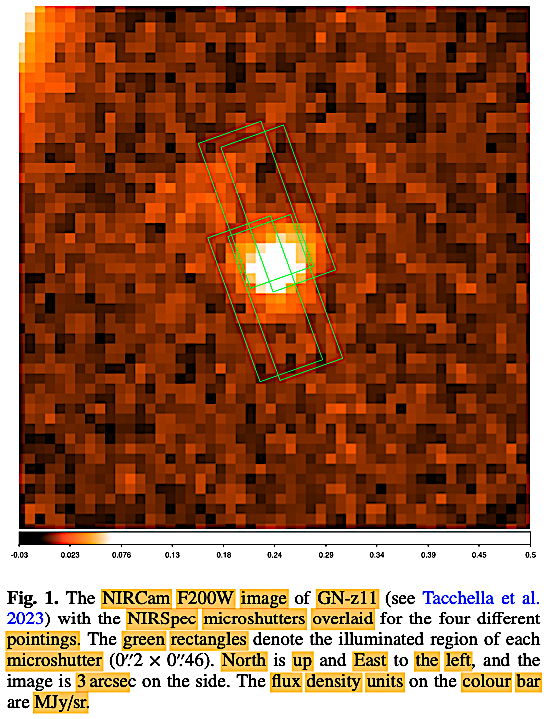
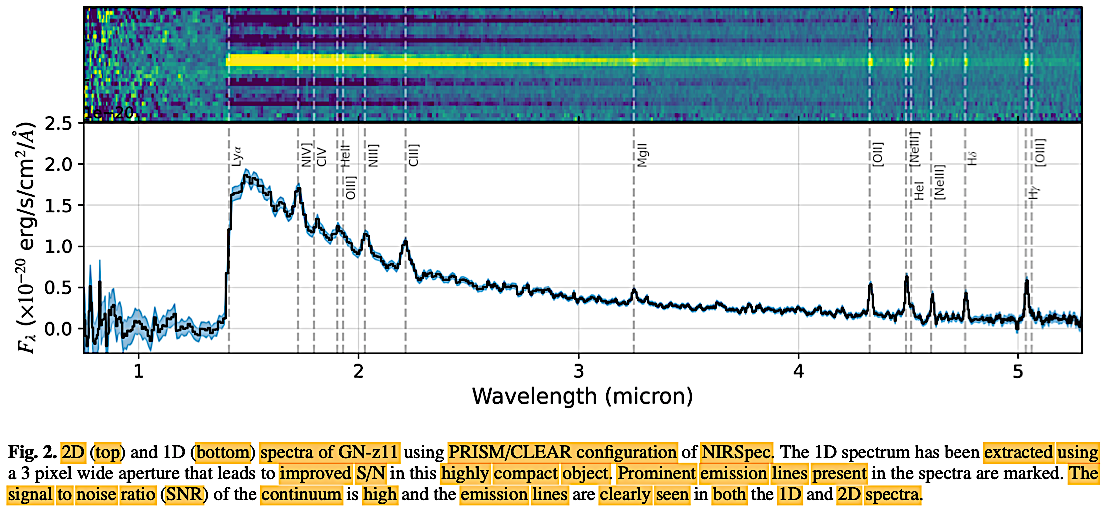
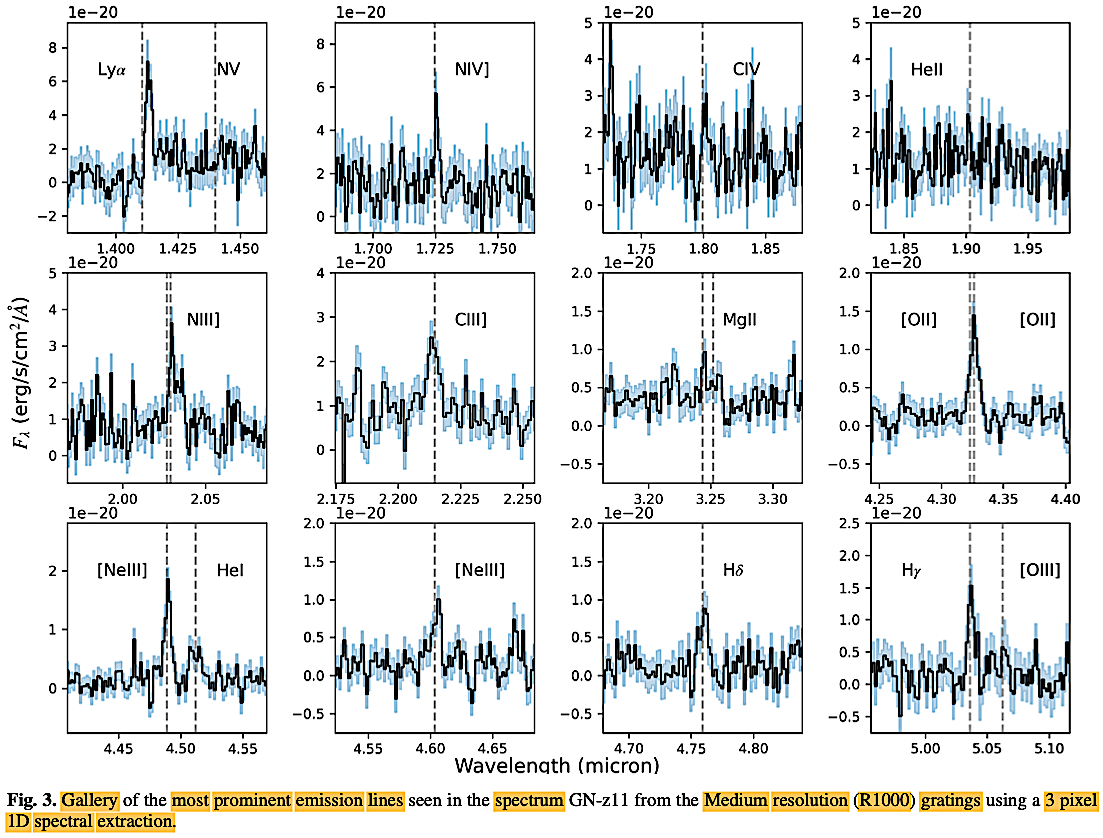
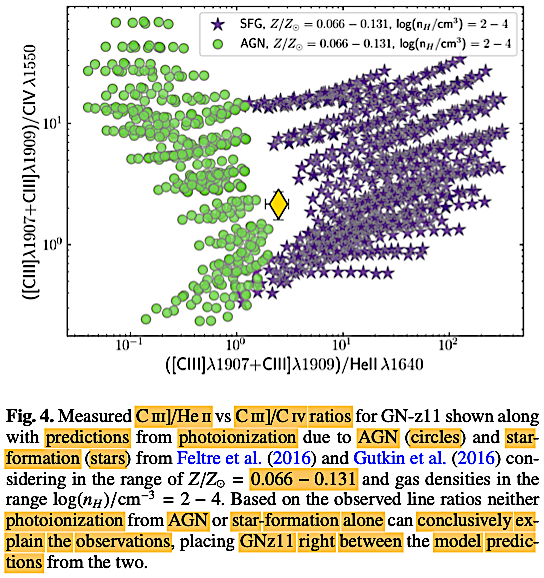
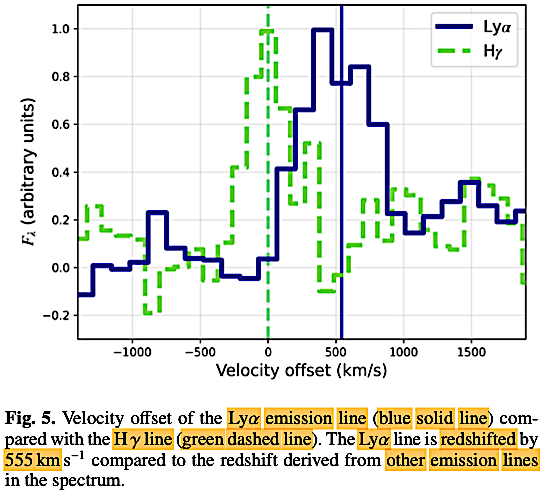
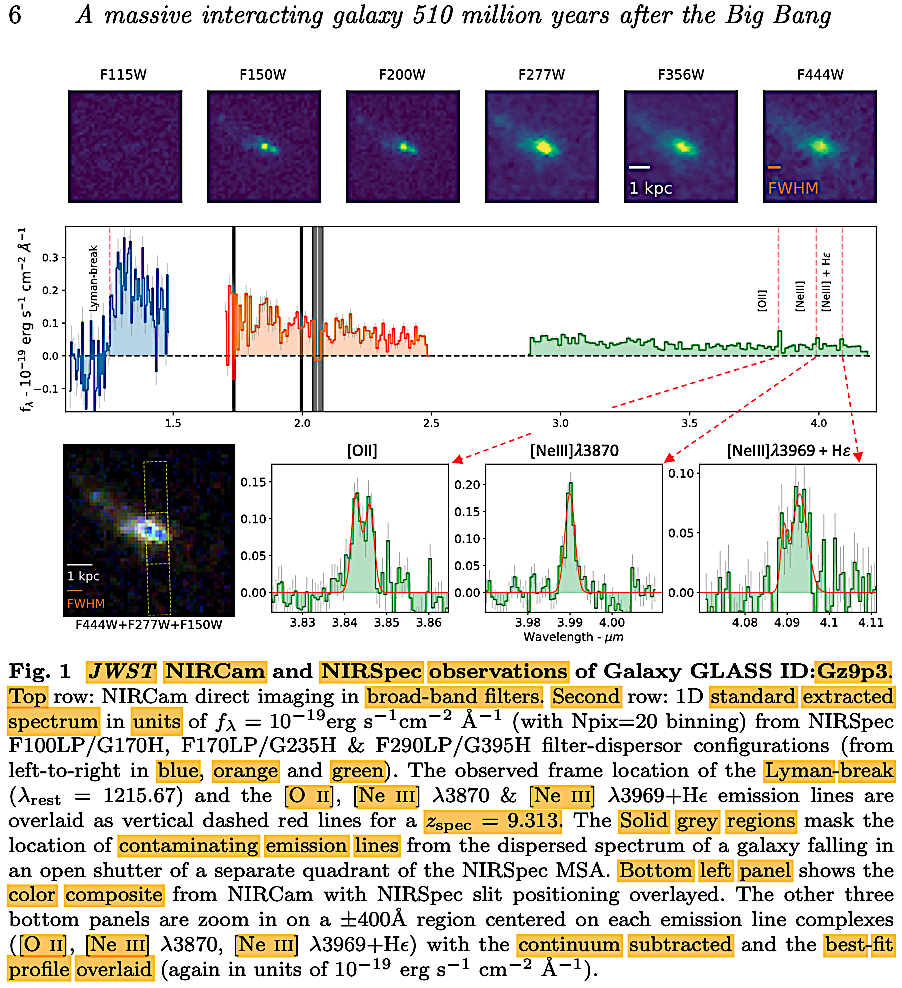
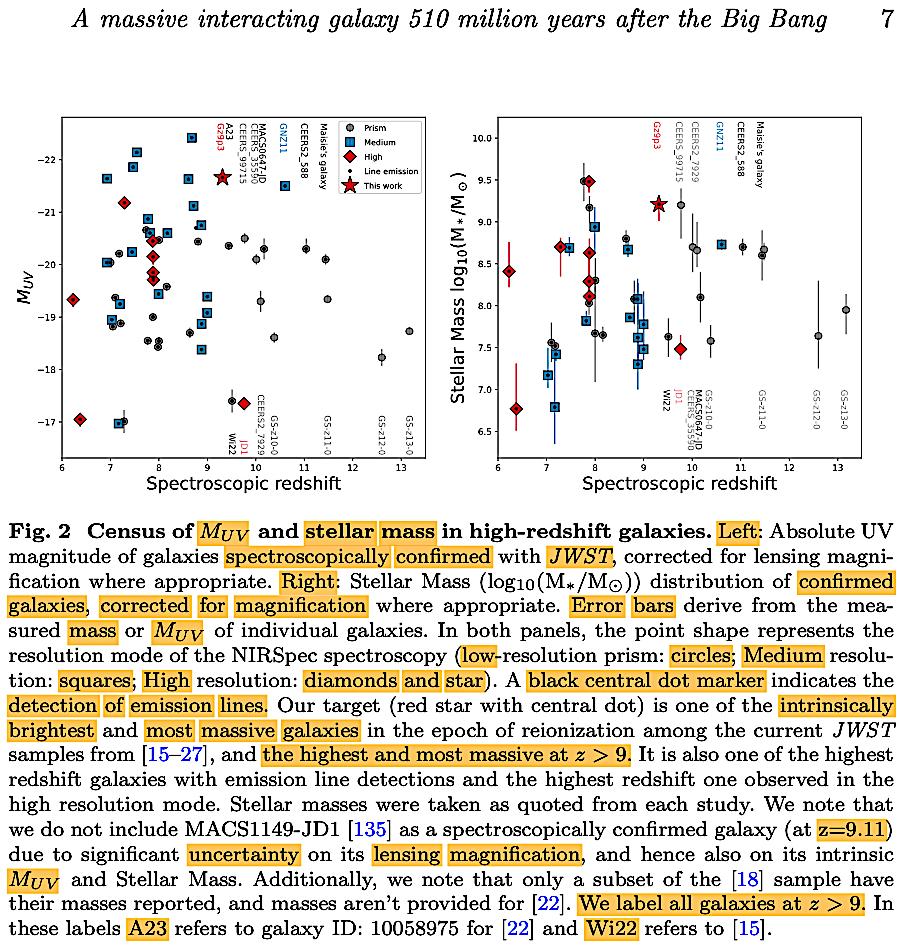
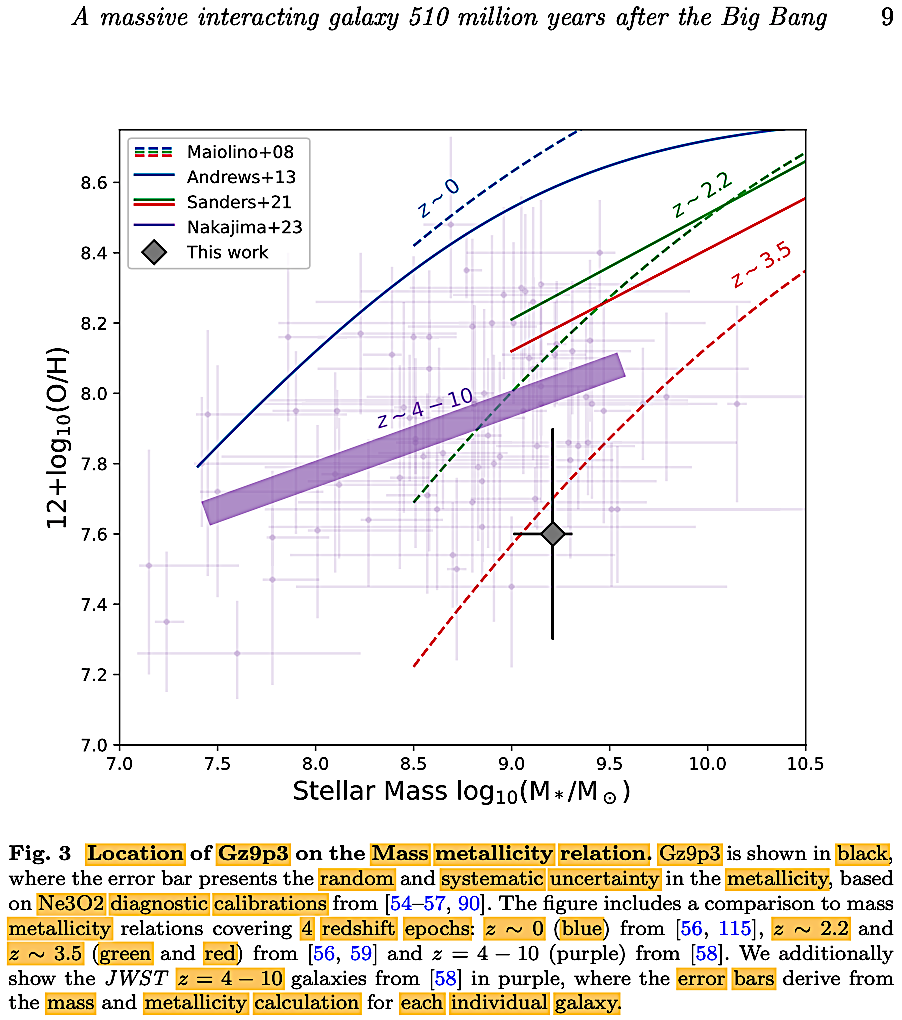
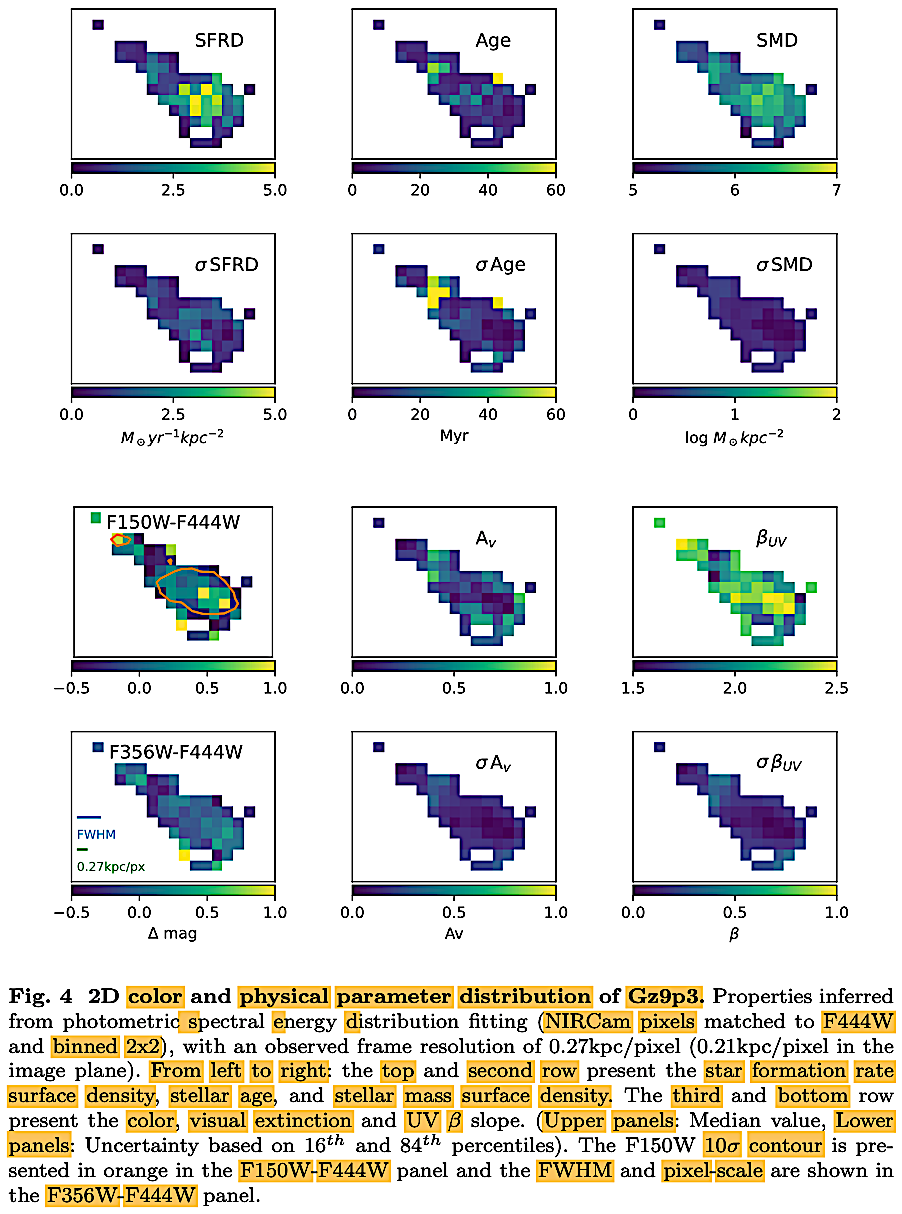
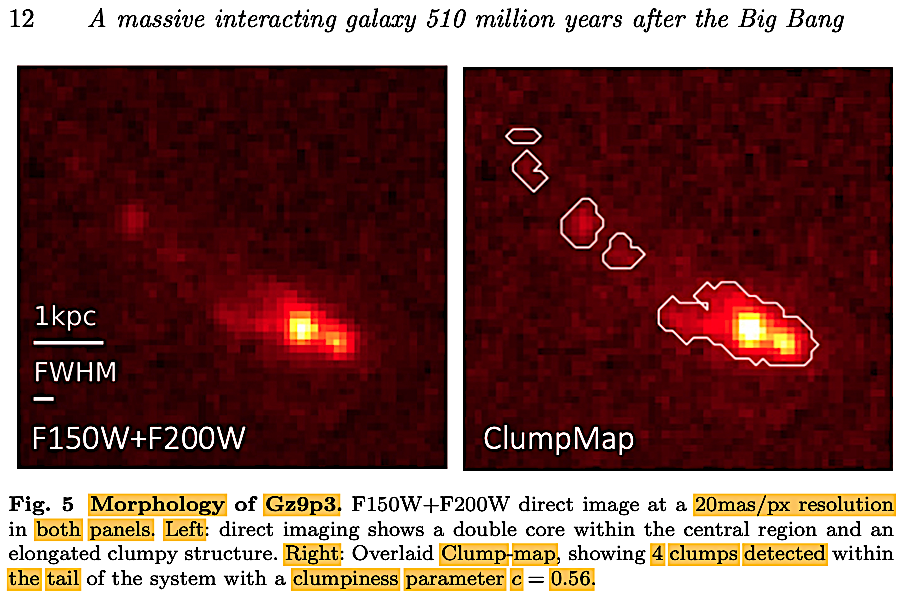
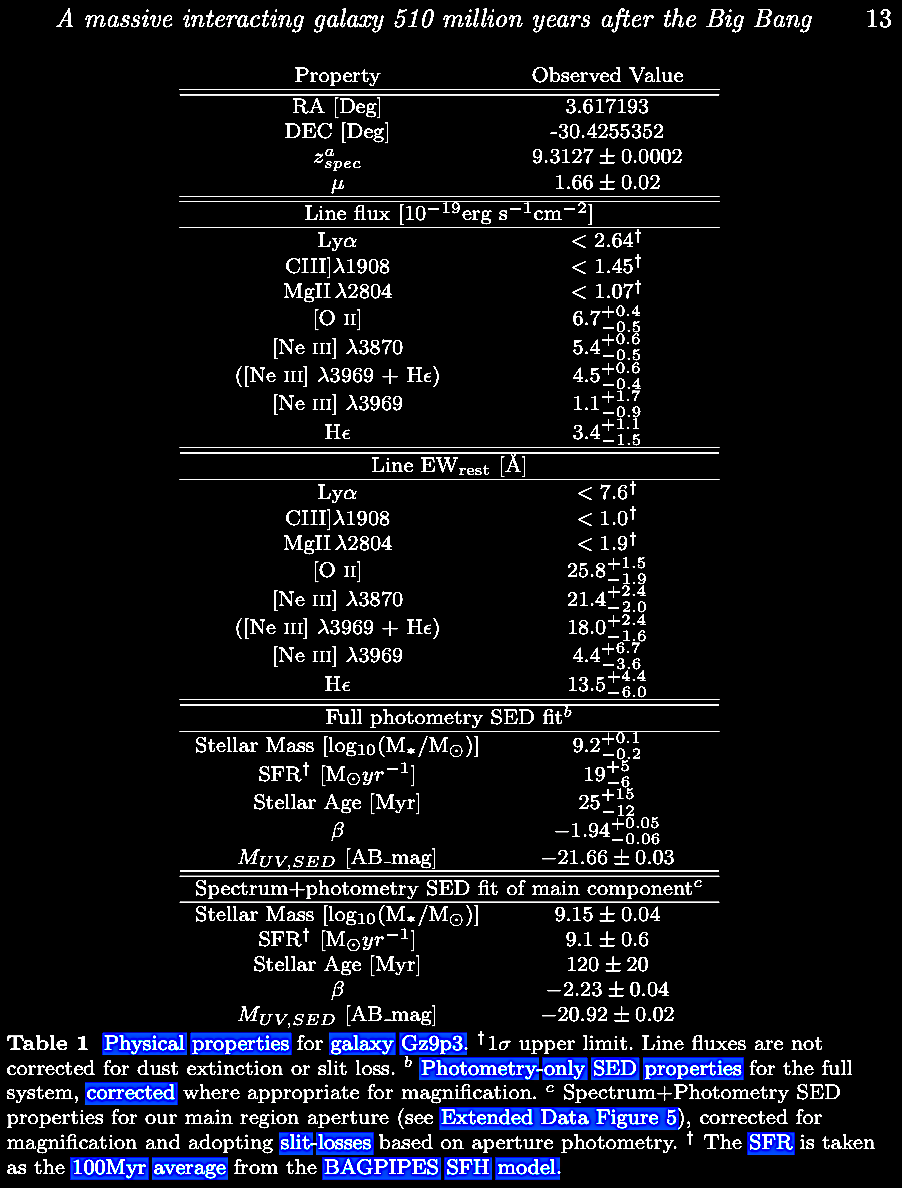
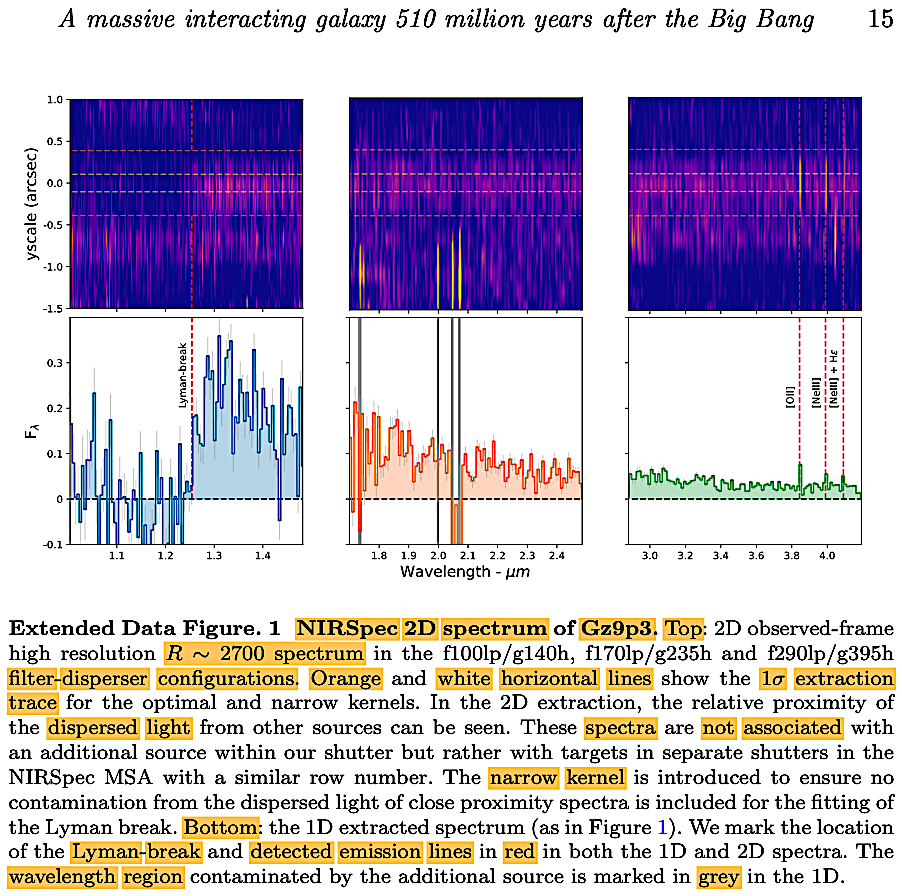
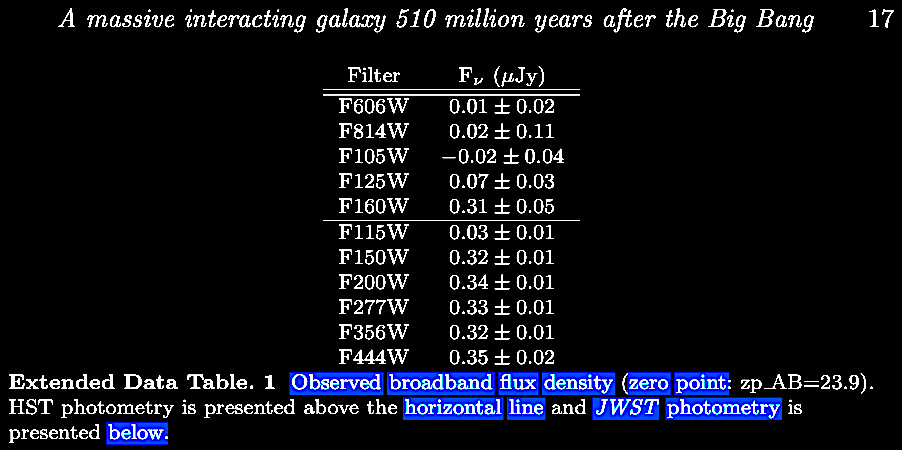
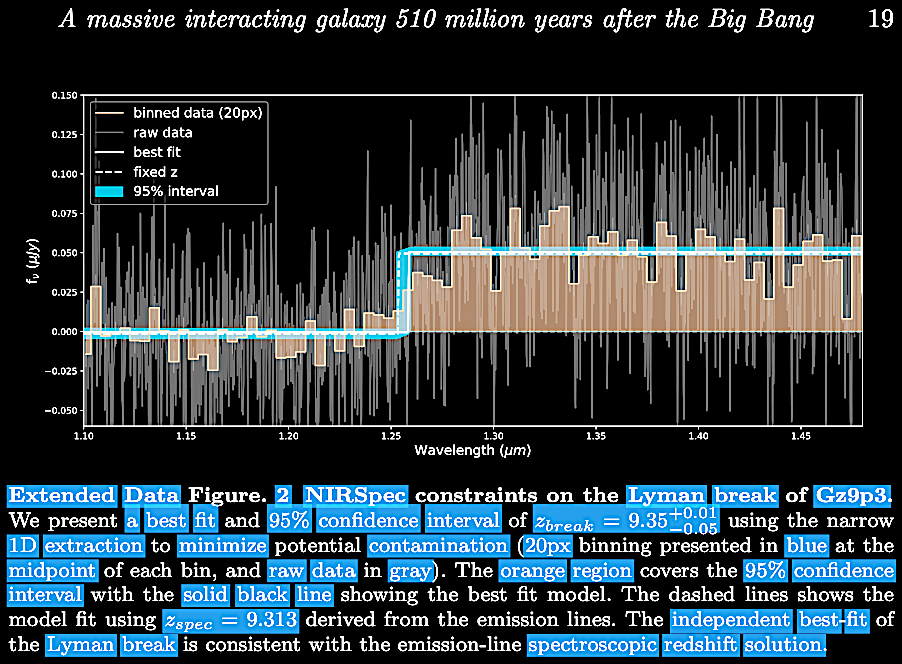
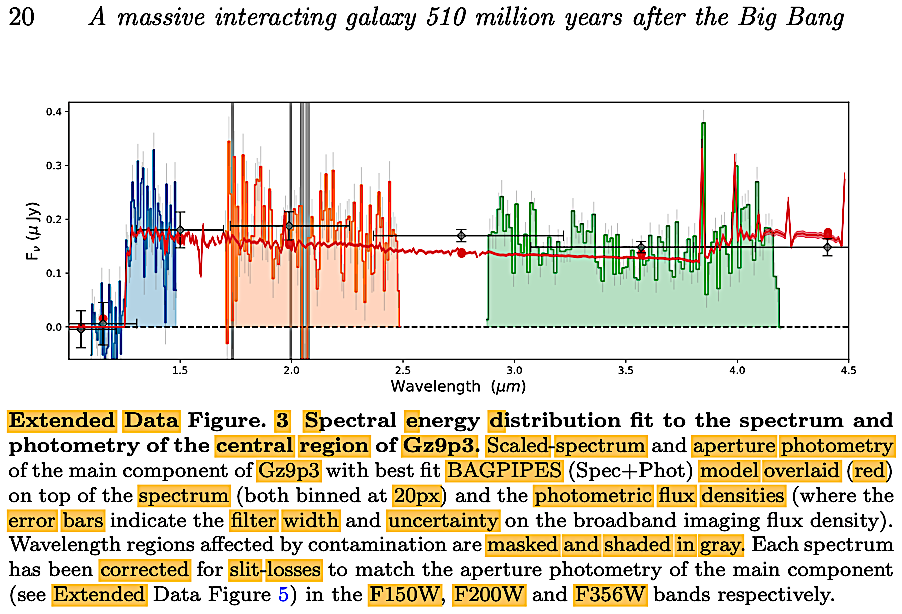
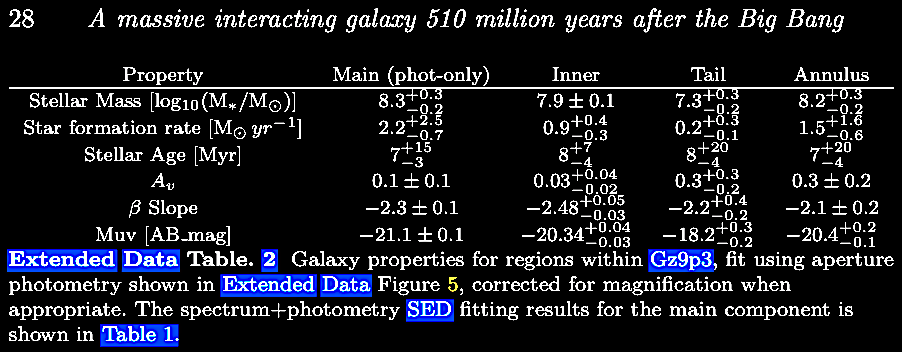
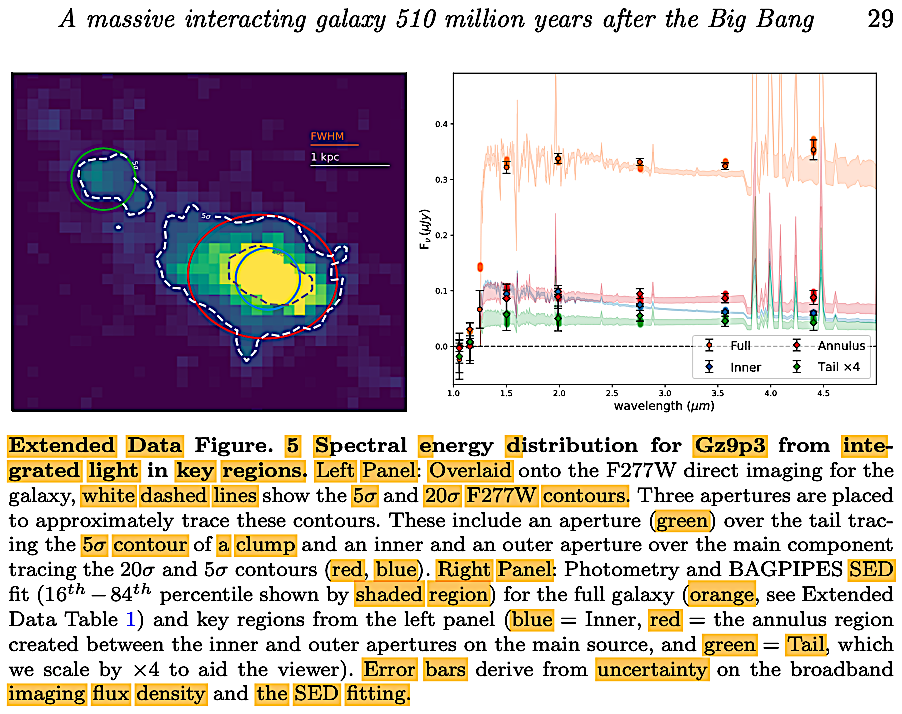
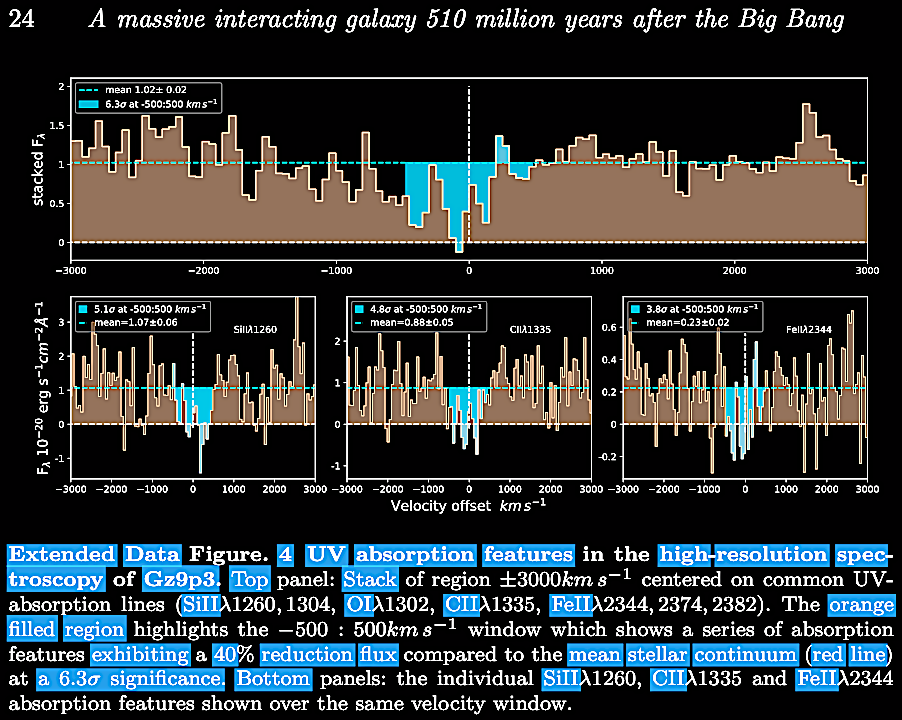
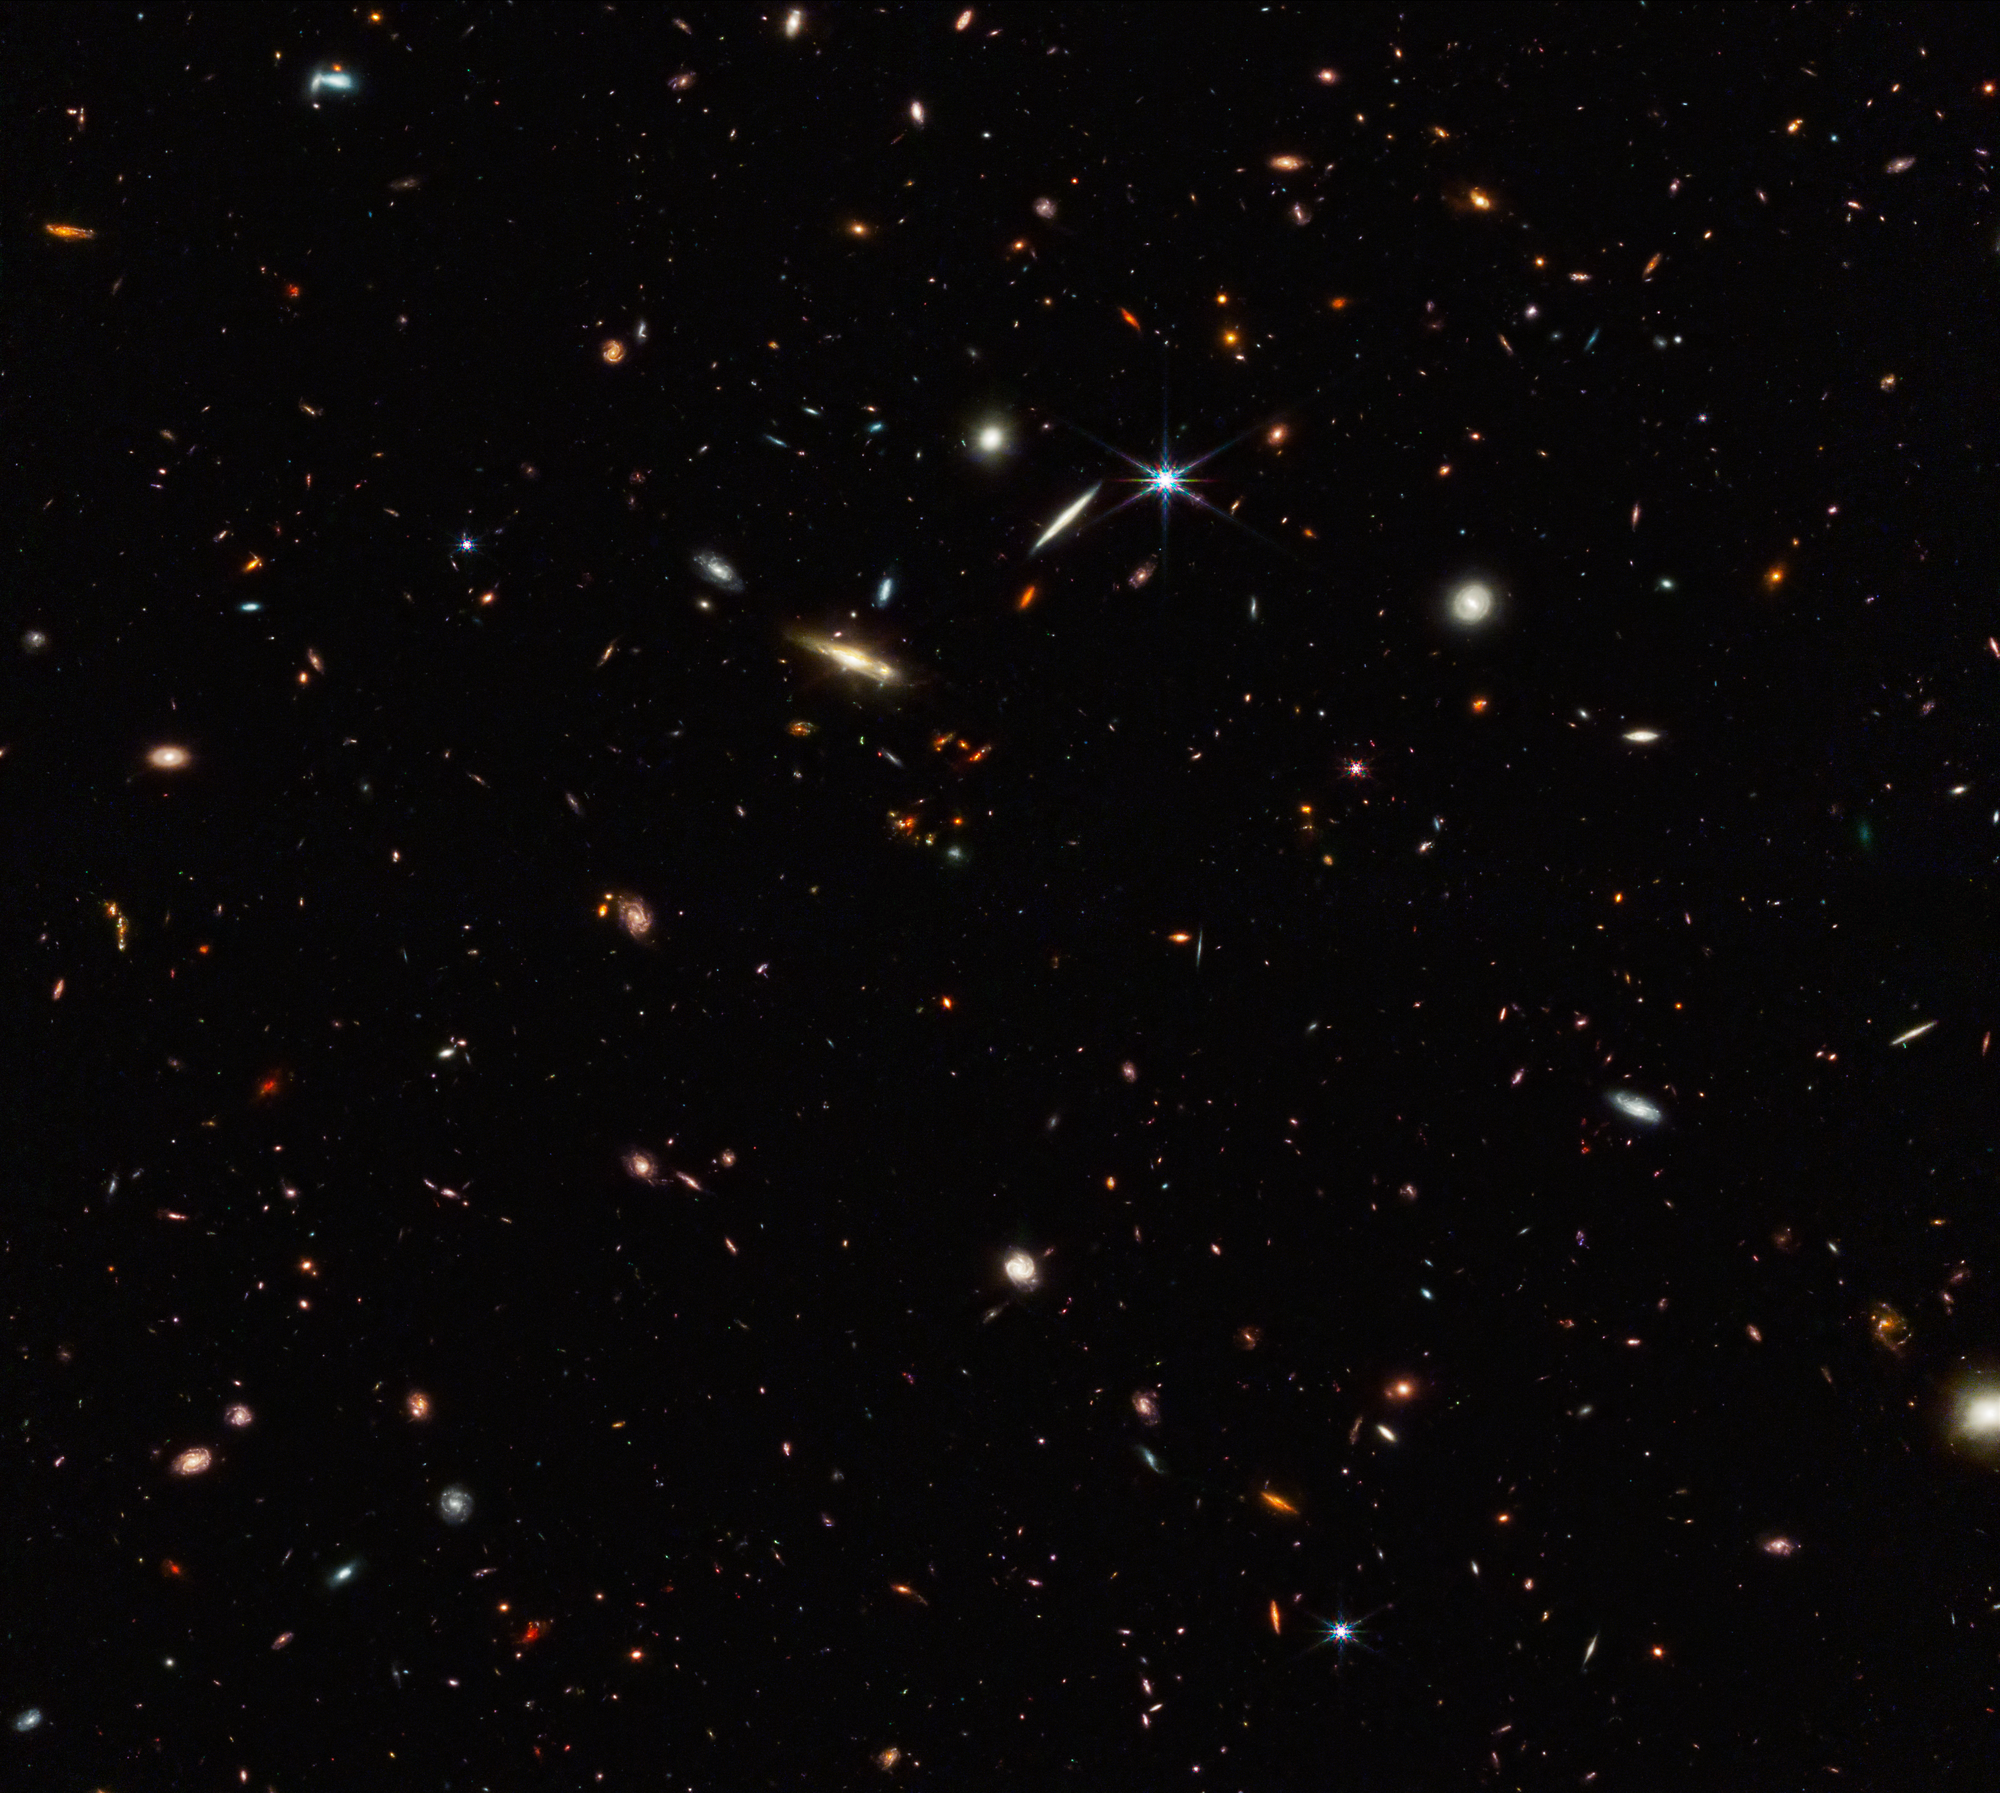
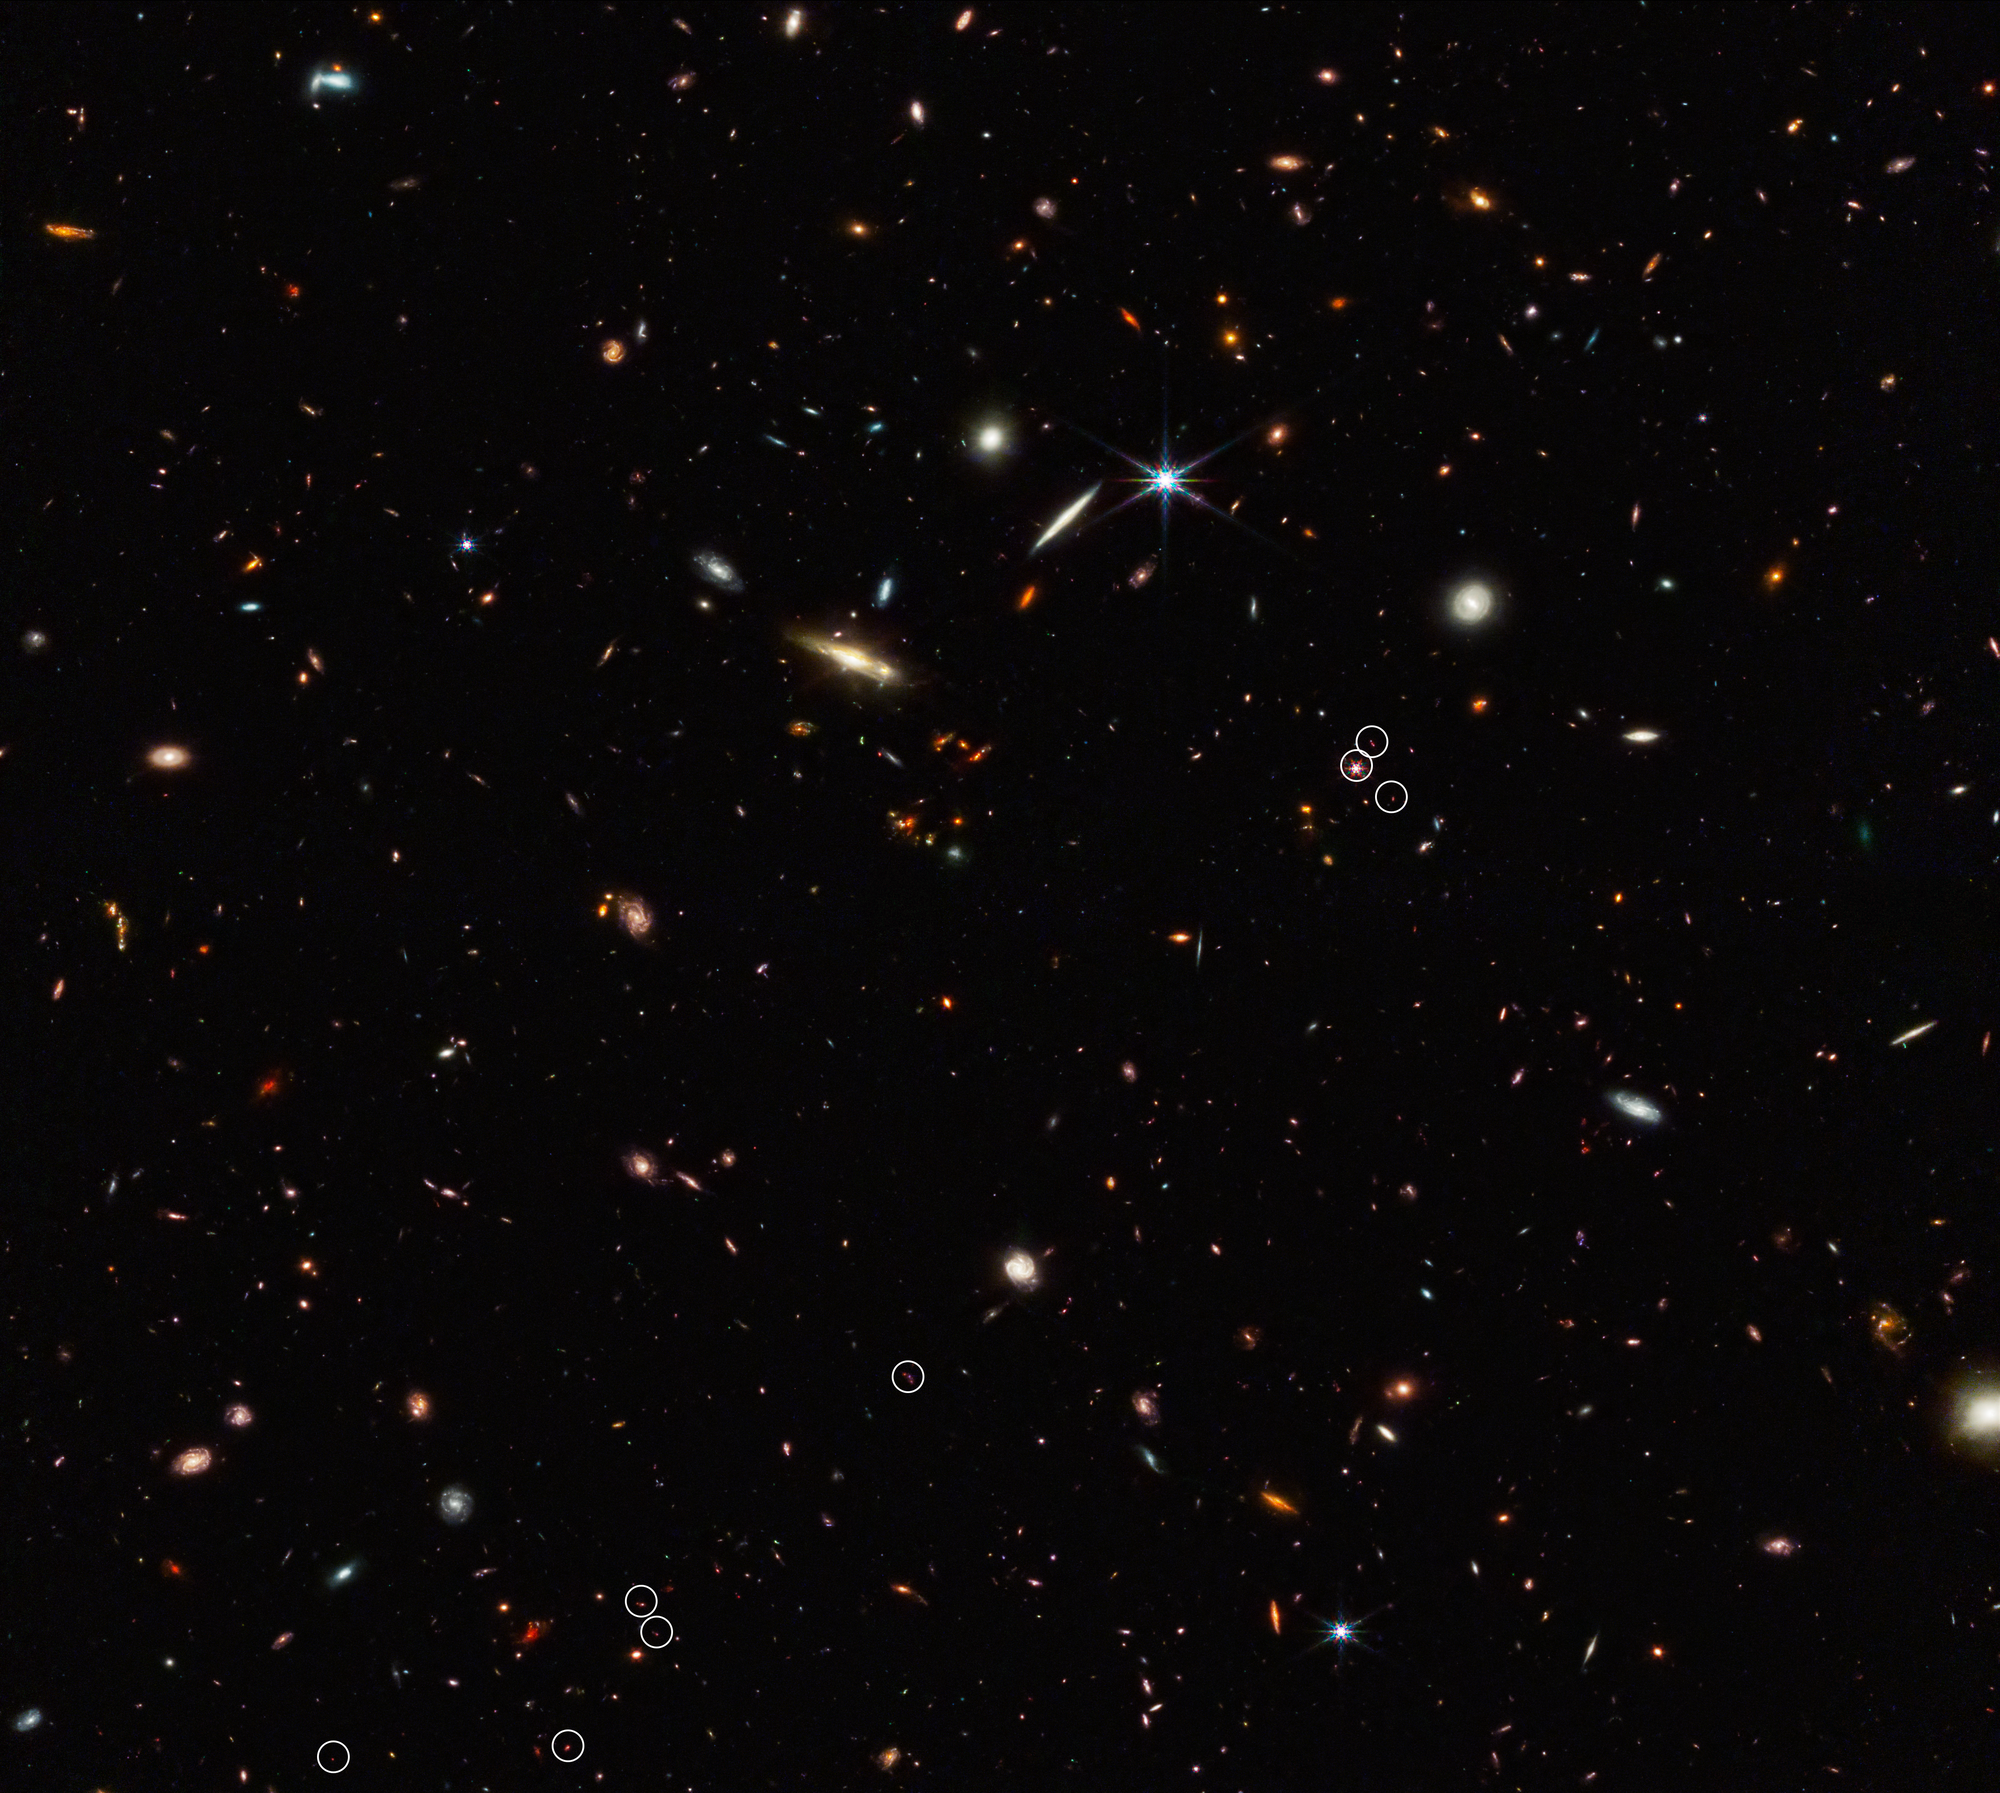
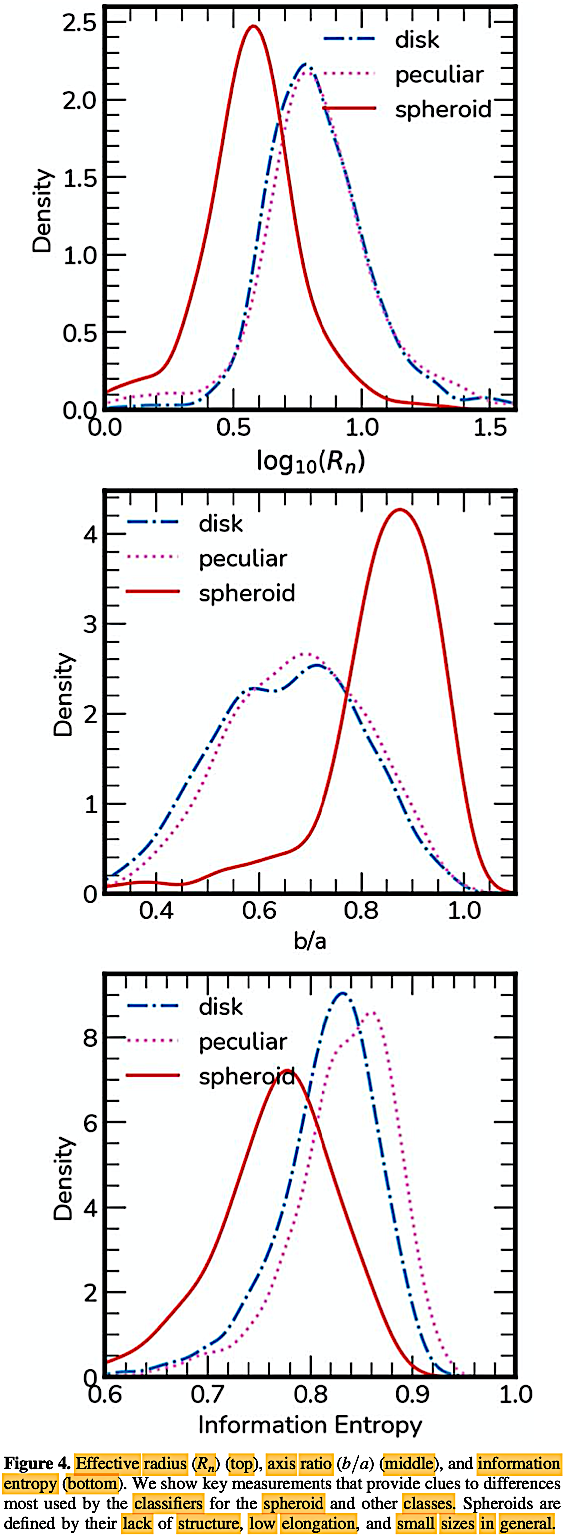
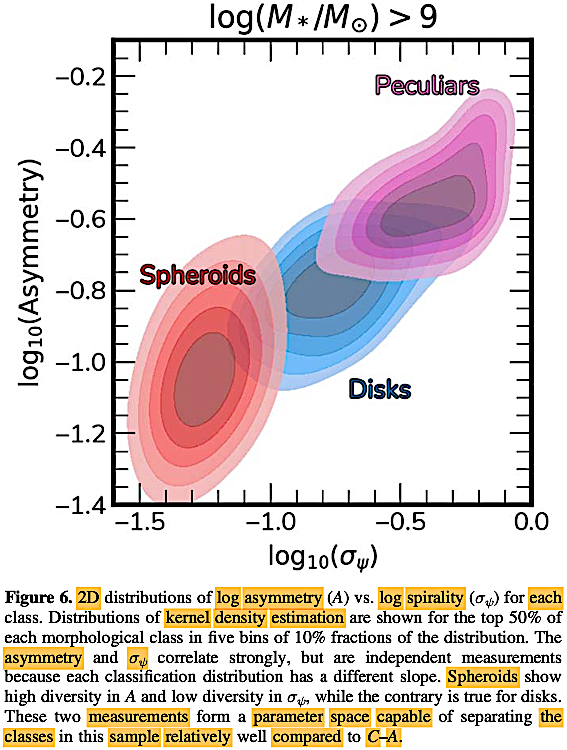
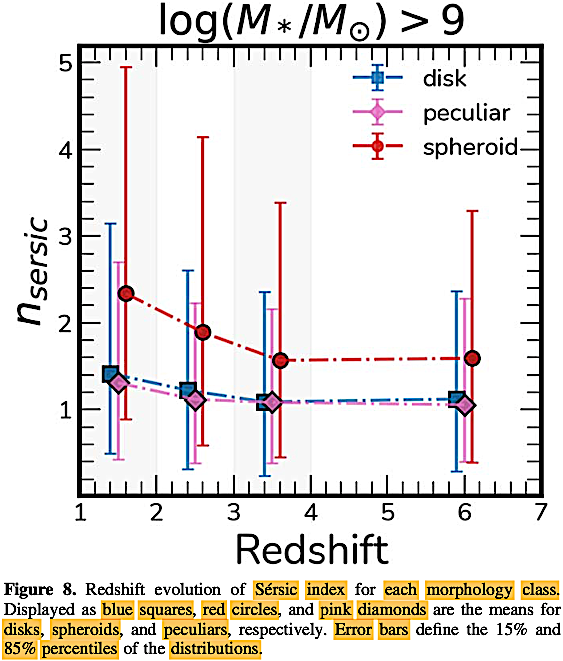
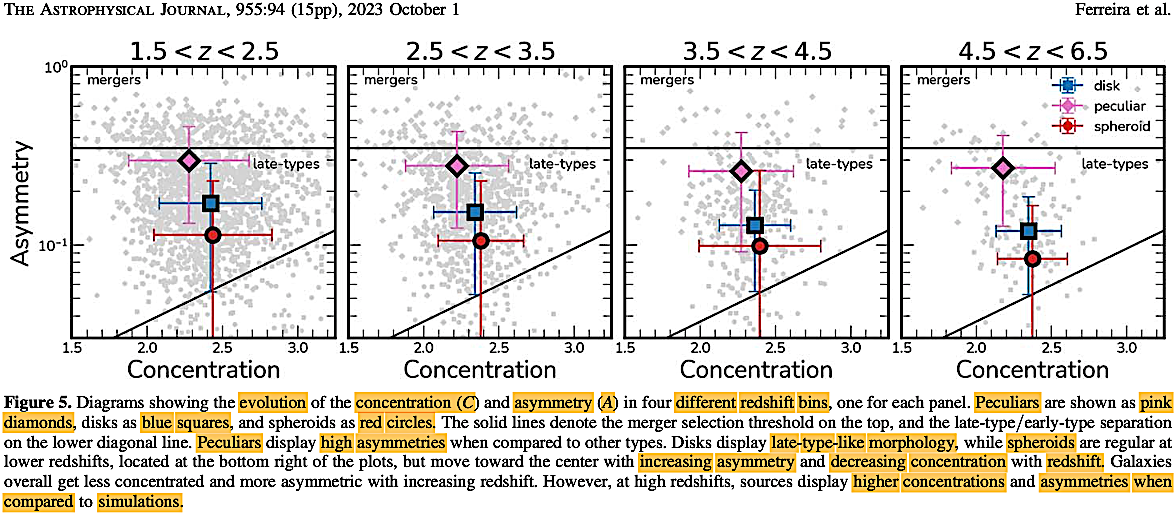
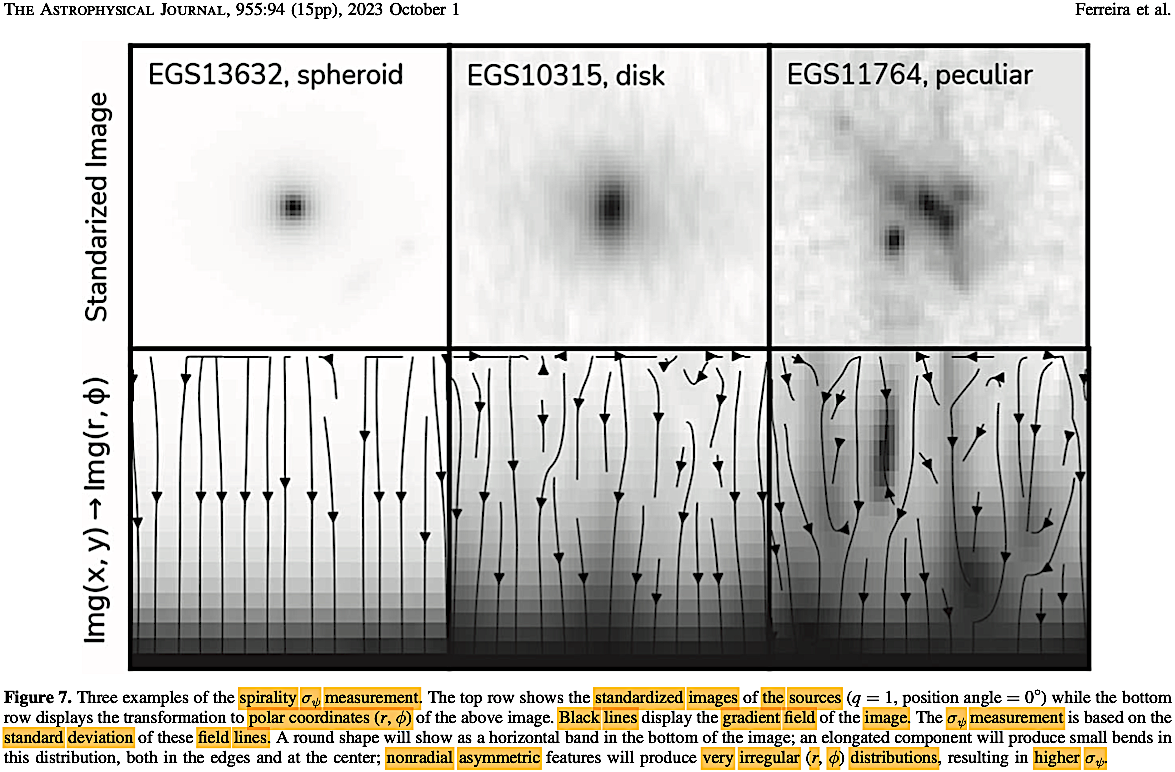
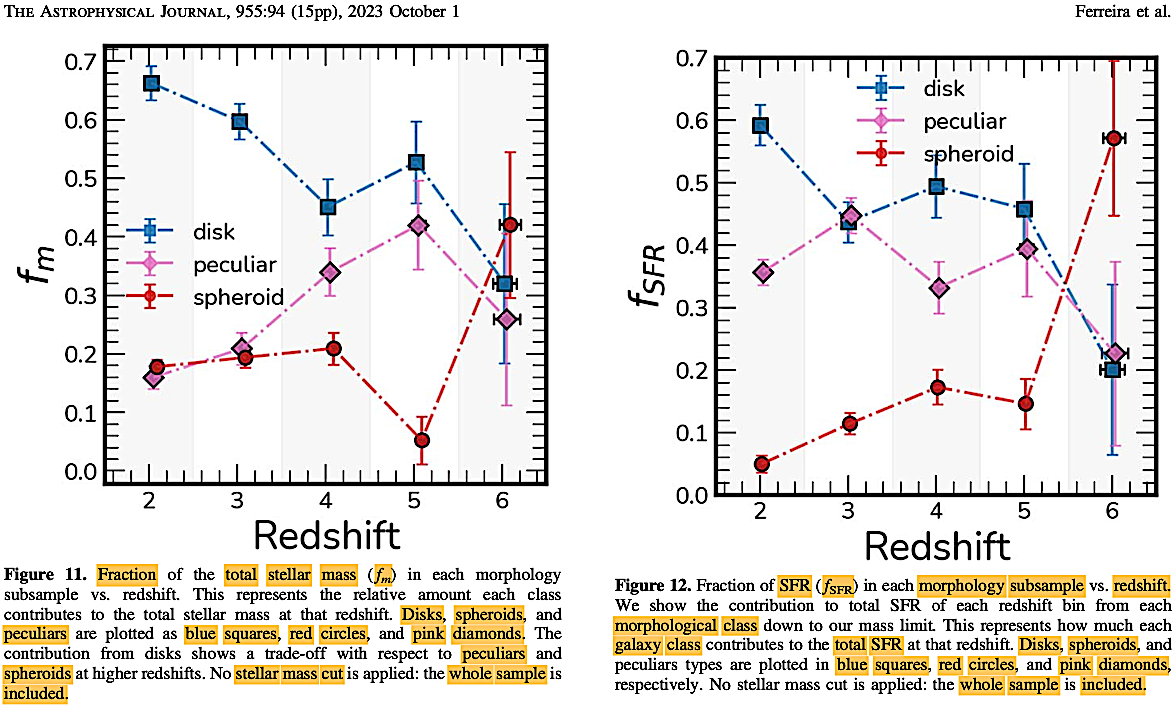
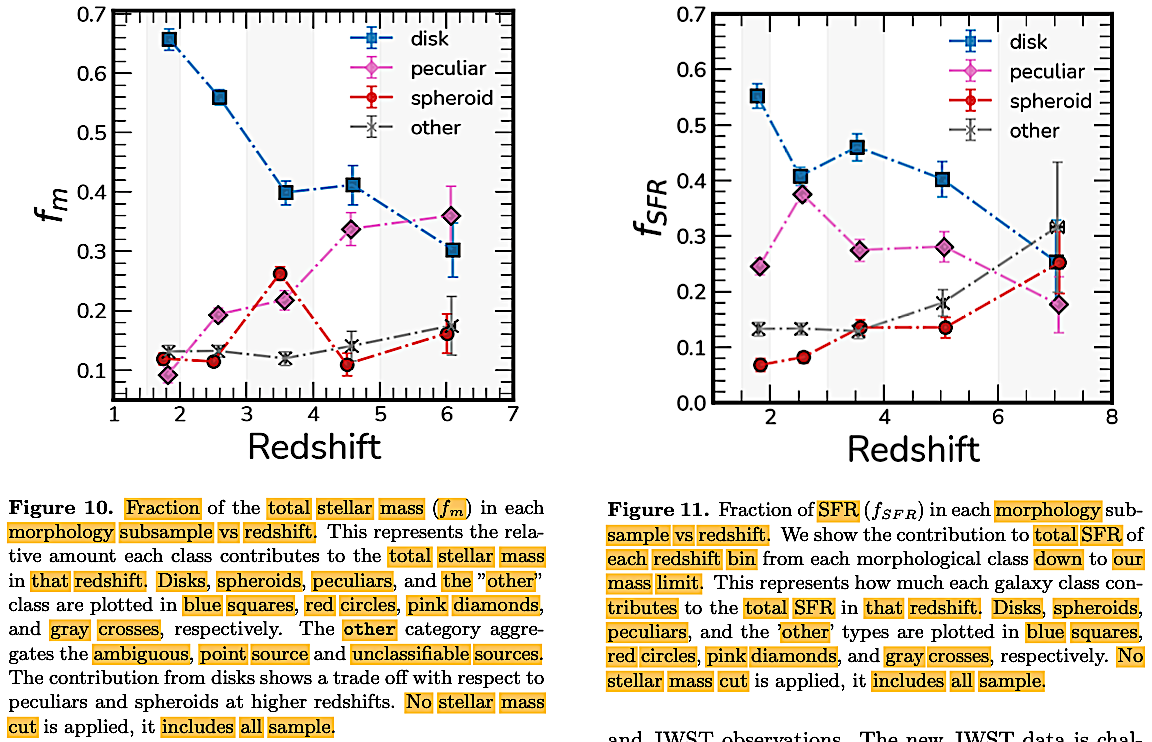
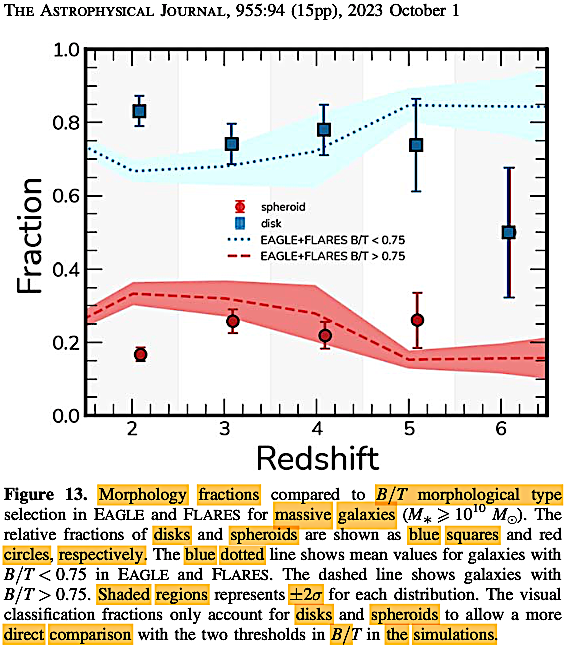
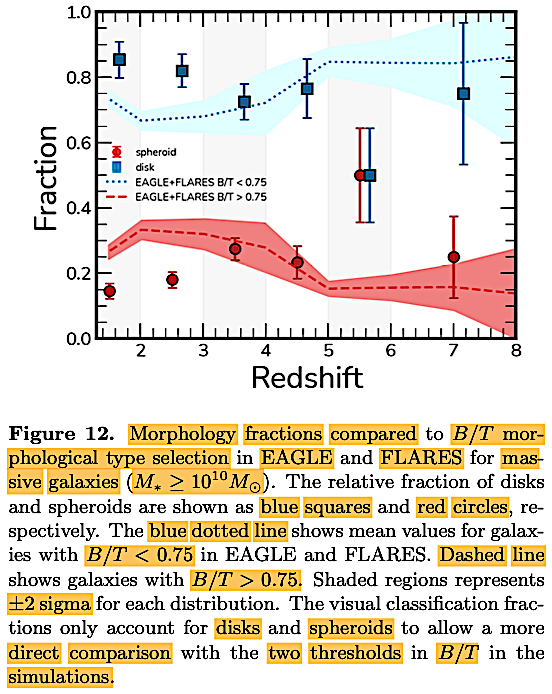
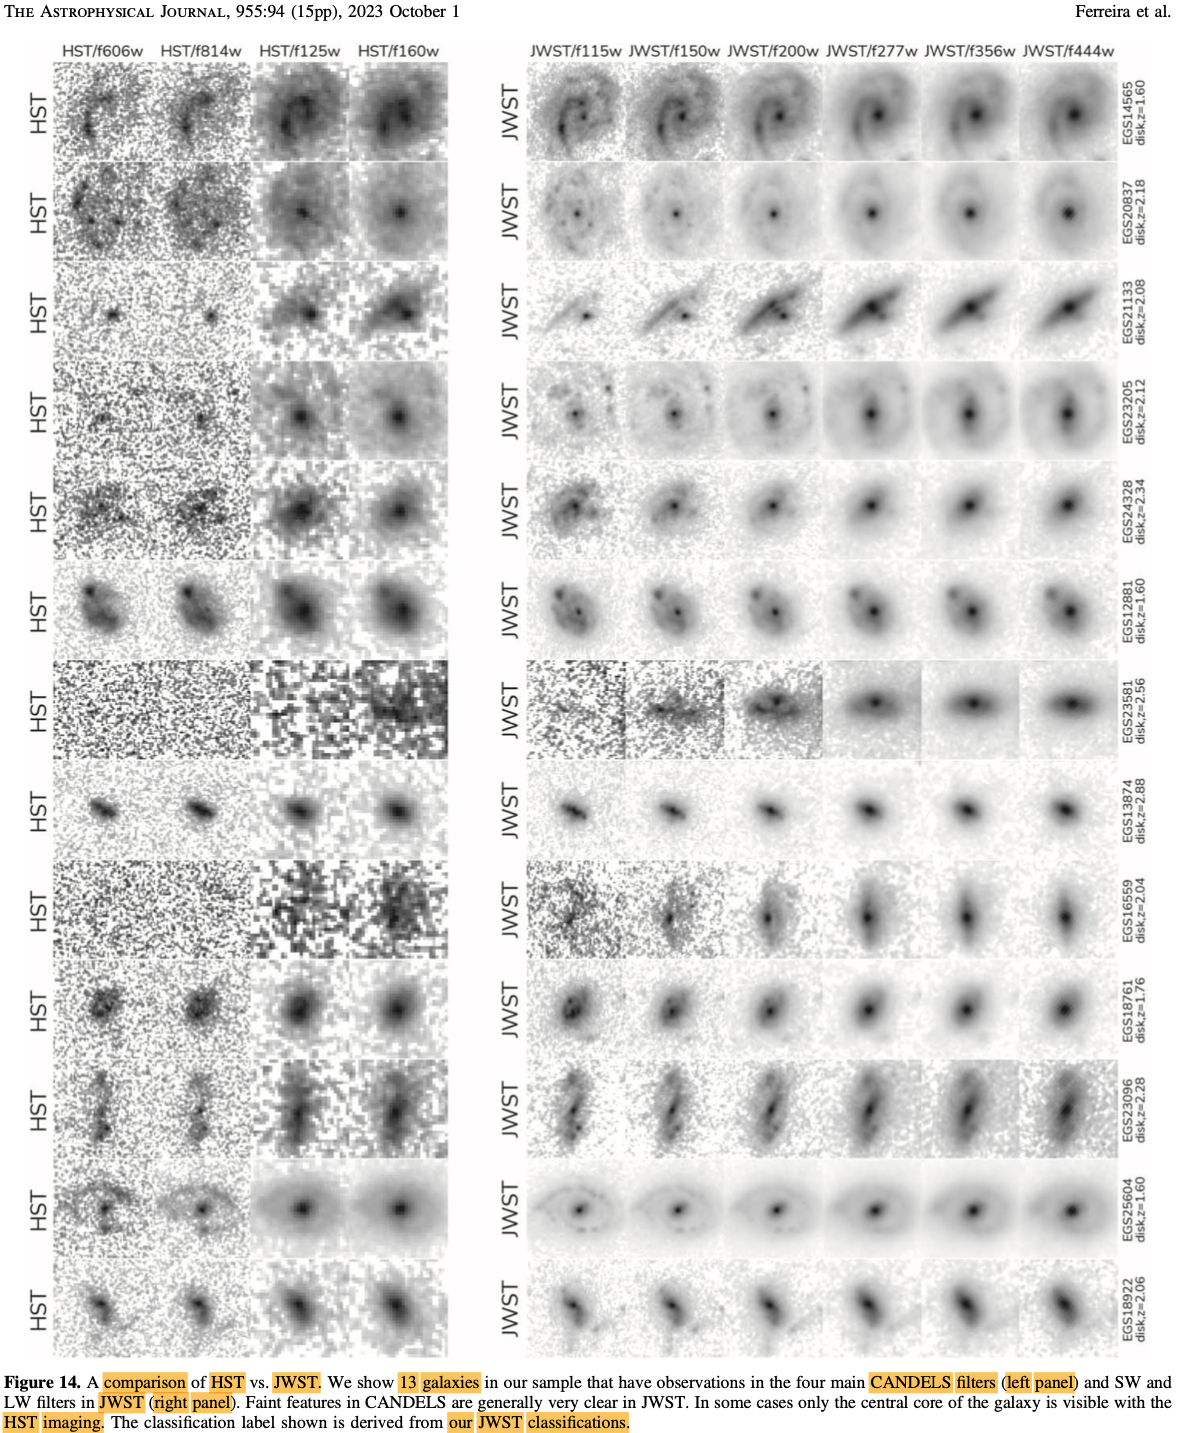
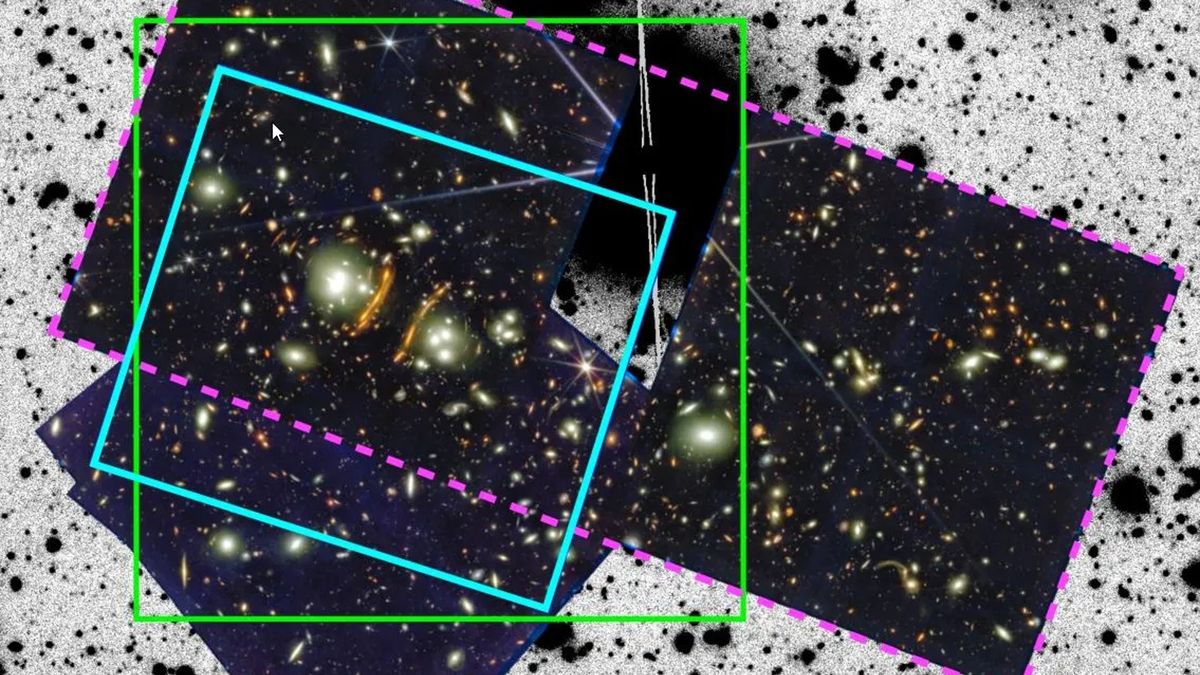
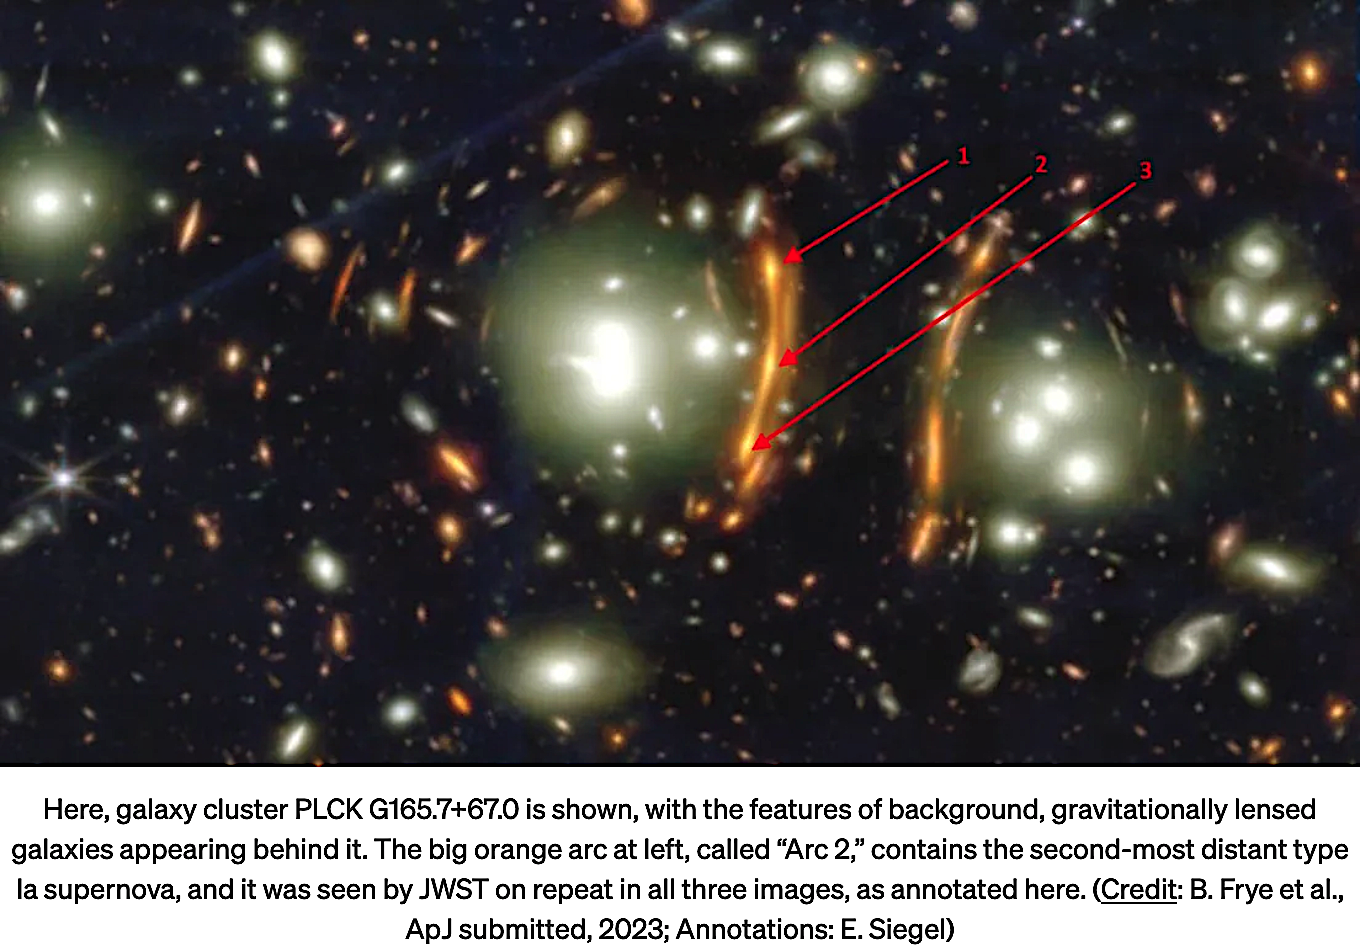

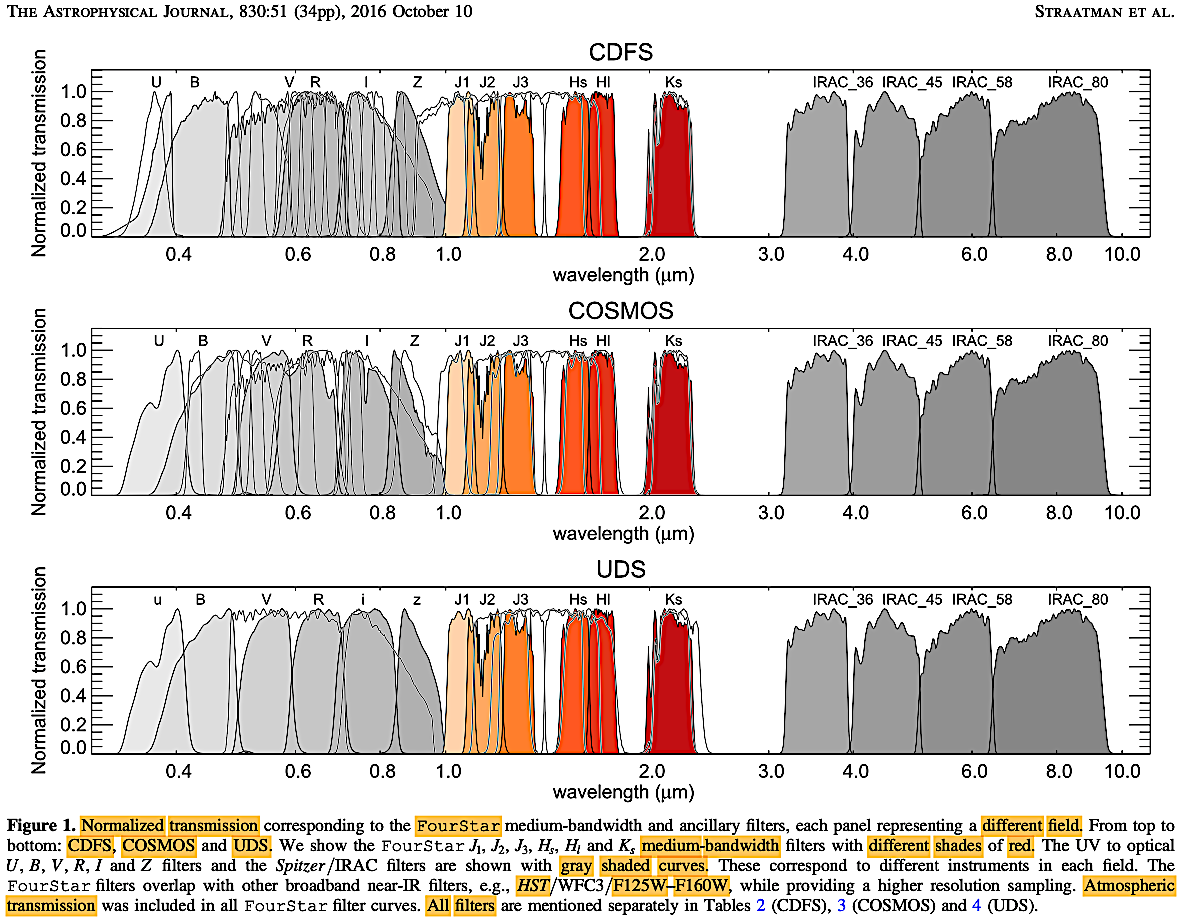
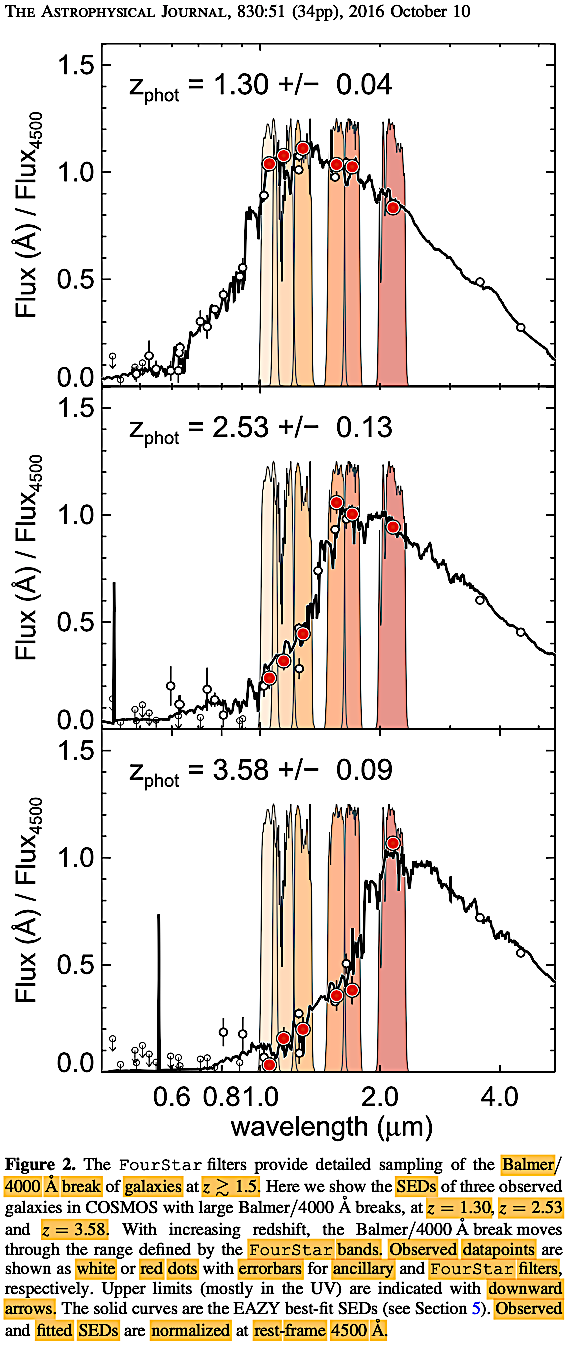
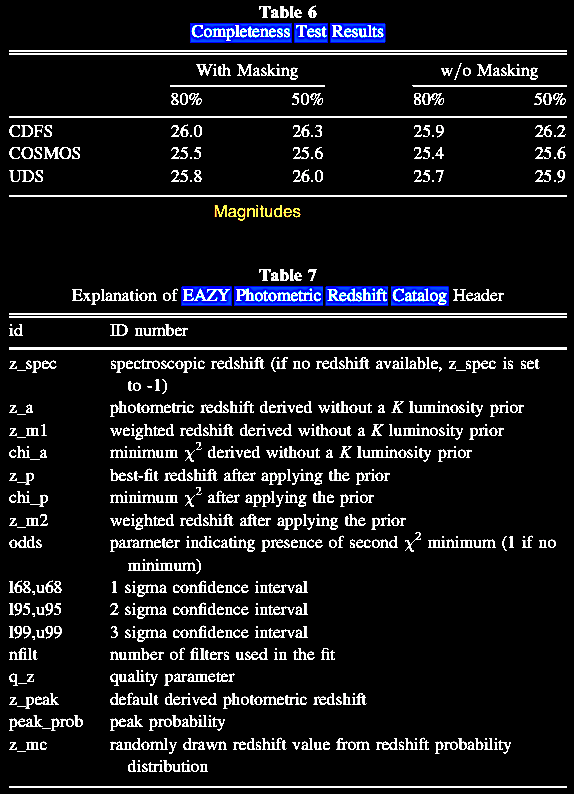
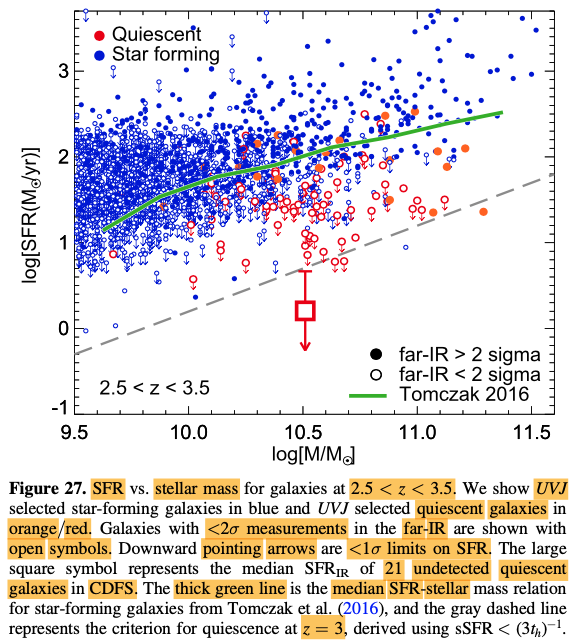
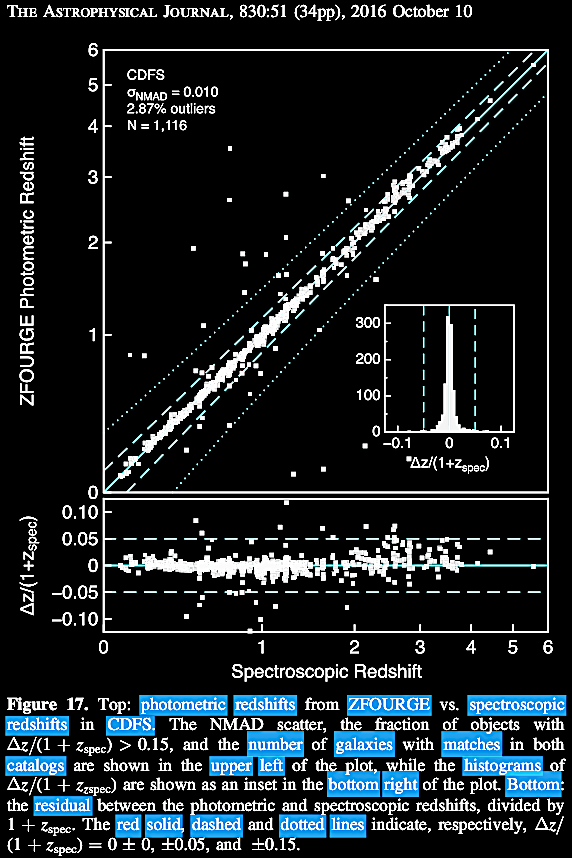
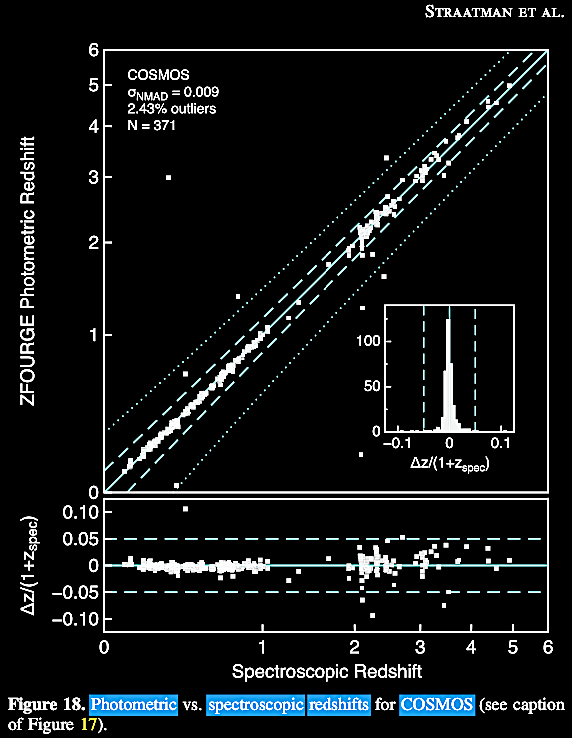
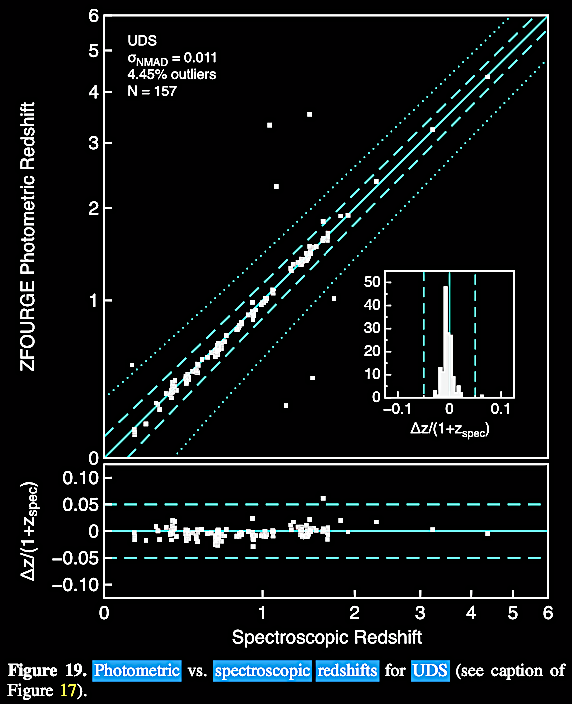
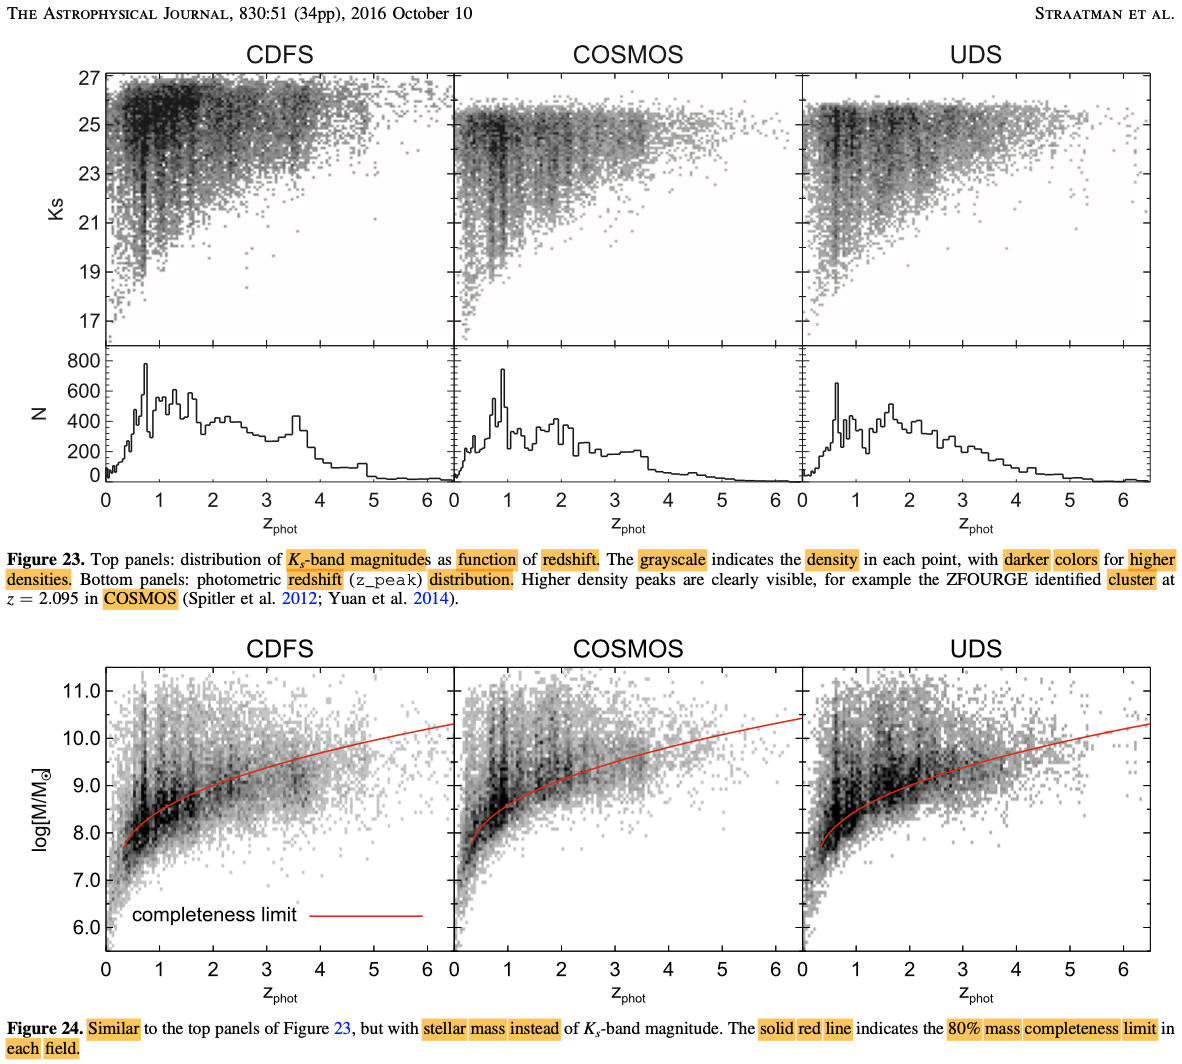
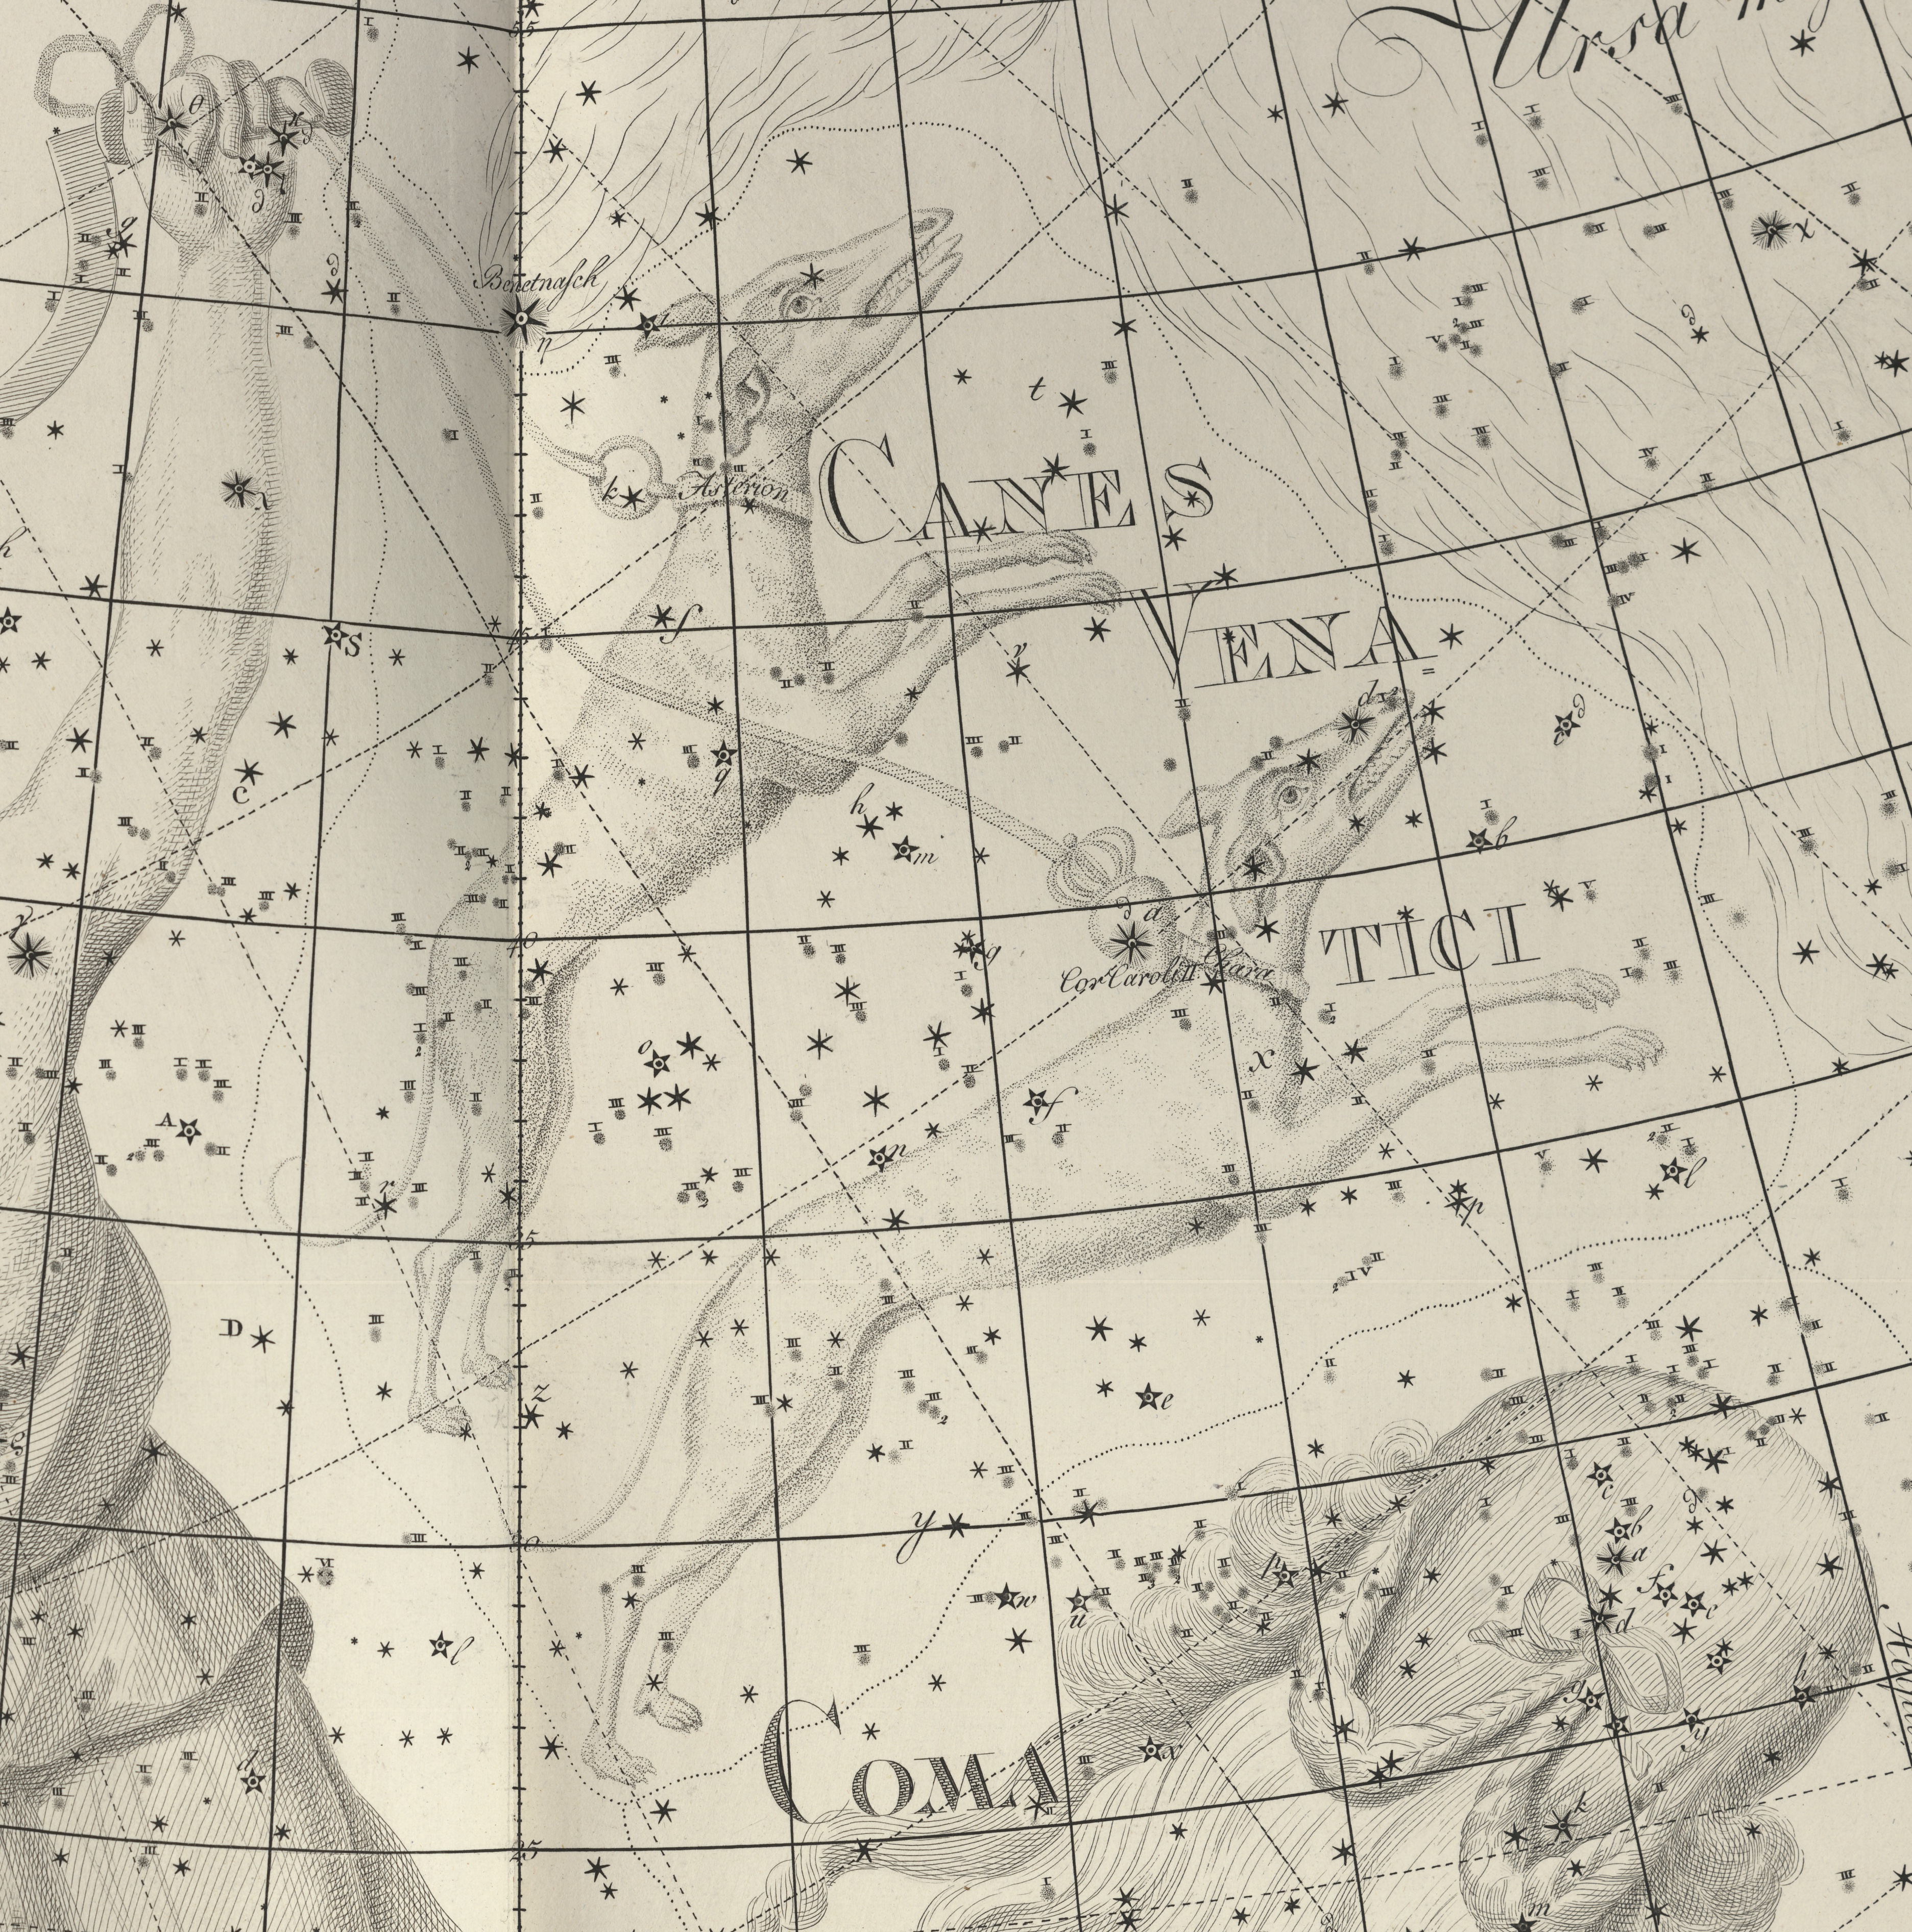
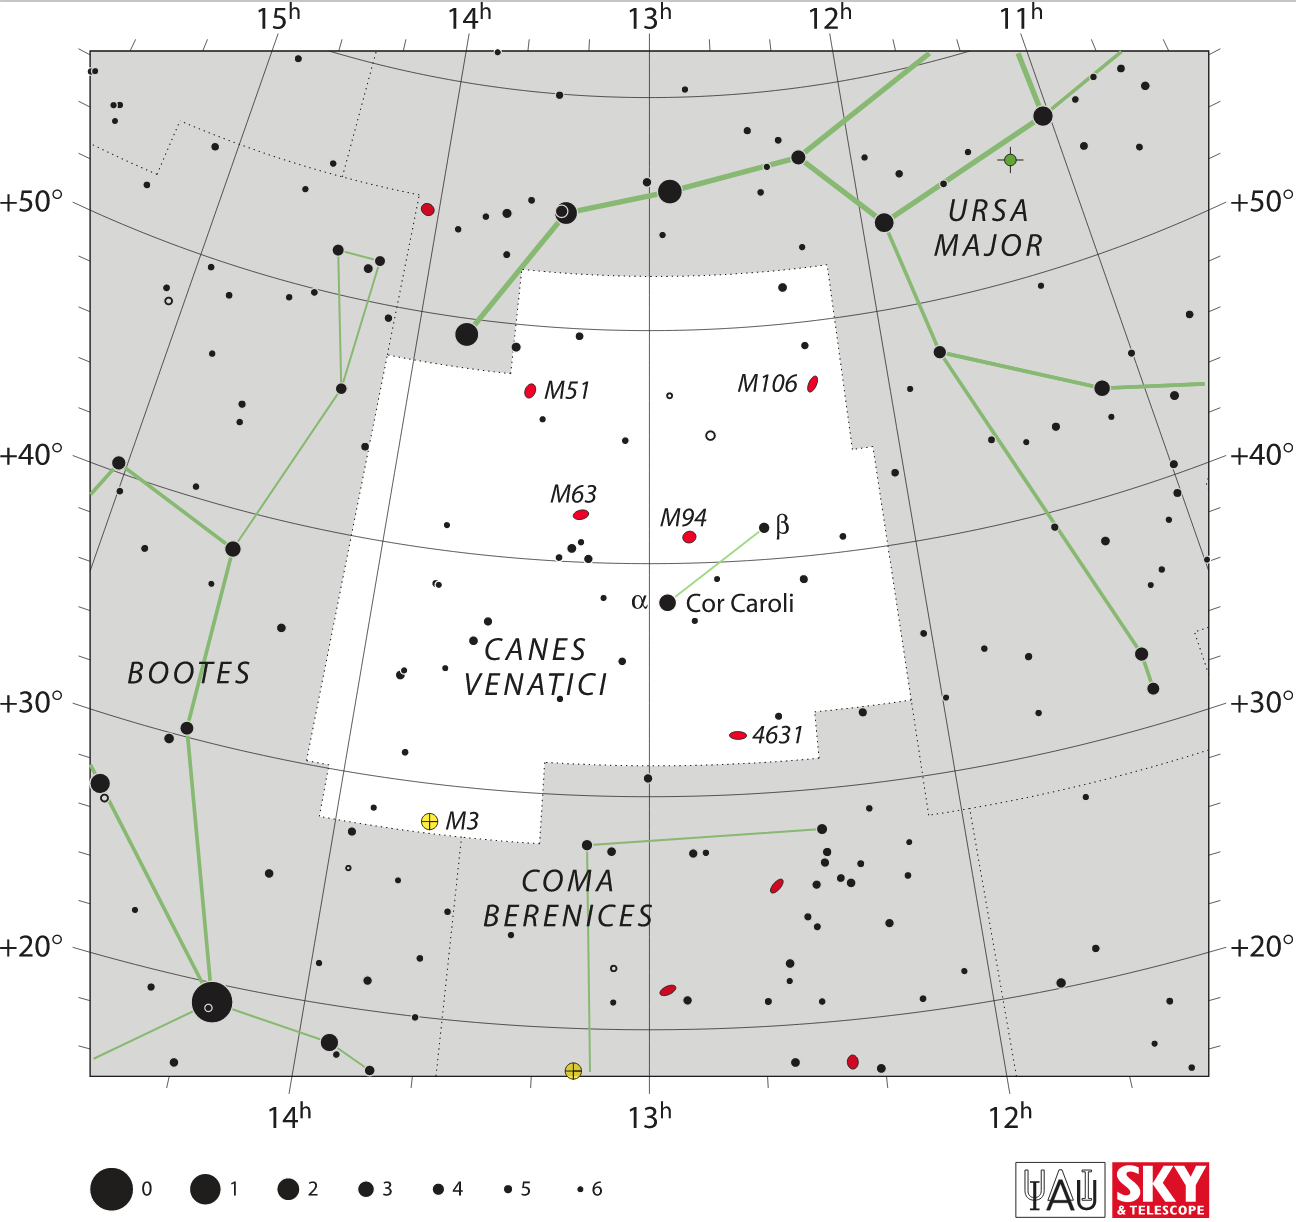
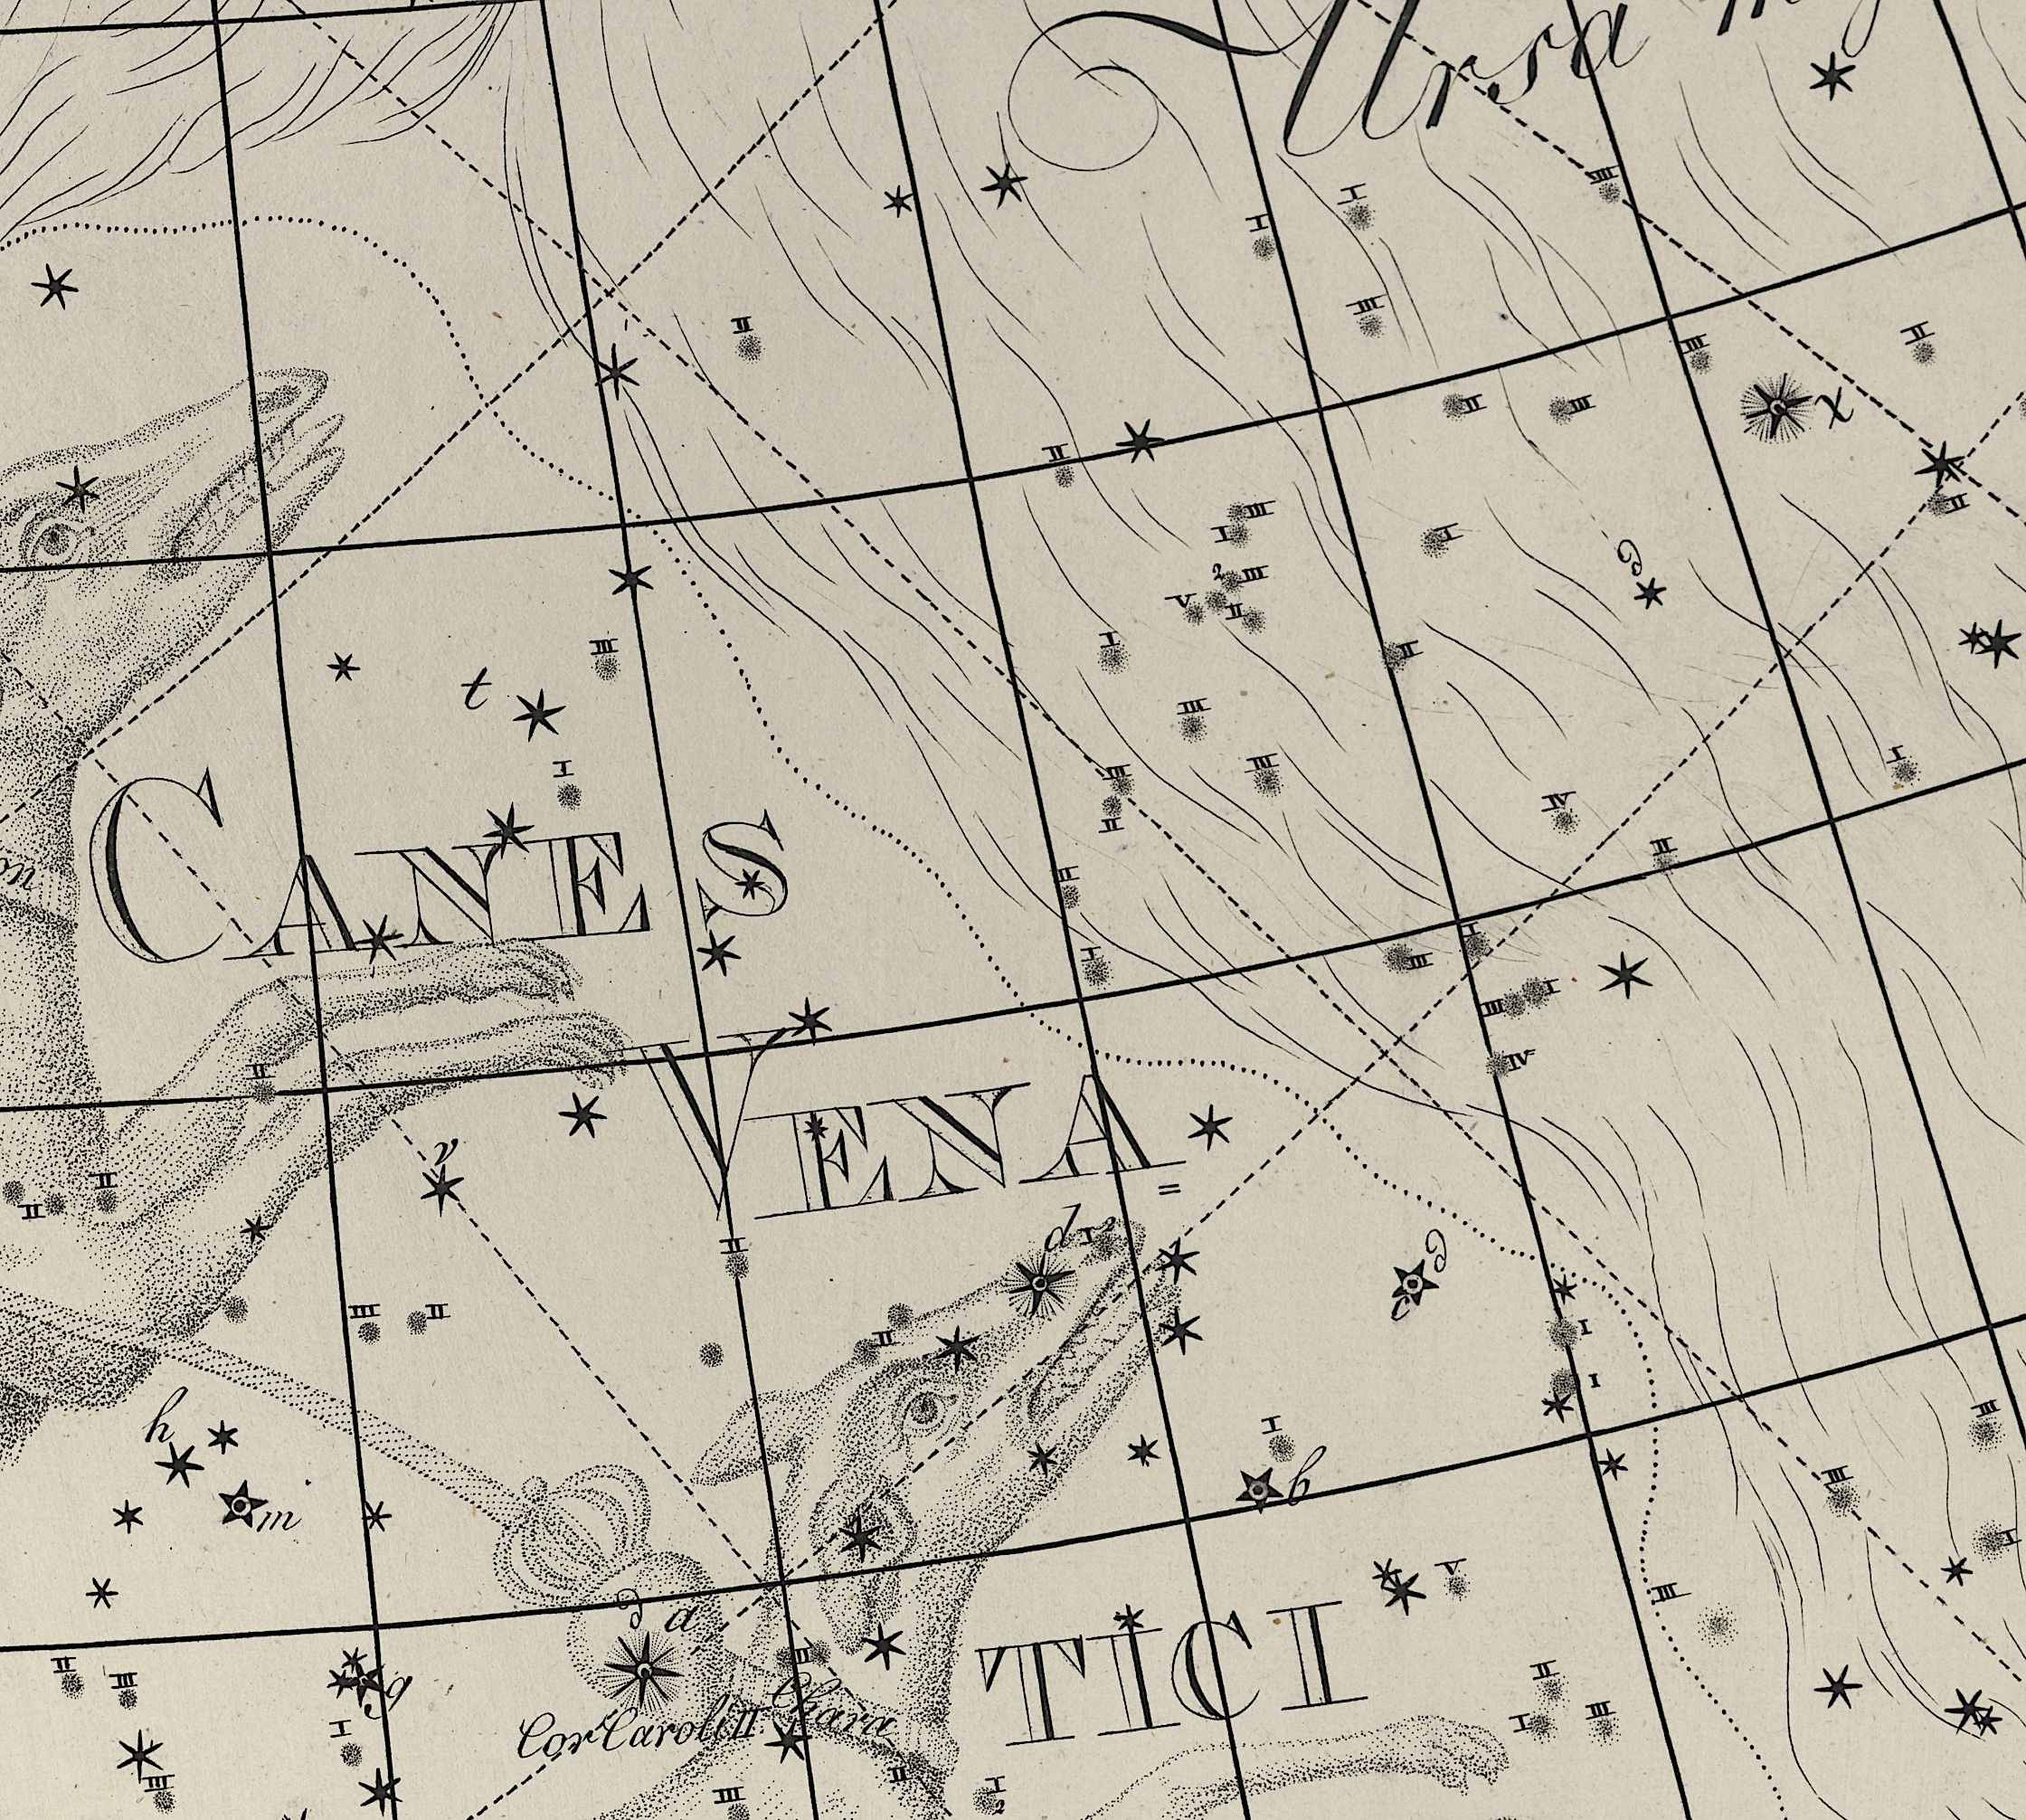
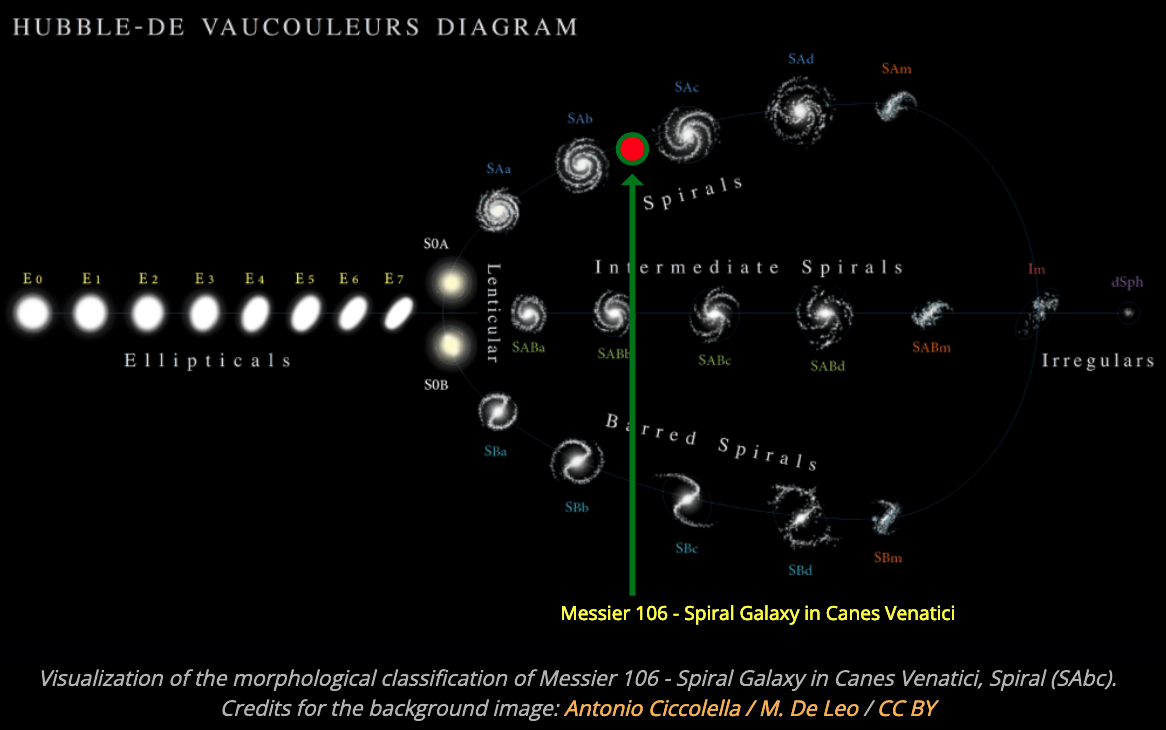
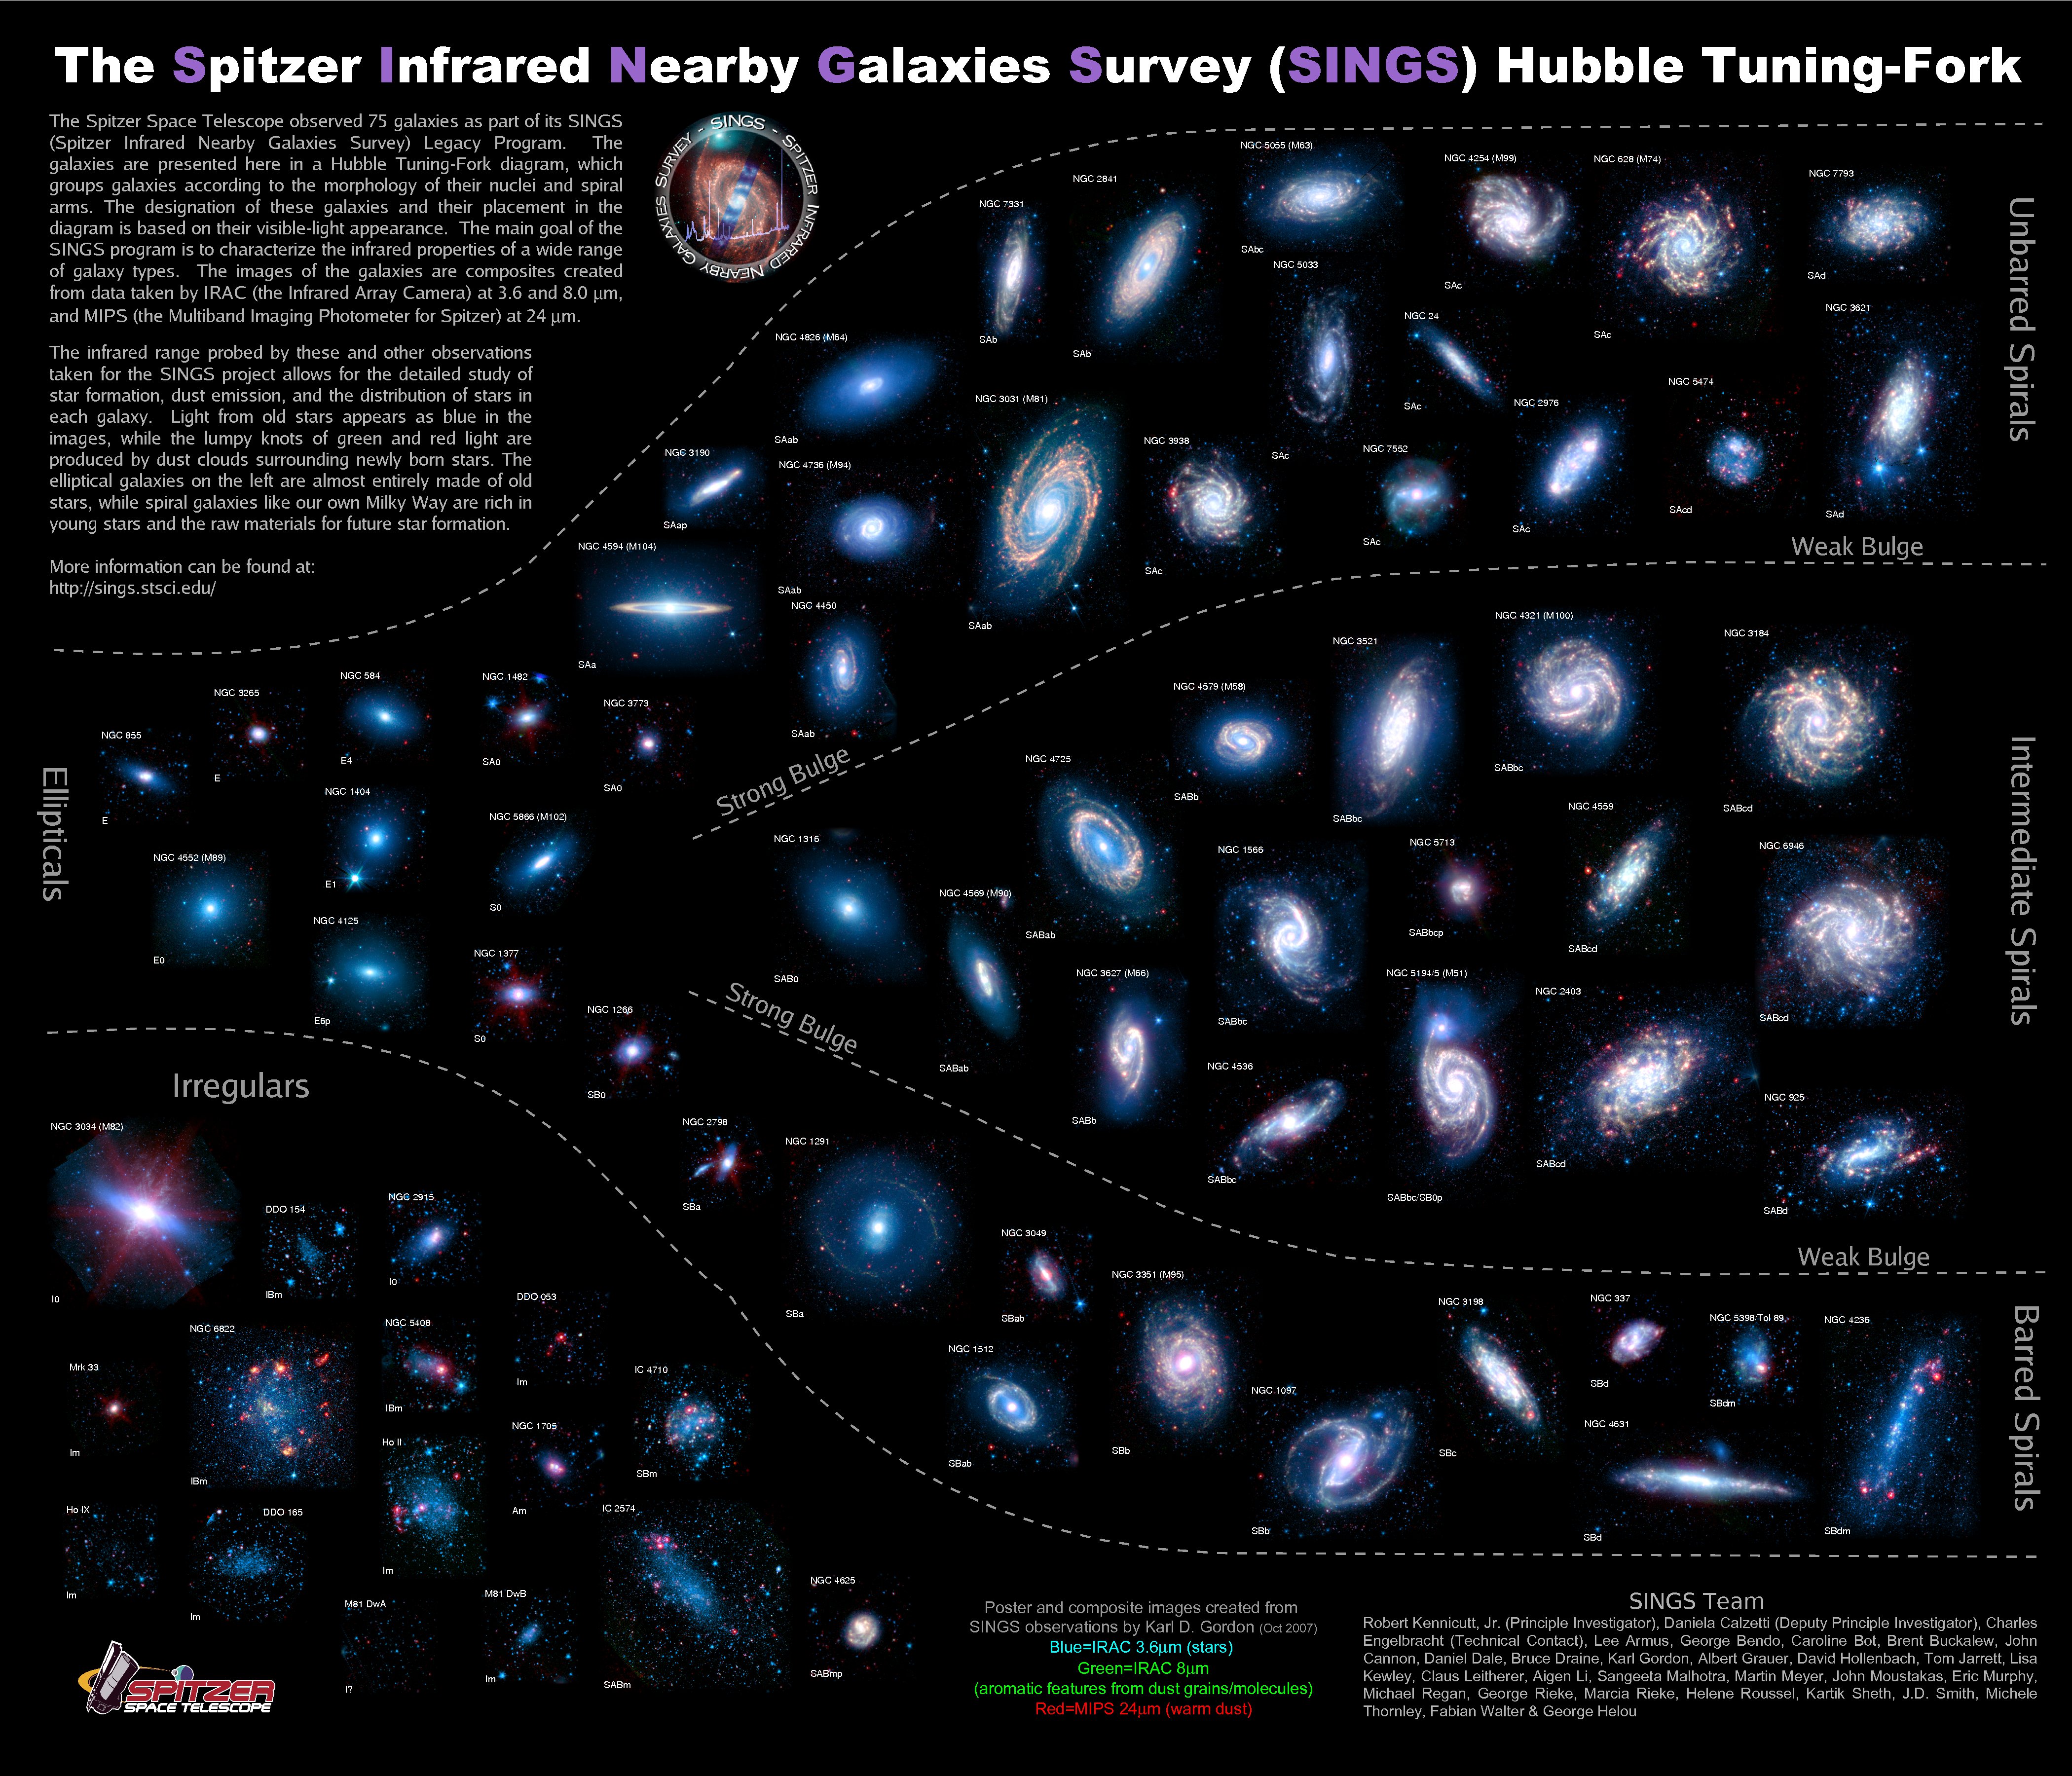
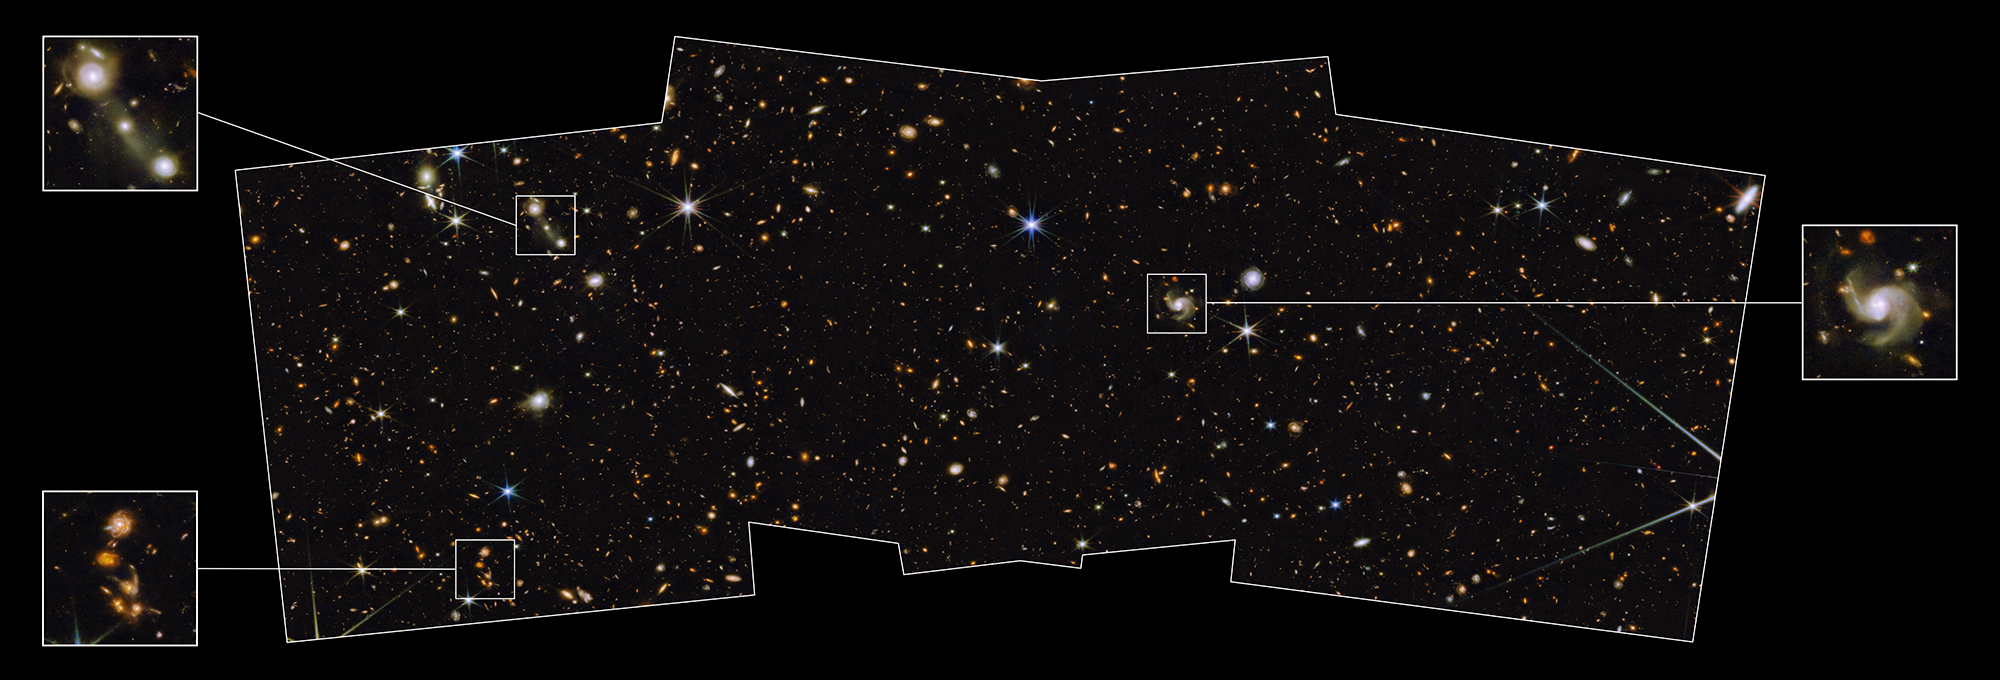